
Abstract
The purpose of this paper is to experimentally investigate the oscillate of a clam-shell shaped droplet on a horizontal fiber by the action of crosswind, quantitatively describe the swing and deformation of the droplet, and analyze the damping force by surface tension. The dynamic images of the droplet are recorded by high-speed cameras, the profile curves in the top view and side view of droplet are both approximated to multiple ellipse arcs. Four kinds of liquids and three nylon fibers are used in the experiments. The experimental results show that the droplet oscillates periodically around the fiber by the flow drag force, the swing frequency is inversely proportional to the droplet mass, but does not increase with Re. In addition to the swing around the fiber, the droplet also oscillates periodically in the radial direction, and the frequency of radial oscillation is higher than that of circular swing, which results in the swing amplitude fluctuation. By the flow pressure, the windward side and the leeward side of the droplet deform asymmetrically, the difference of surface tension force on both sides of the droplet forms a moment against the droplet swing around fiber, the resistance moment increases with the liquid surface tension coefficient and fiber diameter.
Introduction
The movement of droplets attached to fibers in crosswind is a common and important physical phenomenon, widely used in many industrial areas (such as gas filtration, liquid separation, gas dehumidification, etc.). When droplets grow up on fibers, the vibration and movement of droplets can build a liquid film-and-channel between fibers,1,2 which results in a sharp drop in filtration efficiency and a rapid rise in flow resistance. One approach to minimize the liquid films in fiber filter layer is to avoid the movement and gathering of droplets. Therefore, the vibration and deformation of droplets on fibers caused by the crosswind should be studied to provide an exploration of the liquid film formation and expansion.
Droplets on fibers are driven by the coupling effects of surface tension, flow drag force, and gravity. The surface tension force on the liquid and gas interface shrinks the droplet to a sphere, the gravity drives the droplet downward into clam-shell shape, and the flow drag force causes the droplet to swing around the fiber.3–5 Modeling and experimental researches6,7 shown that surface tension has clear influence on the deformation and movement of droplet even on high flow velocity conditions.
In terms of drops stability on fiber, McHale and Newton 8 built a droplet surface tension and free energy modeling method, gave a criterion for droplets changing from barrel shape into clam-shell shape based on the Laplace equation. Yarin et al. 3 described an quantitative model of oil droplets growth on a single fiber, found that droplet interception and Brownian diffusion contribute to drop growth on fibers for airborne oil droplets in the size range from 100 to 1000 nm. Dawar and Chase 9 and Fang et al. 10 shown the correlation estimates the flow drag coefficient as the droplet moves along the fiber, and gave an estimate of the minimum Reynolds number value needed to initiate the droplet’s movement on the fiber. Zhu et al. 11 studied the droplets splitting by a fiber at different velocities, analyzed the lower limit of droplet speed impacting on fiber to split. Gu et al. 12 observed the coalescence separation of droplets adhered to fibers, and gave two threshold velocities in which droplets can be captured.
The previous studies shown that surface tension and flow drag force are the main forces to drive droplets to deform and move on fibers. However, there are still several issues that have not been studied in depth. The quantitative experimental methods for the geometric parameters and surface tension force of a droplet in movement need to be improved to reveal the effect of surface tension on droplet deformation and movement.
The present paper focus on the vibration and deformation of a droplet adhered to a horizontal fiber blown by steady crosswind, mainly including three parts. Firstly, an experiment system was built to shoot the dynamic images of the droplet, including a steady flow pipeline, high-speed cameras, and a synchronization controller to trigger the air flow and cameras. And then, elliptic arc fitting method was proposed to quantitatively analyze the droplet contour, which was verified by dimension calibration and droplet mass calibration. In further, the dynamic deformation characteristics of the droplet swinging around the fiber were analyzed, such as the frequencies of circular swing and radial vibration, H/W and surface area changes with swing angle. Finally, the surface tension force between the windward and leeward sides is analyzed to evaluate the flow drag force acted on the droplet.
Experiment setup and materials
Experiment setup
The schematic diagram of the experiment system is shown in Figure 1, and Table 1 shows the parameters of the experiment.

Schematic diagram of the experiment system.
The parameters of experiments.
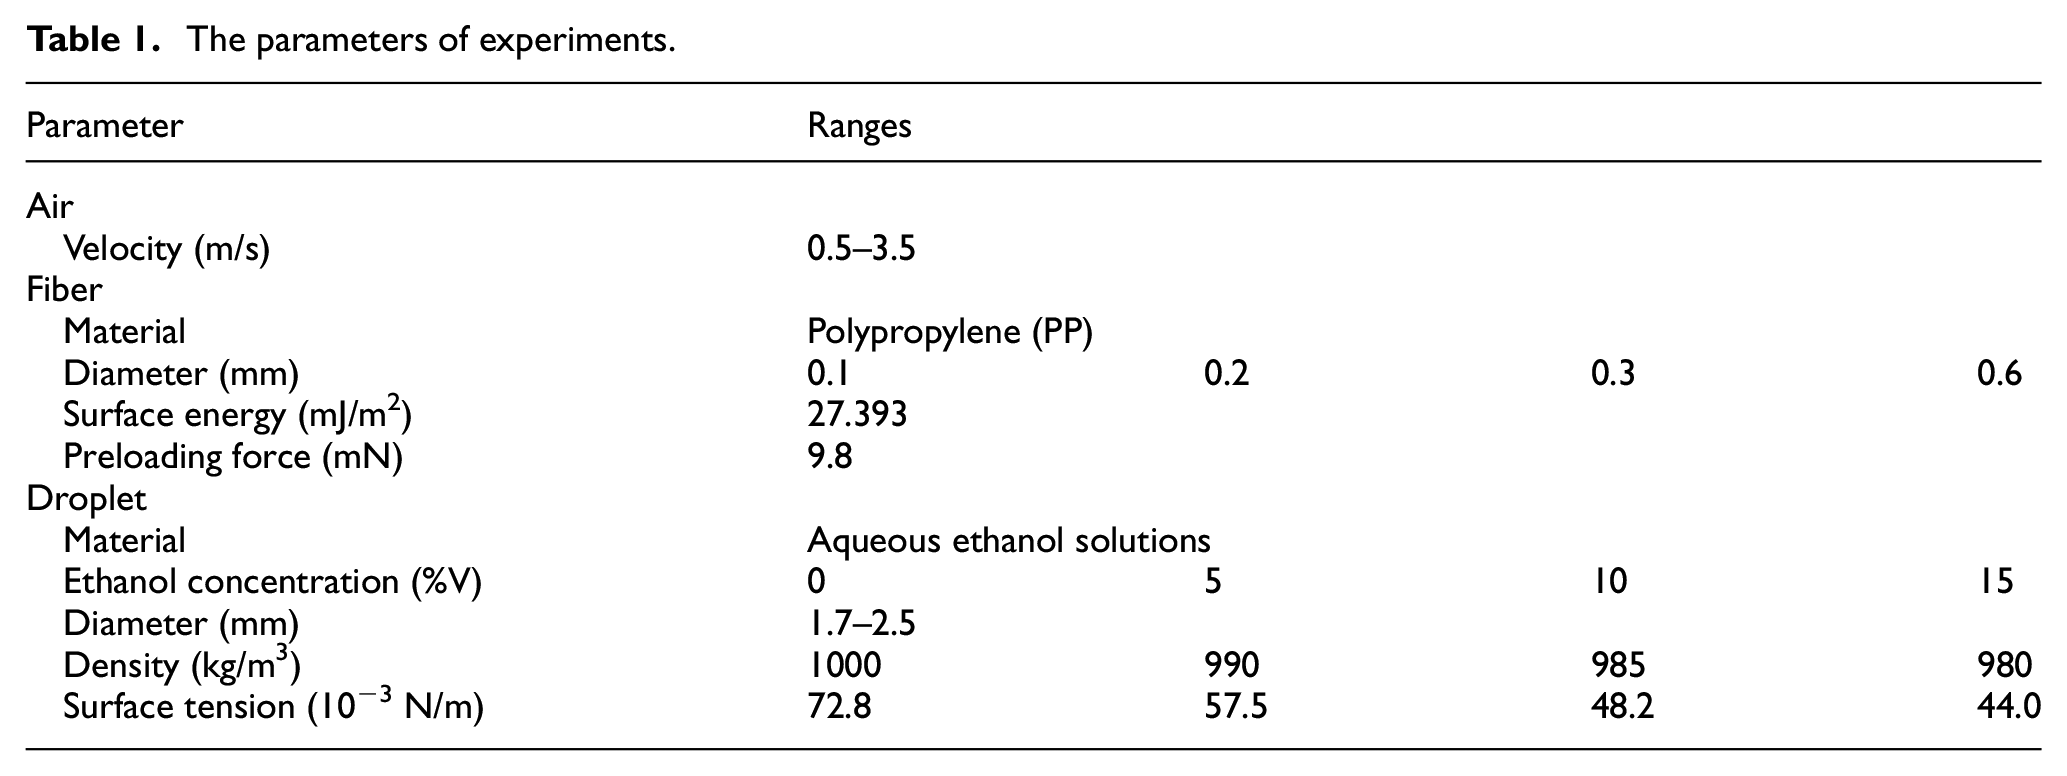
The experimental equipment includes a compressed air tank, a pressure relief valve, an electromagnetic valve, and a straight pipe. The compressed air tank and the pressure relief valve provide a steady air pressure to control air velocity, ranging from 0.5 to 3.5 m/s. An air filter is installed after the pressure relief valve to separate water drops condensed during air decompression, and then there is no droplet capture and growth in the experiment.
The straight pipe is placed horizontally (Y direction) to create a steady airflow. The pipe diameter is 50 mm, length is 1000 mm, and a flow stabilizer is installed at the entrance to minimize the fluctuation of the air flow. A hot wire anemometer is installed in the straight pipe to measure the air flow velocity.
The fiber is horizontally placed at the outlet of the straight pipe (X direction), the distance of the fiber to the outlet is 5 mm, much smaller than the pipe diameter. Weights are loaded at the end of the fiber to apply a preloading force. Two high-speed cameras are installed in the top view (Z direction) and the side view (X direction), respectively.
Four kinds of liquids are used in the experiment, namely deionized water, aqueous ethanol solutions with 5%, 10%, and 15% by volume concentration. The clam-shell droplet is initially placed on the fiber by a pipette in 4–4.5 μL. When the drop and the fiber are both steady, a trigger signal is given by controller to switch on the electromagnetic valve and the high-speed cameras synchronically, and the vibrations of fiber and drop due to the crosswind are recorded in 500 figures per second (fps), the image resolution is 800 × 600 pixels.
The surface energy between the fiber material and liquid is measured by the droplet contact angle on the membrane of the same material as the fiber. According to the Young equation shown as equation (1), when θ is less than 90°, γSL is larger than γSV, the material is hydrophilic, and the material is hydrophobic when θSL is larger than 90°.

where, γ is the surface energy (mJ/m2), the subscripts SV, SL, and LV refer to the interfaces between solid and liquid vapor, solid and liquid, liquid and vapor, respectively; θ is the liquid droplet contact angle on solid plane. γLV is numerically equal to the surface tension coefficient (σ) of liquid.
Image size calibration
Before the experiment, the cameras are calibrated by checkerboard image recognition. On the checkerboard, the size of gray squares is 0.5 mm × 0.5 mm, size error is 0.01 mm. The pixel distance of the square edge is measured by the image edge recognition method in Matlab. In Figure 2, k is the ratio of image size (pixels) to real size (mm) by linear fitting method, emax and emin refer to the maximum and minimum fitting errors, σe is the standard deviation of fitting error. The mean fitting errors of image distortion in both horizontal and vertical directions are less than 0.006 mm. Compared with the movement and deformation of the droplet (R ≈ 1 mm), the optical resolution of camera and lens used in the experiment is high enough to reveal the micro deformation of the droplet caused by the cross flow.

Image size calibrate of the high-speed cameras.
Droplet profile fitting
To quantify the geometry characteristics of the droplet (including the gravity center, the angle of central axes, the radiuses in each axis, and the surface area and volume), the droplet edge needs to be fitted by function curves according to the discrete data of edge recognition. Elliptical arc fitting method 13 is used to fit the droplet edge in this study, and the fitting elliptical parameters are solved by the least square method, shown as equation (2).

where, (xi, yi) is the discrete data of droplet edge in a picture, i = 1 − n; rx and ry are the ellipse radiuses in X and Y axis; (x0, y0) is the position of ellipse center.
In the top view, the droplet profile is symmetrical along the fiber axis under the action of gravity on the initial condition. When the droplet swings around the fiber under the flow drag force, the radius on the windward in the Y direction is different from that on the leeward side, and the radius in the X direction is reduced compared to the initial state. Therefore the shape of droplet is described by two elliptical arcs shown in Figure 3(a). According to the top view result, the offset of droplet gravity center from the fiber center in the Y direction (δy) and the radius of droplet in the X direction (rx) are obtained, which is used for the droplet profile repair and swing angle calculation in the side view.

Elliptical arcs fitting of the droplet edge discrete data: (a) top view and (b) side view.
Due to the deformation of droplet by surface tension, the maximum fitting error occurs at the junction area between the droplet and fiber. On the whole profile, the maximum fitting error is 1.55 pixel (≈0.012 mm). Except for a few points larger than 2σ (two times of the standard deviation of fitting error, 95% confidence intervals in a normal distribution), most fitting errors are less than 0.84 pixel (≈0.007 mm).
With consideration of droplet swing around fiber, a new coordinate system in the side view is built to show the droplet deformation on the windward and leeward sides. The gravity center of droplet profile is taken as the original center of the coordinate system in side view, the line from geometry center to fiber center is Z direction, and the vertical line to Z direction is taken as Y direction, shown as Figure 3(b). The droplet profile is divided into four parts by the coordinate system and fitted by four elliptical arcs. The droplet profile in the right of Z axis is called the windward side, and the left part is leeward side.
There is a clear fiber shadow on the top of the droplet due to the refraction of light by the transparent fiber, which makes the droplet profile recognition error. The relative displacement of the droplet center to the fiber (δy) has been recognized from the top view, and the y-coordinate of fiber center is obtained. And then, the fiber shadow on the top of the droplet is removed by elliptical arc fitting. The distance from the droplet gravity center to fiber center (rz1) is measured, and the swing angle is determined, α = a sin(δy/rz1).
Because of the four-segment ellipse fitting, the contour fitting error in the side view is smaller than that in the front view. The maximum fitting error occurs at the junction between the droplet profile and the fiber, because the droplet profile is repaired to fix the fiber shadow.
Limited by the installation of light sources and the light transparency of fiber, the front view of droplet is not recorded in the experiment, and it is difficult to estimate the contact length of the droplet and fiber. Therefore, the droplet is simplified to a deformed ellipsoid, the surface area and volume of droplet are calculated based on the integral method, shown as equation (3).
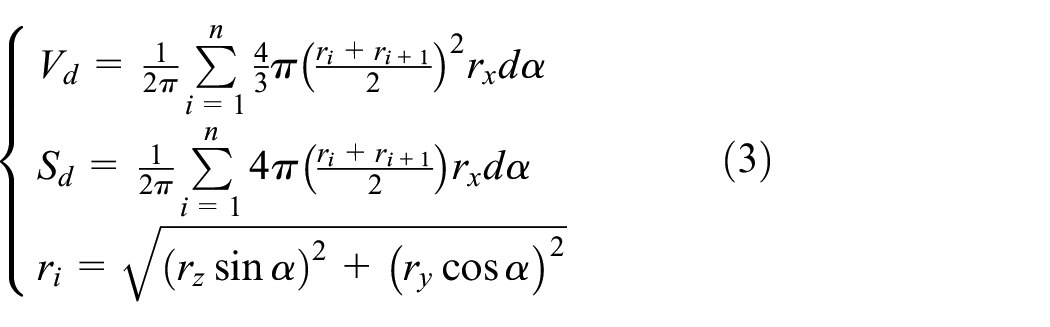
where, ri is the droplet radius from the side view, m, i = 1 − n; dα is the angle between two points of ellipse arc on the Y-Z plane, rad; Vd (m3) and Sd (m2) refer to the volume and surface area of droplet, respectively.
Droplet mass calibration
In the droplet mass calibration experiment, the mass of droplet is measured by an electric balance, with 0.1 mg error. The droplet volume and mass are calculated according to the top and side image by equation (3). The calibration of image recognition is shown as Figure 4. For 0.3 mm fiber, the maximum error of image recognition method is 0.7 mg, occurs at the smallest droplet size, and the droplet mass error decreases as the droplet size increases. It indicates that the error of image recognition method mainly lies in the contact line of the droplet and fiber. The ratio of droplet volume to fiber volume increases with the increase of the droplet volume, then the droplet volume error of image recognition decreases as a result.

Droplet mass reorganization calibrating via measurement.
We calculate the standard deviation (σe) of the recognition results to experimental result, remove the big error points larger than ±2σe and get the 95% confidence interval. Within the 95% confidence interval, the droplet mass identification error is less than 0.5 mg, the relative error is 3.2%, which shows that the measuring method of droplet volume in the present experiment has good accuracy and adaptability.
Results and discussion
Shape of droplet
We began the presentation of our experimental results by demonstrating the deformation of droplet as it swings around the fiber due to cross-flow. Figure 5 presents the swing angle of droplet relative to fiber, and the evolution of the droplet radius due to the crosswind.

Droplet swing and deformation on fiber due to cross flow (water, Re = 177, df = 0.1 mm): (a) The droplet swing angle and geometric dimensions evolution over time and (b) The dimensionless deformation of droplet changes with Bo.
As the clam-shell droplet swing around fiber under the action of cross flow, the amplitude of swing angle also changes periodically, shown as Figure 5(a). The droplet is elongated in Z direction by the flow drag force, and the increment of rz1 (from the fiber center to the droplet gravity center in Y-Z plane) is larger than rz2 (from the droplet gravity center to the droplet bottom edge in Y-Z plane). It means the droplet deforms unevenly by the action of the flow pressure, and different surface tension forces are generated on the windward side and the leeward side to balance the flow pressure.
By the action of surface tension force of droplet, the radius of droplet in Y direction decreases, especially the radius in the windward (ry1) is significantly smaller than the leeward one (ry2). The curvature difference between the windward and leeward sides forms a surface tension along the Y direction, which is balanced with the drag force of air flow.
The couple effects of dimensionless droplet deformation are quantitatively evaluated by the Bond number, 13 which is defined as equation (4) in the present study. The numerator of equation (4) refers to the droplet gravity, the denominator is the surface tension between fiber and droplet, and Bo is the ratio of droplet gravity to surface tension. For a spherical droplet on fiber, Bo = 3 means that the surface tension of droplet is equal to its gravity.

where, ρ is the liquid density, kg/m3; H is the droplet height, m; df is the fiber diameter, m; and σ refers to the surface tension coefficient of liquid, N/m.
Under steady state, the droplet is shaped to clamshell under the action of gravity and surface tension force, and rz1 is larger than rz2. Due to the flow drag force, the droplet rotates around the fiber, the fiber capillary force increases accordingly, and then the droplet is elongated in Z direction with rz1/rz2 little change. With the increase of height, the droplet width decreases, especially the droplet radius on the windward side decreases more, which results in H/W, rz2/ry1, and rz2/ry2 linearly increasing with the Bo increases.
Swing frequency
As the droplet periodically swings around fiber, the swing frequency is stable but the amplitude changes with time significantly, shown as Figure 6(a). It is seen in Figure 6(c) that the ratio of Height to Width (H/W) of droplet also changes periodically at the same time of the droplet swing, but its main frequency (23 Hz) is higher than that of the droplet swing (14 Hz).

Time and frequency domain analysis of droplet swing angle and H/W (water, Re = 177, df = 0.1 mm): (a) The swing angle of droplet changes with time, (b) The power spectral density of droplet swing angle, (c) The dimensionless deformation in radical direction (H/W) changes with time, and (d) The power spectral density of droplet deformation in radical direction.
The vortex generated by the cross flow passing through the droplet causes periodic fluctuation of the flow drag force on the droplet, the vortex frequency of flow around a ball increases linearly with flow velocity and decreases with diameter, shown as equation (5).

where, V0 is the upstream flow velocity, m/s; d refers to the ball diameter, m; St is the Strouhal number, 0.21 (Re 102–105).
At the experiment conditions (V0 = 0.5–3.5 m/s, d = 1.7–2.5 mm, Re = 150–400), the vortex frequency ranges from 60 to 300Hz, it is much higher than the droplet swing frequency.
Furthermore, the swing of droplet can be seen as a simple pendulum swing around the fiber, the pendulum length is the distance from the fiber center to the droplet gravity center (∼H/2), and the natural frequency of the simple pendulum is shown as equation (6). For diameter 1.7–2.5 mm droplets, the natural frequency ranges from 14 to 17 Hz, agrees well with the swing frequency result shown in Figure 6(b). It means that the flow drag force drives the droplet to move around the fiber, the movement of droplet around fiber is similar to a pendulum swing.

where, H is the droplet height, m; g is the acceleration of gravity, 9.8 m/s2.
Besides the circular movement around the fiber, the droplet also deforms in the radical direction. From the view point of a mechanical system vibration, the natural frequency depends on the stiffness and mass of the system, and the actual vibration frequency in the mechanical system with damping decreases with system damping ratio, shown as equation (7). The oscillation frequency in radial direction is visibly higher than that in circular direction and the droplet mass is the same, and then the droplet stiffness in radial direction is higher than that in circular direction.
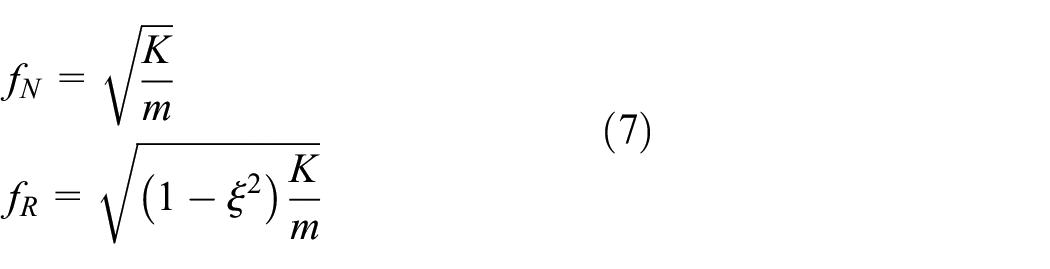
where, fN is the natural frequency of mechanical system without damping, Hz; fR is the actual vibration frequency of mechanical system with damping, Hz; K is the stiffness, N/m; m is the mass, kg; ξ refers to the system damping ratio, –.
Because the droplet gravity is totally balanced by the surface tension of droplet, the droplet stiffness in radial direction is the surface tension coefficient of liquid (σ). By the experimental vibration frequency in radial direction, the damping ratio of droplet is obtained. For a water droplet (m = 4.02 mg, σ = 72.8 mN/m), its natural frequency (fN) is 134.5 Hz and the real vibration frequency (fR) is 23 Hz, then the damping ratio is 0.985 and the vibration of droplet in radial direction is a critical damping system. On the low Re condition, flow velocity inside droplets is too low to generate sufficient damping force by liquid viscosity inside the droplet. The phase difference between surface tension and droplet velocity makes the surface tension to become a damping force for a period of time, the response lag of surface tension compared with velocity plays an important role in the damping force of droplet.
Figure 7 shows the frequency of droplet swing angle changing with the droplet mass and Re. As the ethanol content increases, the surface tension and density of the liquid decrease, and the capillary force between the droplet and the fiber declines, then the droplet size and mass reduce accordingly. With the increase of droplet size and mass, the swing frequency decreases linearly, shown as Figure 7(a). On the contrary, the swing angle frequency increases with the decrease of liquid density and surface tension coefficient, but does not change significantly with the increase of Re, shown in Figure 7(b). It is known from equation (5) that the vortex frequency increases with Re, but the droplet swing frequency does not increase linearly with Re, which indicates that the swing of droplet around fiber can be seen as a simple pendulum motion driving by the flow drag force, the periodical variation of flow drag force by vortex cannot change the droplet swing frequency.

The main frequency of droplet swing angle evolution with the droplet mass and Re: (a) The main frequency of droplet swing angle evolutes with droplet mass and (b) The main frequency of droplet swing angle changes with Re.
Surface tension force
Limited by the droplet size, it is difficult to accurately measure the dynamic flow velocity or flow pressure around the swing droplet, the flow drag force acting on the droplet cannot be measured directly. In this experiment, we found that the surface area of the droplet changes periodically with its swing angle, and the surface area difference between the windward and leeward sides represents the changes in surface tension energy. With the considering of the boundary length between the windward side and the leeward side of the droplet is the same, the difference of surface tension force is defined as equation (8).

where, ΔEσ is the difference of surface tension energy, J; σ is the surface tension coefficient, N/m; ΔS refers to the surface area difference between the windward and leeward sides of droplet, m2; Fσ is the surface tension force difference between windward side and leeward side, N; Mσ is the driving moment aroused by the surface tension force, Nm; rx and rz is the droplet radius in X and Z directions, m.
While the droplet swings around the fiber, the difference of surface area between the windward side and the leeward side periodically fluctuates, and the amplitude of the upper half of the droplet is opposite to that of the lower half, which forms a moment driving the droplet to swing around fiber, shown as Figure 8(a).
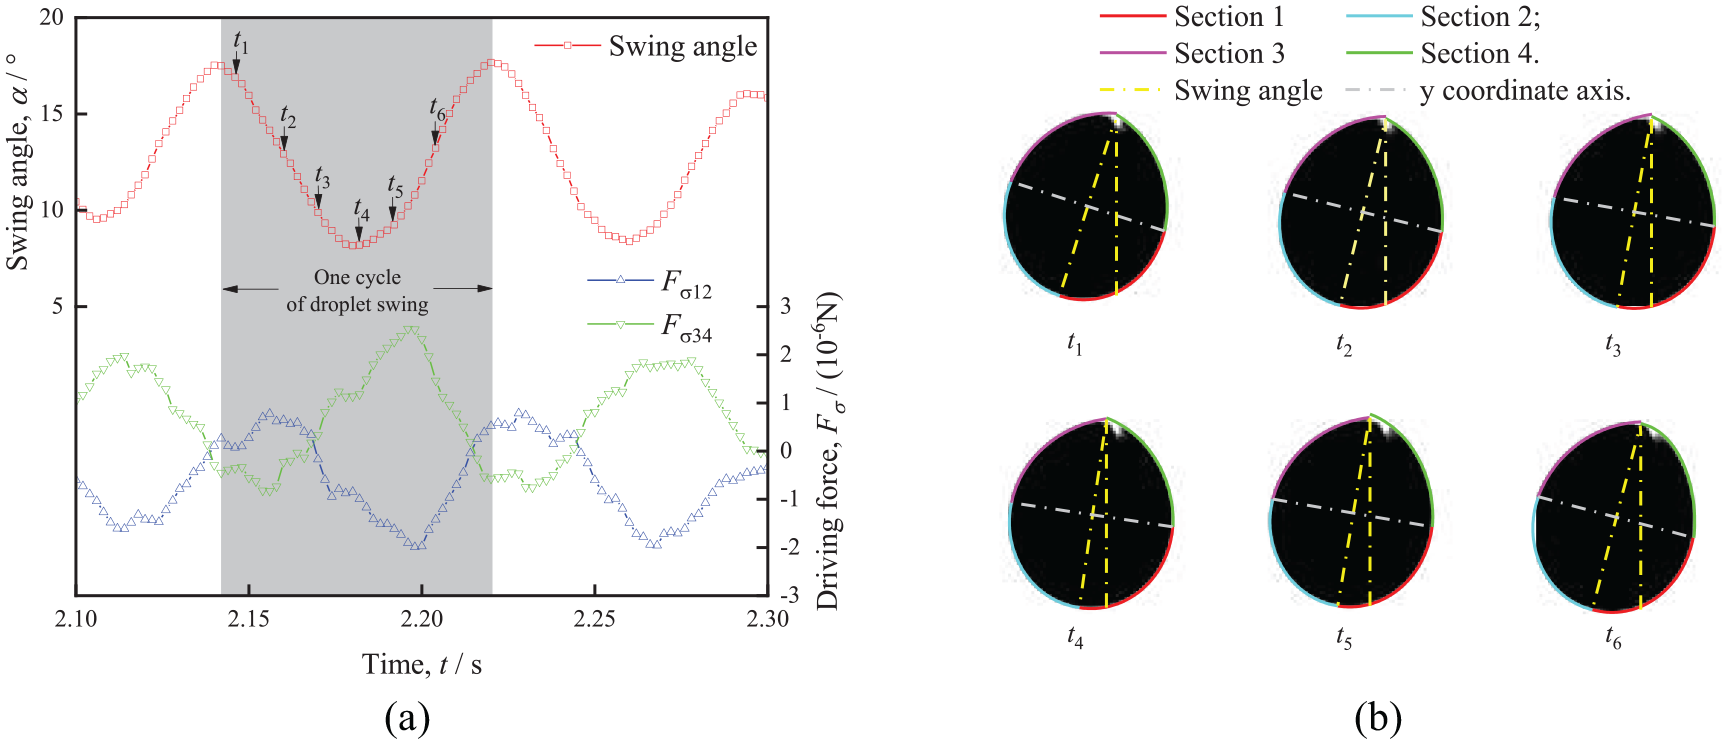
The swing angle and surface tension force evolution (water, Re = 363.9, df = 0.1 mm): (a) The swing angle and driving force of droplet change over time and (b) The droplet curvature variations in side view (y-z plane) caused by the cross flow.
The flow pressure causes uneven deformation on the windward side and the leeward side of droplet, and the difference in surface area results in an imbalance surface tension force, which forms a driving moment that makes the droplet swing periodically. The driving moment is always 1/2 cycle time ahead the swing angle, shown as the attached video.
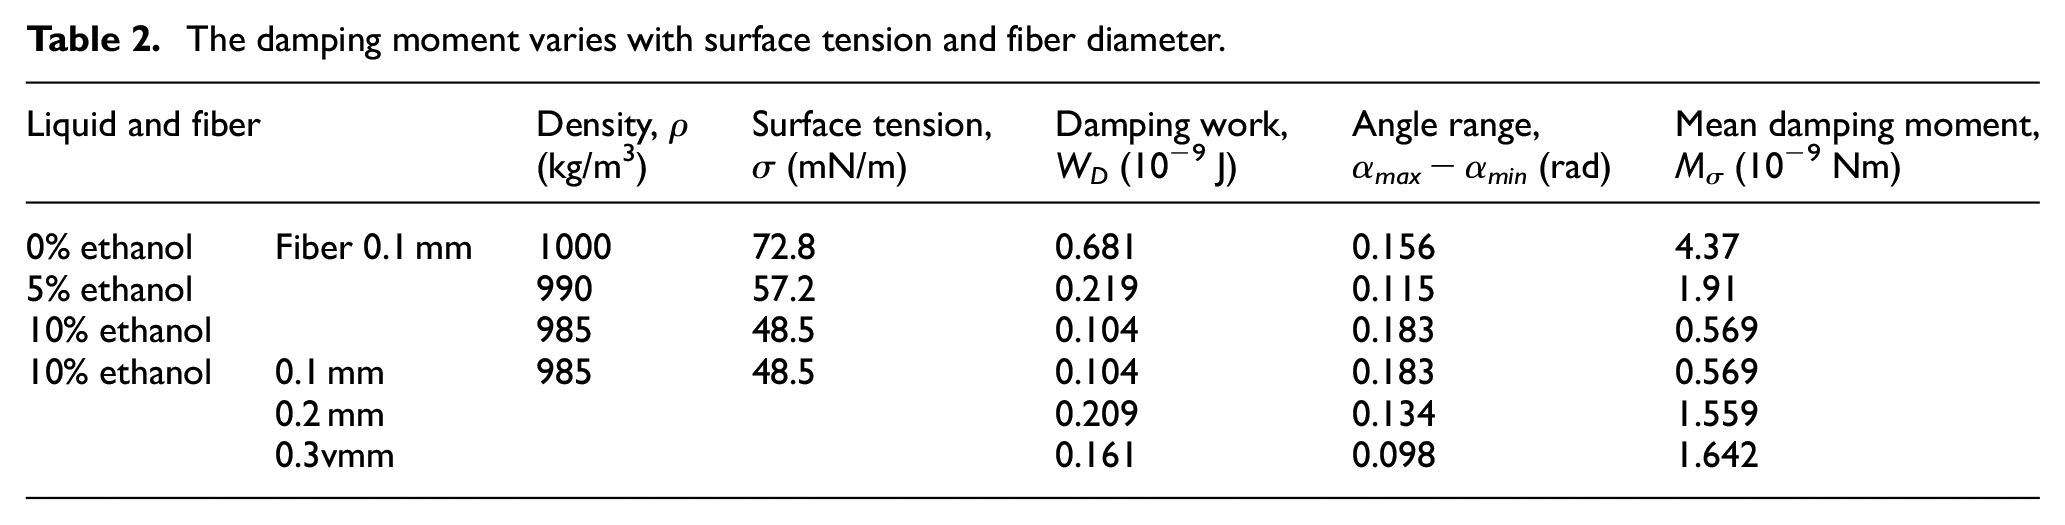
The evolution of driving moment and swing angle in one cycle is shown as Figure 9(a), the driving moments of droplets are analyzed on the same flow velocity and Bo conditions. The curve area means the damping work to the droplet rotation in one cycle by surface tension, and the ratio of damping work to swing angle range indicates the mean damping moment acted on the droplet, shown as Table 2.
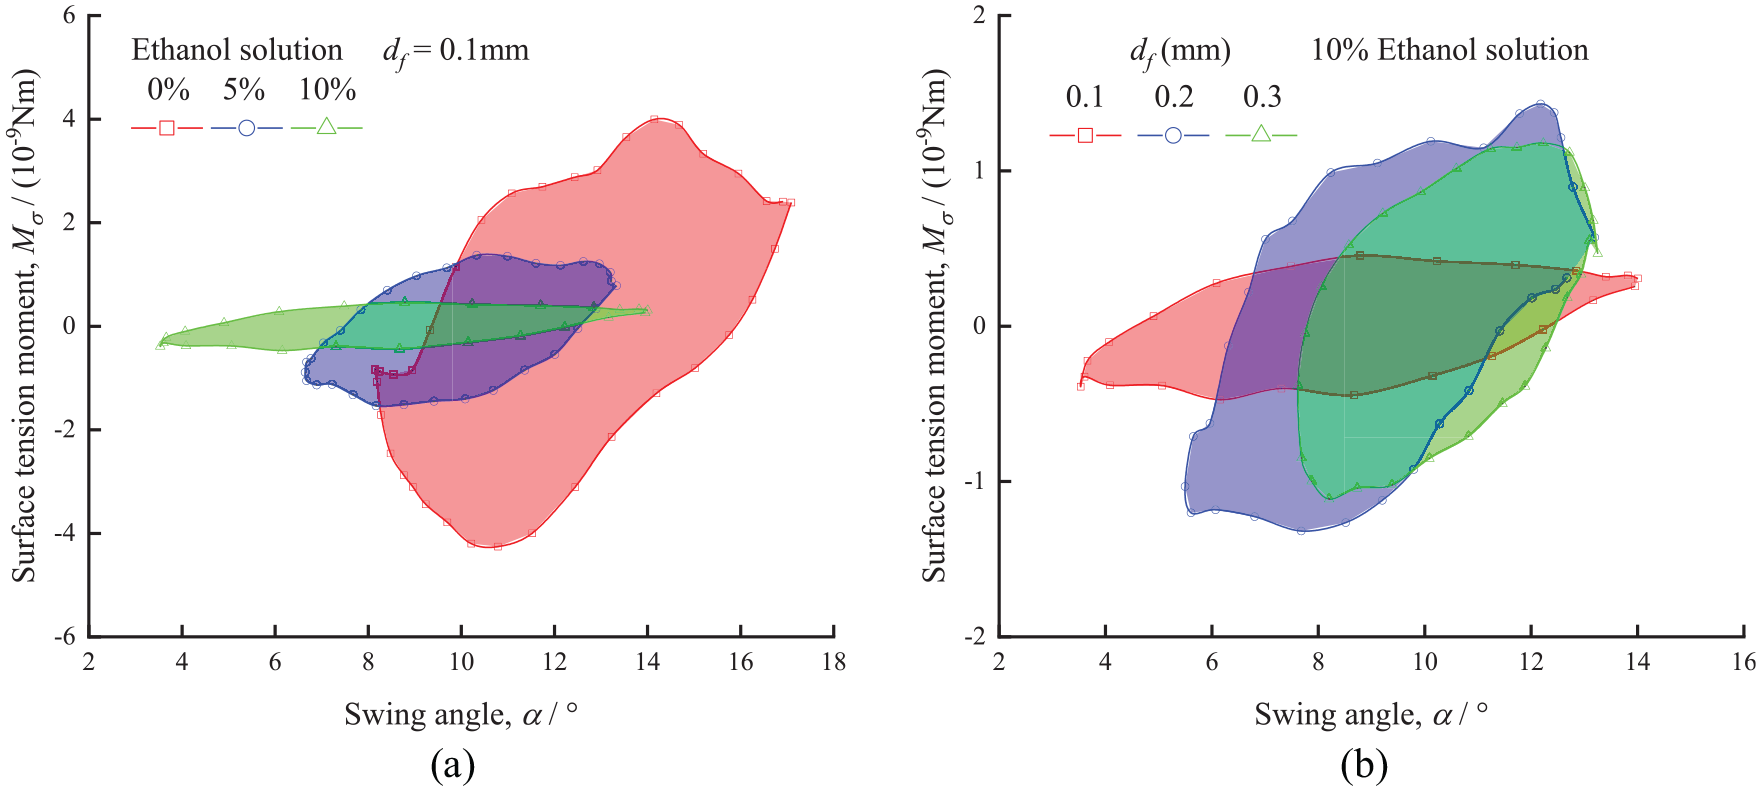
The evolution of droplet swing angle and the driving moment of surface tension: (a) The driving moment aroused by the droplet deformation evolutes with liquid surface tension and (b) The influence of fiber diameter on the driving moment of droplet.
The damping moment varies with surface tension and fiber diameter.
Affected by the resistance of the fiber capillary force between droplet and fiber, the driving moment and swing angle of droplet forms a hysteresis loop. With the increase of droplet surface tension, the damping work by surface tension in one cycle increases accordingly, which shows that the damping force of droplet mainly comes from its surface tension, and the phase lag between droplet deformation and vibration makes the surface tension to be a damping force.
In addition to surface tension, fiber diameter has a little influence on the damping work. On the same flow velocity and Bo conditions, the droplet size increases with fiber diameter, and then the droplet swing angle range decreases due to the droplet mass increase, therefore the damping work of 0.3 mm fiber is less than that of 0.2 mm fiber.
Though the swing angle range decreases with fiber diameter, the flow drag force is constant at the same flow velocity, and the surface tension difference between the windward and leeward sides is at the same level, then the damping moment increases due to the and its arm length increases with fiber diameter.
Conclusion
We have conducted experiments to investigate the swing and deformation of a clam-shell shaped droplet on a fiber by the action of crosswind. A high-speed camera system is used to record the deformation and trajectory of droplet. Four kinds of liquids, namely deionized water, 5%, 10%, and 15% ethanol aqueous solution (by volume concentration) are considered in the experiment. The airflow velocity ranges from 0.5 to 3.5 m/s, and the diameters of nylon fibers are 0.1, 0.2, 0.3, and 0.6 mm.
The experimental result shows that the droplet swing around the fiber due to the action of crosswind, the droplet swing angle frequency is stable, and the swing angle amplitude fluctuates significantly. The swing frequency of droplet around fiber is close to the natural frequency of a simple pendulum with droplet radius as pendulum length. The vibration frequency of droplet in radial direction is higher than the swing frequency, which mainly depends on the surface tension, droplet mass, and damping force. The phase lag between vibration velocity and surface tension results in the damping force.
As the droplet swing, the droplet is elongated along Z direction and compressed in Y direction. The frequency of droplet deformation in the axial direction is higher than the frequency of droplet swing, the difference results in the swing angle amplitude fluctuation.
In further, there is a clear surface area difference between the windward and leeward sides, which forms a surface tension difference between both sides. There is a significant phase lag between surface tension and droplet swing angle, which makes the surface tension as a damping force during droplet swing around fiber.
Finally, the evolution of driving moment and swing angle shows that the mean damping moment by surface tension increases with surface tension coefficient and fiber diameter.
Footnotes
Handling Editor: Chenhui Liang
Declaration of conflicting interests
The author(s) declared no potential conflicts of interest with respect to the research, authorship, and/or publication of this article.
Funding
The author(s) received no financial support for the research, authorship, and/or publication of this article.