
Abstract
A design method for a lightweight unmanned sightseeing vehicle frame was proposed based on multi-condition and multi-objective optimization to improve the vehicle’s range and reduce its production cost. First, a finite element model of the frame is established, and its static and dynamic characteristics are analyzed. Then, the wall thickness of the middle beam of the frame was selected as the design variable, and its sensitivity was analyzed. Sample points were generated from the design variables using the Latin hypercube sampling method, and the corresponding response values of the sample points were calculated. A Kriging approximation model was established using the sample points and response values and replaced the actual model for optimization. Finally, a multi-condition and multi-objective optimization mathematical model of the frame was established with the minimum mass, maximum first-order natural frequency, and the minimum stresses under full load bending and torsion conditions as the objectives. The multi-objective genetic algorithm was used for the lightweight design by comparing the fuzzy matter element and analytic hierarchy process methods to select the optimal design and to verify the rationality of the final design scheme. The results show that this method results in an optimized frame meeting the strength requirements under various working conditions and reducing the frame mass by 5.4%.
Keywords
Introduction
Lightweight automobile designs can reduce cost, improve mileage, and improve the operational stability and safety of the vehicle. 1 An unmanned sightseeing vehicle uses a power battery as its power source, significantly reducing environmental pollution and improving vehicle quality and simultaneously reducing its endurance. At present, the specific energy of power batteries is low, 2 so it is imperative to study lightweight frames when the battery’s capacity cannot be improved.
Lightweight automobiles have long been a popular research topic. According to different design variables, lightweight automotive structural design can be divided into size optimization and topology optimization. 3 In a study of structural topology optimization, Zhong et al. 4 adopted a genetic algorithm to optimize the multi-objective topology and size of a bus body frame, reducing the optimized frame mass by 97.9 kg. Zhu et al. 5 established a multi-objective topological optimization mathematical model of spatial-structure joints by using the compromise programming method under the constraints of each static load condition to realize a lightweight design. Zhao et al. 6 carried out a multi-objective topological optimization design for an automobile powertrain mounting bracket considering various static and dynamic working conditions. In the above studies, researchers took multiple working conditions as constraint conditions for multi-objective optimization, and the optimized frame met the requirements of multiple working conditions with improved safety. 7 Therefore, this paper considers multiple conditions as the multi-objective optimization constraints.
Significant research has been conducted on the multi-objective optimization of structure sizes. Gauchia et al. 8 adopted a genetic algorithm to optimize the structure of a bus frame and selected the appropriate beam section through sensitivity analysis, reducing the frame’s weight without reducing its torsional stiffness. Asanjarani et al. 9 used the second generation of the non-dominant sorting genetic algorithm (NSGA-II) to conduct multi-objective optimization of a tapered thin-walled square pipe and improved its crash-resistance. Zhou et al. 10 established a multi-objective optimization model for the flat structure of a military tire, adopted the NSGA-II algorithm to achieve an optimal design, and compared it with the single-objective optimization method, demonstrating the multi-objective optimization method’s superiority.
Li et al. 11 established a multi-objective optimization model for the discrete thickness of damping materials and determined their layout based on a genetic algorithm (GA) to reduce structural noise. Jiang et al. 12 adopted a Kriging approximation model and NSGA-II to carry out multi-objective optimization and realize a lightweight design for the control arm and torsion beam. Wei et al. 13 used a response surface optimization module and multi-objective genetic algorithm in ANSYS Workbench to optimize the structural size of the inner cavity of the lower rocker arm. Based on this prior research, this paper introduces Kriging approximate model technology and a multi-objective genetic algorithm to optimize the frame of an unmanned sightseeing vehicle and obtain the Pareto frontier.
It is necessary to sort the candidate design points to select the optimal design points from the Pareto front. Wang 14 used the fuzzy matter element method to conduct a multi-objective comprehensive evaluation of a femoral prosthesis and determined a material matching the prosthesis size. Zhang et al. 15 established an evaluation grade analysis model of shaft stability and sorted the main factors affecting shaft stability using comprehensive weight and fuzzy matter element methods. Zhang et al. 16 used the fuzzy matter-element method to accurately predict the habitat suitability distribution of Gynostemma pentaphyllum in the present and future periods. When researchers directly select the optimal design point, 17 human subjective factors can greatly influence the final result. The fuzzy matter element method can be used to determine the weight of candidate schemes and objectively select the optimal design point, avoiding the influence of human subjective factors. Therefore, the fuzzy matter element method is introduced here to sort the candidate design points to select the optimal design scheme.
Kriging approximate model technology and the comprehensive evaluation method are applied to the research to effectively solve the multi-objective optimization problem. Jiang et al. 18 used a Kriging approximation model and the NSGA-II algorithm to carry out a multi-objective lightweight design for a dump truck compartment and used the TOPSIS method to select the optimal solution from the Pareto front. This method reduces the dependence on engineering knowledge and conveniently selects the optimal solution. Liu et al. 19 conducted a multi-objective optimization design for a machine tool shake seat, obtained six groups of non-inferior solutions, and selected the optimal design scheme using the fuzzy matter element method and entropy weight method. Qiao et al. 20 used the analytic hierarchy process (AHP) to conduct a weight analysis for several working conditions and carried out a multi-objective topology optimization design for an electric truck frame, improving the utilization rate of frame materials and the structural performance.
Jiang et al. 21 carried out a multi-objective optimization design of a control arm based on a Kriging approximation model and the NSGA-II algorithm. The optimal design of the control arm was determined from the Pareto solution by entropy-weighted gray relation analysis. Each of the above comprehensive evaluation methods can select the optimal solution, but whether different comprehensive evaluation methods produce the same solution to a problem is a part of this study to be verified. This paper uses the fuzzy matter element method and AHP to select the optimal Pareto solution and verify the rationality of the fuzzy matter element method.
Based on previous studies, this paper takes an unmanned sightseeing vehicle frame as the research object and proposes a lightweight design method for the frame with multiple working conditions and objectives. Sample points are generated by sampling design variables using the Latin hypercube sampling method. The maximum stress responses of the frame at the sample points for various values of mass, low order natural frequency, and full load bending and torsion at full load are calculated, and a corresponding Kriging approximation model is established. A multi-objective genetic algorithm is used to optimize the frame for multiple conditions and objectives, and the Pareto front is obtained. The fuzzy matter element method and AHP are used to sort the selected candidate design points, compare the sorting results, select the optimal design scheme, and realize the lightweight unmanned sightseeing vehicle frame design.
The remainder of this article is organized as follows. First, the finite element model of the frame is established, and modal and static analyses of the frame are carried out. In Section “Kriging approximation model,” the Kriging approximation model of the frame is developed, and the accuracy of this model is verified. In section “Multi-condition and multi-objective optimization,” a multi-condition, multi-objective optimization mathematical model of the frame is established, and a multi-objective genetic algorithm is introduced. This section also uses the fuzzy matter element method and AHP to select the optimal design and verify the design scheme’s feasibility. Finally, the study’s conclusions are summarized in Section “Conclusions.”
Modeling and analysis
This paper chooses the frame of an unmanned sightseeing vehicle as the research object. The vehicle’s overall length is 8.5 m, and the frame’s initial weight is 1129.2kg. The frame is welded with rectangular steel and a steel plate with a wall thickness of 3–5 mm. A photograph of the vehicle is shown in Figure 1. The frame material is Q355B, and the relevant material parameters are shown in Table 1.

A photograph of the unmanned sightseeing vehicle.
Q355B material parameters.

The SolidWorks computer-aided design software was used to construct a three-dimensional frame model, simplified by ignoring rounded corners and removing additional parts. All rectangular steel wall thicknesses in the frame were parameterized so they could be co-simulated with the ANSYS Workbench software to facilitate the subsequent design optimization. Then, the model was imported into ANSYS Workbench for pre-processing in the DesignModeler module. After the processing was completed, the model was discretized into solid elements. After many analyses and calculations, the final grid size was set to 10 mm, resulting in 1237,246 elements and 2416,849 nodes. The generated finite element model is shown in Figure 2.

Finite element model of the unmanned sightseeing vehicle frame.
Analysis of static and dynamic characteristics of the frame
Static analyses
When unmanned sightseeing vehicles drive on closed roads such as industrial parks or ports, a comprehensive static analysis should be considered under the limiting conditions of bending and torsion at full load. The boundary constraint conditions of these two conditions are shown in Table 2.
Boundary constraint conditions of two working conditions.

The unmanned sightseeing vehicle frame mainly carries passengers, seats, a battery pack, and electric components. These loads are added to the frame according to their actual distribution. The load distribution is shown in Figure 3, and the load quality parameters are shown in Table 3.

The load distribution.
Load weight parameters.

Full load bending condition
The four wheel positions of the frame are constrained according to the boundary constraint conditions of the full load bending condition, and gravity is added. The dynamic load coefficient is taken into account for all loads on the frame. The dynamic load coefficient in the full load bending condition is 2, 22 and the loading diagram is shown in Figure 4(a). Finite element analysis is carried out on the frame, and the analysis results are shown in Figure 4(b).

Full load bending finite element analysis results: (a) loading diagram and (b) stress contours.
The results show that the maximum stress is 261.59 MPa, less than the 355 MPa maximum yield limit of frame material. The maximum stress point is the battery bracket installation location in the rear section of the frame. The frame structure meets the safety requirements.
Full load torsional condition
The boundary constraint conditions of the full load torsional condition were applied to the positions corresponding to the four wheels on the frame, and gravity was added. The dynamic load coefficient in the full load torsional condition is 1.5, 22 and the loading diagram is shown in Figure 5(a). Finite element analysis is carried out on the frame, and the analysis results are shown in Figure 5(b).

Full load torsion finite element analysis results: (a) loading diagram and (b) stress contours.
According to the analysis results, the maximum stress is 226.51 MPa, less than the 355 MPa maximum yield limit of frame material. The maximum stress point is at the end of the front section of the frame, and the frame structure meets the safety requirements.
Dynamic analysis
The analysis of the frame’s dynamic characteristics can be used to prevent resonance between the frame and excitation sources, such as the road surface, to improve safety and comfort. In this paper, the frame is subjected to a free mode analysis without any constraints. The first six orders of the non-rigid free mode frequencies and vibration modes are described in Table 4, where it can be seen that the first-order natural frequency of the frame is 5.79 Hz (the mode diagram is shown in Figure 6), which is 1–3 Hz 23 higher than the excitation generated by the road surface, so resonance is avoided.
Description of the first six modal frequencies and shapes.


The first order natural frequency mode diagram.
Kriging approximation model
Selection of design parameters
At the beginning of the unmanned sightseeing vehicle frame design, the rectangular steel wall thickness in the middle section is designed more conservatively, and the weight of a single beam in the middle section of the frame is large to prevent the insufficient bearing capacity of the structure in the middle section. According to the results of static analyses above, the bearing capacity of the middle part of the frame has a relative surplus. The wall thicknesses of the rectangular steel in the middle section are taken as the design variables and numbered X1–X10, as shown in Figure 7, to achieve better weight reduction without increasing the computer calculation requirements.
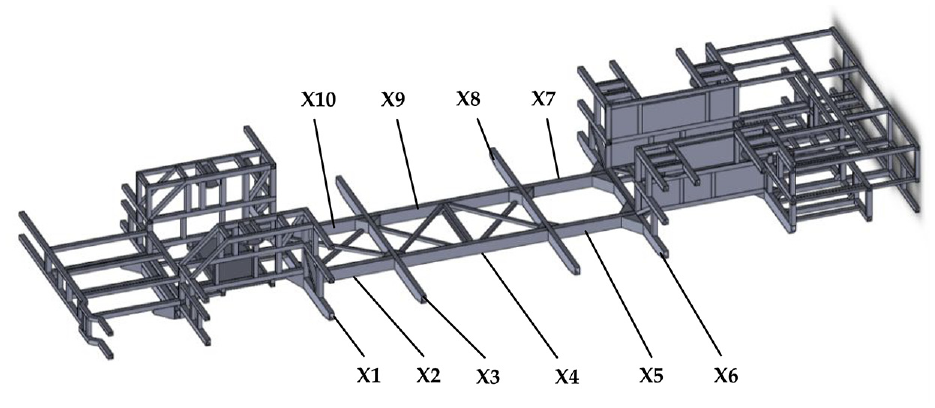
Schematic diagram of design variables.
The number of design variables and computing times are reduced by setting X2 equal to X10, X3 equal to X8, X4 equal to X9, and X5 equal to X7, and the first variable drives the second variable uniformly in the experimental design. To follow the design principle that the wall thickness of each rectangular steel beam is 3–5 mm, the upper limit of each design variable is set to 5 mm. The design range of each parameter is shown in Table 5.
The scopes of the design variables.

The influences of the selected design variables on the frame mass, first-order natural frequency, and stress under full load bending and torsion conditions of the driverless sightseeing vehicle are observed. A sensitivity analysis of the selected design variables is carried out with the Parameter Correlation module in the ANSYS Workbench software. The analysis results are shown in Figure 8.

Relative sensitivities of the design variables.
As seen in Figure 8, design variables X1–X6 are all positively sensitive to mass, and design variable X3 has the most significant impact on mass. Design variable X4 has the greatest influence on the first-order natural frequency. The full load bending and torsion maximum stresses of design variables X1–X6 may be positively or negatively sensitive. For example, design variable X5 is positively sensitive to the full load bending condition but negatively sensitive to the full load torsional stress. Therefore, it is necessary to consider a multi-objective optimization design for various working conditions to comprehensively consider the influence of the design variables on the lightweight frame design.
Experimental design
Experimental design plays an essential role in the implementation of multi-objective optimization. Compared with traditional experiments, a reasonable arrangement of experimental design can result in fewer tests and lower costs to obtain expected results and draw scientific conclusions. 24 Latin hypercube experimental design generates sample points uniformly in the design space and then combines them randomly, achieving better space-filling than traditional experimental design methods. First, 45 sample points are chosen in the design space by the Latin hypercube sampling method. Then, the Design of Experiments module in the ANSYS Workbench software calculates the frame mass M, maximum stress under full load bending P1, maximum stress under full load torsion P2, and first-order natural frequency F for the sample points. Partial calculation results are shown in Table 6.
Selected Latin hypercube sample points and corresponding responses.

Establishing the Kriging approximation model
A Kriging approximation model is characterized by high global fitting accuracy, high efficiency in processing many sample points, and accurate establishment of mathematical relations between sample points and responses. 25 The mathematical expression of the Kriging approximation model is:

where Y(x) is the approximate model to be established, f(x) is a polynomial, and Z(x) is a random function, mainly used to correct the error of the global model.
The expression for f(x) is:

where fT(x) = [f1(x), f2(x), …, fn(x) ]T represent the basis functions of the regression model and β = [β1, β2, …, βn]T are the undetermined basis function parameters.
The covariance matrix formula of Z(x) is:

where R is the correlation matrix and R(xi, xj) is the correlation function between sample points xi and xj.
There may be some errors in the establishment of the approximate model. The determination coefficient R2, relative maximum absolute error (RMAE), and relative average absolute error (RAAE) are introduced to verify the accuracy of the approximate model. The accuracy of the express approximation model is higher when the RMAE and RAAE are closer to zero and the value of R2 is closer to one. The expressions for R2, RMAE, and RAAE are as follows:
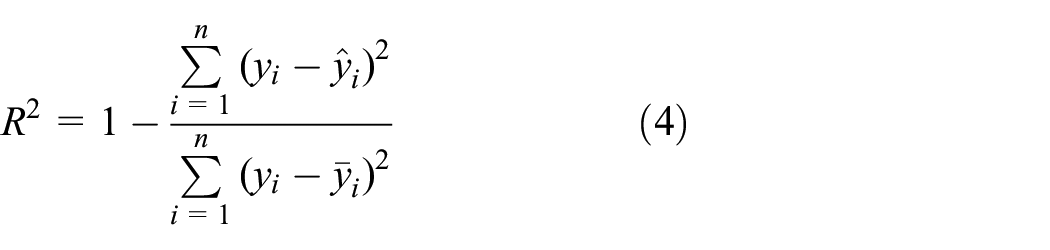


where n is the number of sample points, yi is the actual response value of the approximate model,
The Kriging approximation model and the calculated responses of the unmanned sightseeing vehicle frame are established according to the points sampled by the above-described Latin hypercube method and the three-dimensional response surface of the full load bending maximum stress is shown in Figure 9. The accuracy of the established model is verified by randomly selecting 10 sample points and comparing the approximate model and simulated values for the frame mass, first-order natural frequency, and maximum stresses under full load bending and torsion conditions, as shown in Figure 10. All of the determination coefficients of these four approximate models are 1, and all relative RMAEs and RAAEs are 0, indicating that the established model has high precision and meets the design requirements.

Three-dimensional response surface of maximum stress under full load bending condition.

Validation of approximate model accuracy: (a) the relationship between the predicted and simulated values of frame mass, (b) the relationship between the predicted and simulated values of the frame’s first-order natural frequency, (c) the relationship between the predicted and simulated values of the frame’s maximum stress under the full load bending condition, and (d) the relationship between the predicted and simulated values of the frame’s maximum stress under the full load torsional condition.
Multi-condition and multi-objective optimization
Establishing the mathematical model
The maximum first-order natural frequency, the minimum mass, and the minimum stresses for full load bending and torsion of the frame were defined to design a lighter frame. The multi-condition and multi-objective optimization mathematical model of the frame is established as follows:

where x is the set of design variables, F(x) is the first-order natural frequency of the frame, P1(x) is the frame’s maximum stress under the full load bending condition, P2(x) is the frame’s maximum stress under the full load torsion condition, M(x) is the frame mass, and ximax and ximin are the upper and lower limits of each design variable.
Multi-objective genetic algorithm optimization
A multi-objective genetic algorithm is used to optimize the frame according to the established Kriging approximation model under multiple operating conditions and objectives using the Response Surface Optimization module of the ANSYS Workbench software. Setting the initial number of samples to 6000 and the maximum number of iterations to 20, convergence is achieved after 7153 evaluations, and the resulting Pareto solution set is shown in Figure 11 (note that 300 of the sample points are shown in the figure). Four groups of candidate points are selected from the Pareto solution set, as shown in Table 7.

The Pareto solution set of the frame optimization scheme.
Four groups of candidate points after optimization.

Figure 12 shows the Pareto front of the frame mass and first-order natural frequency to clearly express their changing relationship and demonstrate a contradiction between them. If the mass decreases, the first-order natural frequency also decreases. Therefore, the optimal Pareto solution set should be found using a genetic algorithm, and the optimal solution should be selected from the four groups of candidate points using a fuzzy matter element method.

The Pareto front of the mass and first-order natural frequency.
Optimization scheme selection
The fuzzy matter element method is used to optimally rank the four candidates to avoid interference by human subjective factors in the final selection scheme. In addition, we use the analytic hierarchy process (AHP) for comparison to determine the weight selection accuracy of the fuzzy matter element method, thereby verifying its accuracy and obtaining an optimal design.
Fuzzy matter element method theory
The steps of the fuzzy matter element method are summarized as follows:
1. Establish the fuzzy matter element. If there are m pre-selected schemes for object M, each pre-selected scheme should have n evaluation indicators, and the corresponding fuzzy value of each evaluation indicator can be expressed by x, constituting a matter element as follows:

where Rmn is a fuzzy matter element that describes m pre-selected schemes and n evaluation indicators, Mj is the jth pre-selected scheme, (j = 1, 2, …, m), Ci is the ith evaluation index (i = 1, 2, …, n), and xji is the fuzzy value corresponding to the ith evaluation index of the jth pre-selected scheme.
2. Determine the membership degree. Each evaluation index has different dimensions. The membership degree is usually used as the measurement standard of each evaluation index to make each comparable. The determination method of membership degree is as follows:
a. The bigger, the better index:

b. The smaller, the better index:

where “max xji” and “min xji” represent the maximum and minimum values of fuzzy quantity xji corresponding to each evaluation index in the pre-selected scheme.
3. Calculate the correlation coefficient of the compound fuzzy matter element. The correlation coefficient is an algebraic representation of the value of the extended set, expressed as ξji. Because the correlation coefficient is equivalent to the membership coefficient, the correlation coefficient ξji is determined by the membership coefficient Uji:

where j = 1, 2, …, m and i = 1, 2, …, n.
The ξji value of the correlation coefficient is used to establish the complex fuzzy matter element of the correlation coefficient:

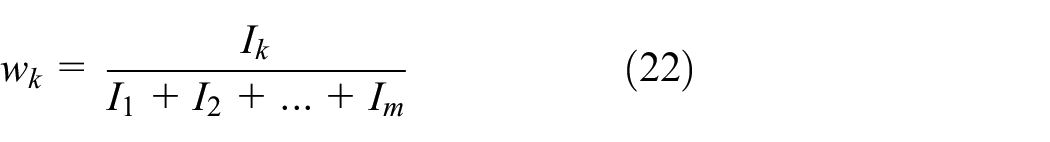
4. Calculate the weights of the compound fuzzy matter element. The summation and normalization method is adopted to calculate the weighted compound fuzzy matter element:

where Wi is the weight of the item i evaluation index of each pre-selected scheme.
5. Calculate the correlation compound fuzzy matter element. The correlation degree represents the degree of correlation between each pre-selected scheme and is expressed as Kj. All relational degrees are constructed into a relational degree compound fuzzy matter element, denoted as Rk:

The compound fuzzy matter-element Rk of the correlation degree can be calculated from

where Rk is the compound fuzzy matter element of the correlation degree, Rw is the weighted compound fuzzy matter element, and Rξ is the correlation coefficient compound fuzzy matter element.
Finally, each pre-selected scheme is sorted according to Kj value to determine the optimal scheme.
Fuzzy matter element method to determine the weight
The four candidate points selected above were represented by M1, M2, M3, and M4, and the frame mass, first-order natural frequency, and maximum stress for the two working conditions were taken as evaluation indexes, represented by C1, C2, C3, and C4, respectively. The synthetic evaluation fuzzy matter element is constructed as follows:
Among the four evaluation indicators, C1, C3, and C4 are the minimum values found in the optimization objective, which belong to the smaller, the better type. C2 is the maximum value sought in the optimization objective, belonging to the larger, the better type. By calculating the correlation coefficient using equations (9), (10), and (11), the complex fuzzy matter element of the correlation coefficient is established as follows:

The weighted compound fuzzy matter element is obtained as follows using equation (13) to calculate the weight coefficient of each evaluation index:

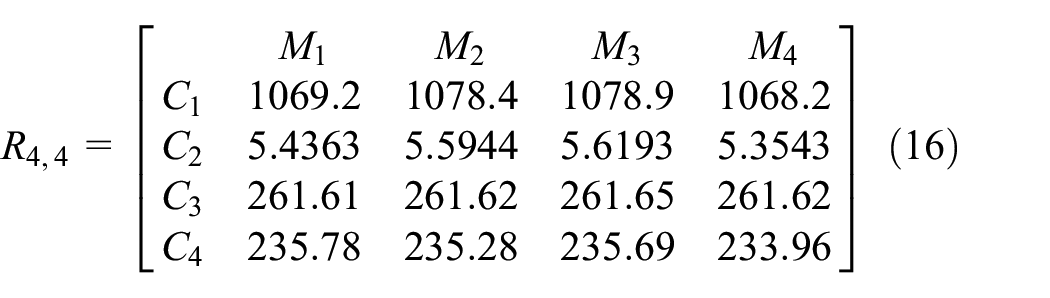
The values of the weighted composite fuzzy matter elements and the correlation coefficient composite fuzzy matter elements above are substituted into equation (15) to obtain the composite fuzzy matter elements with the correlation degree of the four schemes, as shown below:
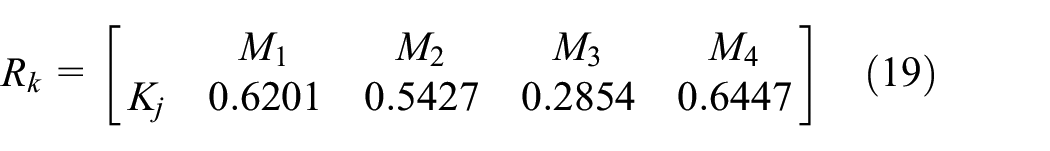
The Kj values in equation (19) show that K3 < K2 < K1 < K4, meaning that M3 < M2 < M1 < M4. Therefore, candidate 4 is the optimal design scheme.
Analytic hierarchy process (AHP) to determine the weights
The steps of the AHP used to determine the weights are as follows:
1. Establish the judgment matrix. The frame mass is a little more important than the first-order natural frequency based on researchers’ judgment of the four evaluation indexes (frame mass, first-order natural frequency, and maximum stresses for two working conditions). The frame mass is more important than the maximum stresses under full load bending and torsion conditions, but the maximum stresses under full load bending and torsion conditions have equal importance. After pairwise comparison of the importance of the four evaluation indicators, the judgment matrix A = (Aij)m×m is established, where Aij is the importance of evaluation index i relative to evaluation index j, and its value is allocated according to Table 8. The established judgment matrix is as follows:

2. Calculate the consistency ratio. The consistency ratio (CR) is used to determine whether the decision matrix meets the consistency principle 5 to ensure the consistency of the established decision matrix. If the decision matrix is inconsistent, it must be re-established. When the consistency ratio of equation (20) meets the criterion below, it indicates that the judgment matrix is reasonable:

where CI is the consistency index, m is the number of evaluation indexes, λmax is the maximum eigenvalue of judgment matrix A, and RI is the average value of the random consistency index, whose values are given in Table 9.
Definition of importance scale of judgment matrix A.

Average random consistency index.

In this study, the maximum eigenvalue λmax of the established judgment matrix is 4.0435, the number of evaluation indexes m is 4, and the calculated consistency index CI is 0.0145. The above values are substituted into equation (21) to calculate: CR = 0.0145/0.9 = 0.0161 < 0.1, and the consistency of the matrix is judged to be acceptable.
3. Calculate the weight of each evaluation index. Assuming that the vector I = (I1, I2, …, Im)T is the eigenvector corresponding to the maximum eigenvalue λmax of judgment matrix A, then the weight of the kth evaluation index is:
where Ik is the kth value of the feature vector I.
In this study, the eigenvector corresponding to the maximum eigenvalue λmax of the judgment matrix is I = (0.8919, 0.3977, 0.1522, 0.1522)T, and the weights of the four evaluation indexes, w1 = 0.5595, w2 = 0.2495, w3 = 0.0955, and w4 = 0.0955, are obtained by substituting them into equation (22).
The weights of these four evaluation indicators form the matrix

Substituting RwAHP into equation (15), the correlation degree matrix of the four candidate design points can be obtained, namely:

From the values of kj, it can be seen that k3 < k2 < k1 < k4, meaning that M3 < M2 < M1 < M4. The result calculated by the AHP is the same as that calculated by the fuzzy matter element method. Therefore, candidate point 4 is the optimal design scheme.
Comparison of results
The calculation results of the AHP and fuzzy matter element method show that candidate point 4 is the optimal design scheme, demonstrating the rationality and correctness of the fuzzy matter element method. Compared with the AHP, the fuzzy matter element method avoids the interference of human factors. Candidate point 4 was therefore selected as the final optimized design, and the value of each optimization variable was rounded. The results comparing the beam wall thickness in the middle section before and after optimization are shown in Table 10.
Comparison of design variable values before and after optimization.

Verification of optimization results
The frame finite element model was re-established according to the rounded frame wall thickness values, and its modal and static strengths were verified under the full load bending and torsion conditions. The stress contours of the optimized frame are shown in Figure 13.
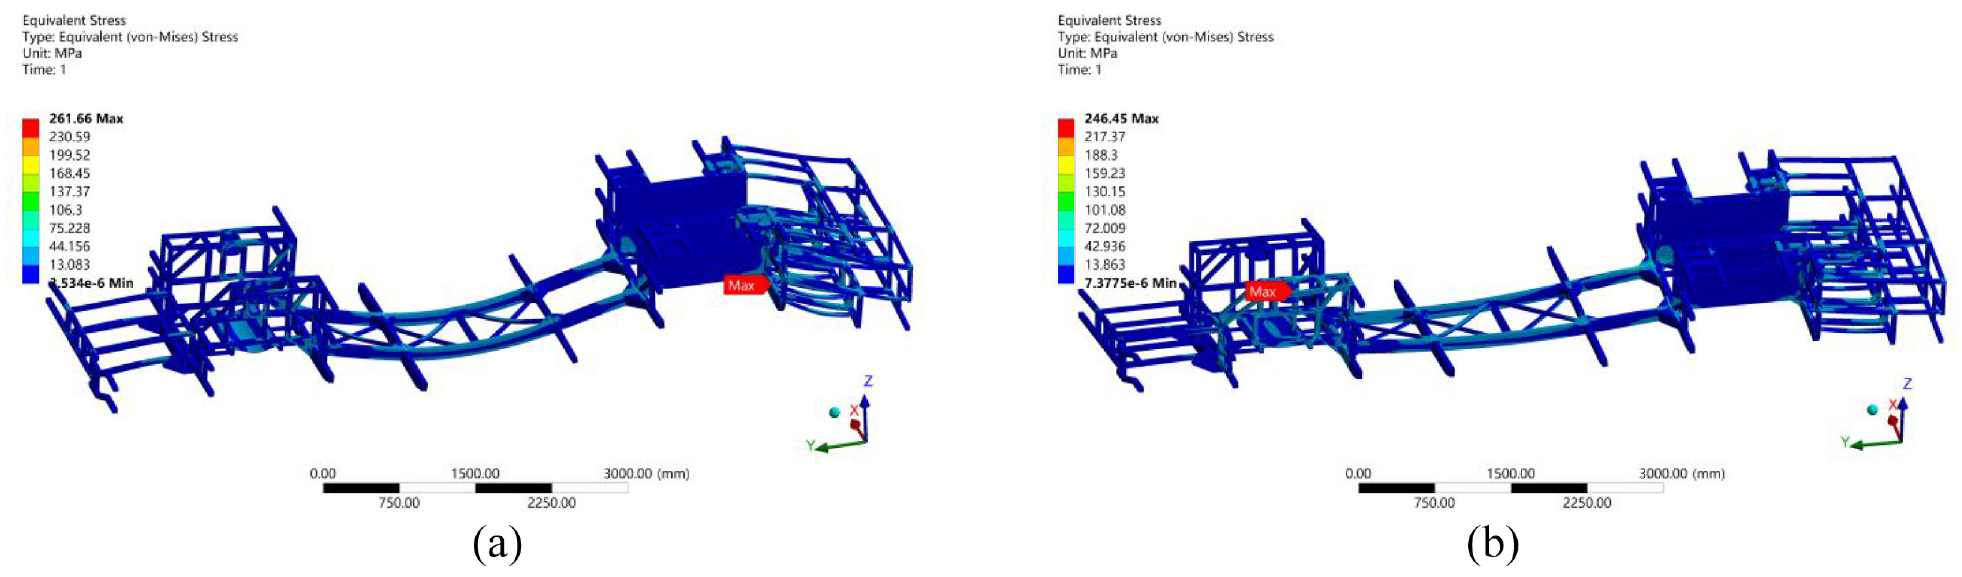
Finite element analysis results of the optimized frame: (a) stress contours under full load bending condition and (b) stress contours under full load torsion condition.
The optimized frame stress contours show that under the full load bending condition, the maximum stress of the frame is 261.66 MPa, 0.07 MPa higher than before optimization. The maximum stress point still occurs at the battery bracket installation location in the rear section of the frame. The maximum stress of the frame is 246.45 MPa under the full load torsion condition, which is 19.94 MPa higher than before optimization but still less than the yield limit of the frame material. The maximum stress point is found at the installation of the airbag bracket.
The overall performance of the frame before and after optimization is shown in Table 11. These results show that the natural frequency of the frame is not much different from that of the original frame and still meets the safety requirements. The first-order natural frequency pattern is shown in Figure 14. The frame’s weight is reduced by 60.9 kg, achieving the requirements with a more lightweight design.
Overall performance comparison of the frame before and after optimization.

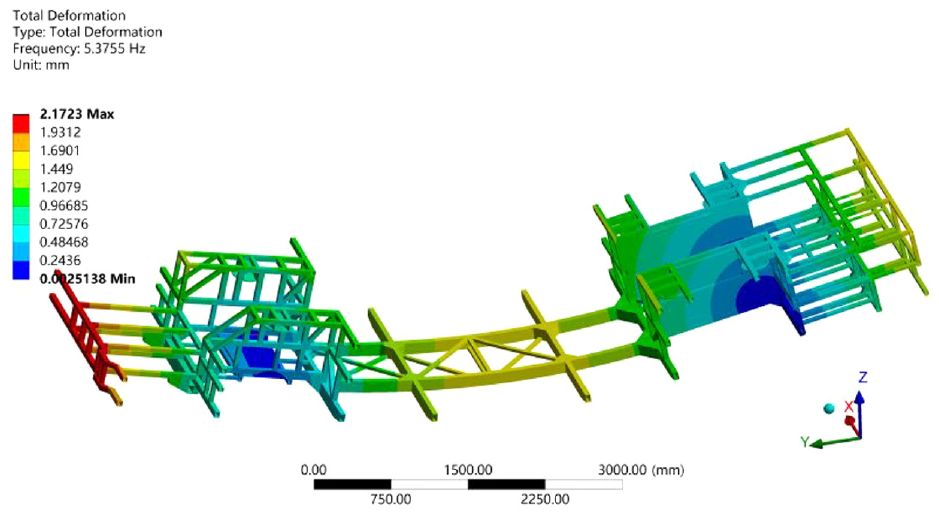
The first-order natural frequency pattern of the optimized frame.
Conclusions
This paper proposes a multi-condition and multi-objective optimization design flow, which provides a theoretical basis for the lightweight design of a vehicle frame under complex conditions. The specific conclusions are as follows:
Static and modal analyses of the frame show that the maximum stress of the frame is below the yield limit of the frame material for the two working conditions, and the frame has room to accommodate a lightweight design. The natural frequency does not equal the road excitation value, avoiding resonance. Local sensitivity analysis was carried out on the selected design variables, and it was found that the same design variable could have opposite sensitivities under different working conditions. Therefore, the influence of multiple working conditions was considered in the lightweight design, and the multi-objective optimal solution of the frame under the constraints of multiple working conditions was obtained.
Taking the minimum mass, the maximum first-order natural frequency, and the minimum stresses under full load bending and torsion conditions as objectives and the corresponding boundary conditions as constraints, a multi-condition and multi-objective optimization mathematical model of the frame was established.
Fuzzy matter element analysis and AHP are used to rank the multi-objective optimization results. The ranking results of both methods are candidate 3 < candidate 2 < candidate 1 < candidate 4. Therefore, candidate 4 is selected as the final optimized design, and a verification simulation is conducted. The results show that the fuzzy matter element method is reasonable, avoiding the influence of artificial factors on the selection scheme.
Latin hypercube experimental design and Kriging approximate model technology are used to establish an approximate model of the frame. A multi-objective genetic algorithm is used to optimize the multi-objective frame design. The frame’s weight is reduced by 69.9 kg (5.4%) while meeting the static strength requirements, realizing a lightweight design of the unmanned sightseeing vehicle frame.
It is noted that this study still has some limitations. This paper demonstrates the method’s effectiveness only by comparing the optimized and initial designs. Although this optimization method can provide a technical reference for developing and designing an unmanned sightseeing vehicle frame, its optimization potential still needs to be explored. Thus, future research can apply the proposed method to actual vehicle production to prove the method’s superiority.
Footnotes
Handling Editor: Chenhui Liang
Declaration of conflicting interests
The author(s) declared no potential conflicts of interest with respect to the research, authorship, and/or publication of this article.
Funding
The author(s) disclosed receipt of the following financial support for the research, authorship, and/or publication of this article: This research was supported by the National Natural Science Foundation of China (Grant No. 52102443).