
Abstract
The difficulty in understanding the flow characteristics of water jets impacting on solid surfaces made the water jet technology requiring further investigations. The Arbitrary Lagrange-Euler (ALE) method is used to develop a numerical model of the water jet impacting on a solid surface. It is also utilized in describing the flow characteristics of water and the pressure evolution in water during the impact process, understanding the formation mechanism of the pressure zone, and clarifying the influence factors of the stagnation pressure zone. The results showed that the pressure zone was characterized by the shock wave produced by the water jet impacting the solid surface. When the shock wave was contained in the water, it was the water hammer pressure stage. However, when the shock wave in water was disappeared, the stage was identified as the stagnation pressure. Besides, the water hammer pressure caused a high speed radial jet, and the stagnation pressure resulted in a low speed and stable radial jet. The stagnation pressure zone was the self-buffer zone of the water jet impacting the object, and the geometric characteristics of this zone were affected by the water jet diameter and the impact angle.
Introduction
Water jet technology was applied and utilized in the mining sector during the early 19th century. After approximately 200 years of improvement, water jet technology is successfully and widely used in crushing rocks, mechanical processing, surface cleaning, and many other fields. Moreover, the theoretical research of water jet technology is still beyond its practical engineering applications that makes it challenging for the existing theories to effectively guide the application of this technology in the field. The first reason behind this challenge might be the complication of the loading method for the water jet on the object including the dynamic load of the stress wave and the static load of the pressure. The load in the impact process is difficult to be described quantitatively. The second reason might be due to the short duration at which the process of water jet is impacting and destroying an object. This will generally take about milliseconds or microseconds, and it is complicated to directly realize the destruction process of the object. Moreover, the third reason is the complexity of the physical and mechanical properties of the object itself that is being subjected to the water jet process. In particular, the constitutive model of the material during failure that is still immature. Finally, the fourth reason is due to the interaction between the water jet and the object during the impacting process of the water jet. The flow of water jet and the stress and strain of the subjected objects are coupled with each other. Thus, it is hard to obtain an analytical solution using a theoretical model.
Many scholars conducted several research studies for investigating and understanding the water jet technology over the past 200 years. In 1915, Cook 1 examined the phenomenon of droplets eroding metal and recognized the water hammer effect in the process of droplets impacting objects that established the foundation for the water jet technology. Besides, scholars were able to successively develop the water jet technology to impact solids resulting in producing and perfecting a theoretical model of water hammer pressure.2,3 However, the water hammer pressure produced by the water jet impacting the object did not continue.4,5 The stable stagnation pressure after the disappearance of the water hammer pressure was not proposed and recognized by scholars until 1999. 6 Up to date, in addition to the calculation model of water hammer and stagnation pressures that are widely accepted by scholars, the theoretical model of the impact of water jet on an object has not yet formed a unified mathematical description.
The theories explaining the impact of water jet on objects mainly included shock wave breaking, 7 quasi-static fracturing, 8 and crack-growth theories. 9 These theories are lacking quantitative mathematical expressions and are still at the stage of hypothesis. Moreover, it is necessary to know the load application method to derive a quantitative and reasonable theoretical model for any kind of theory. The loading method of the water jet is still not clearly understood due to the difficulty of the impact process of the water jet. Therefore, this study attempts to start with examining the process of water jet impacting on solid surface and investigate its fluid characteristics.
Currently, high speed cameras are used to capture the impact of water jets on objects. If only high speed cameras are relied on for this, the flow characteristics of water can only be captured while the physical quantities such as the velocity, pressure, and vorticity of the flow field won’t be directly extracted. In order to solve this problem, particle image velocimetry (PIV) technology and equipment based on high speed cameras were developed and had successfully been applied in fluid flow. 10 This system only had one more function than the high speed cameras. It could directly extract the velocity of the flow field at any point but it could not extract the pressure. The development in calculations had solved this issue; the speed of solving differential equations was greatly improved. Numerical simulation was effectively applied to describe the impact of water jets on objects.11,12 Among a series of numerical simulation methods, ALE method had attracted researchers working in this area of research. The ALE method is an organic combination of the Lagrangian and the Euler methods. It has the advantage of the Lagrangian method in tracking particles and the advantage of Euler method in avoiding the large deformation of the grid. 13 Thus, the ALE method has good adaptability to the water jet impacting on solid surfaces.
In summary, the current study uses the ALE method to simulate the process of water jet impacting on solid surfaces. It also investigates the characteristics of water flow, the law of pressure changes and the factors affecting the pressure change during this process. In addition, Section “Study approach” of this study will describe the process of developing the model while Section “Results and discussion” will show the results of the fluid flow and pressure zone evolution of the water jet impacting on solid surfaces. Moreover, Section “Results and discussion” will also examine the formation mechanism of the pressure zone and its influencing factors. The outcome of this paper will provide an in-depth understanding of the process of water jet impacting objects and will form the foundation for the theoretical analysis of water jet breaking objects.
Study approach
ALE algorithm method
The ALE algorithm consist of three controlling equations as detailed below:
(1) Mass conservation equation

(2) Momentum conservation equation

(3) Energy conservation equation
Where

In which p represents the pressure of the substance,
Model setup
LSDYNA is used to calculate the impact of the water jet on solid surfaces in this simulation due to its high calculation accuracy in non-linear fields that includes liquid-solid impact, 11 solid-solid impact, 14 explosion, 15 etc.
It is necessary to establish a grid in the calculation area before the calculation. Three materials were included in the simulation of this study, namely water, solid surface, and air. The water and air used solid elements, and the solid surface used shell elements. It was assumed that the water flowing out of the nozzle was cylindrical and the interaction between water and air was spatially symmetrical. Theoretically, the flow of water after the cylindrical water jet impacts on a solid surface is rotationally symmetrical about the central axis of the water jet. This means that the physical quantities such as velocity, pressure, and acceleration of fluid in the central axis section are symmetrical about the central axis. Thus, to save computer resources and for improving the efficiency of calculation, this study established a quasi-two-dimensional grid shown in Figure 1. The figure revealed that the grid size of water and air was much smaller than the characteristic length diameter of the water jet. The water jet diameter was 1 mm and the hexahedron diameter of the unit was 0.0625 mm. Next, the water, air, and solid surface material were given parameters, respectively. Both water and air implemented a null constitutive model and were equipped with an equation of state while the solid surface implemented an elastic constitutive model. The parameters of each material are presented in Table 1. Finally, the initial velocity of water jet was set to 200 m/s, the translational and rotational degrees of freedom of the solid surface were constrained and the time for calculation was also set.

Geometrical model of water jet impacting on solid surface.
The parameters of water, air, and solid surface.

Results and discussion
Verification of simulation
Figure 2 shows the flow process of a water jet impacting a solid surface. A target distance was set between the water jet and the solid surface to simulate the situation of water jet in real application. This results in the water jet taking time before touching the solid surface. The starting point of time was taken at the moment when the jet initially contacted the solid surface when t = 0 μs. The following moment could be obtained by the addition of the time increment. Moreover, Figure 2(a) shows that the front profile of water jet was smooth and slightly curved because the head of the water jet interacted with the air when the water jet hit the solid surface. This result is mainly reliable and agreeable with the experimental results obtained by Fieldet al. 16 Meanwhile, the water jet continued to move downward under the action of the dynamic pressure. Figure 2(b) reveals that the head of the water jet completely contacted the solid surface, and a radial jet trend was generated at t = 0.5 μs. The flow direction of the water jet was changed from the vertical to the horizontal direction due to the solid surface preventing the water jet from flowing in the vertical direction. This caused a radial jet from the impact point along the solid surface as shown in Figure 2(c) and (d). The flow characteristics of the water jet after hitting the solid surface were in agreement with the available results in the literature (Figure 3).17,18 It can be concluded that comparing the jet morphology of the water jet impacting on solid surface qualitatively verified the simulation results.
The flow characteristics of a water jet hitting a solid surface.

Circular water jet impacting a plate. 17
The action process of water jet on objects can be divided into the water hammer pressure action stage and the stagnation pressure action stage. The water hammer pressure produces initial damage while the stagnation pressure generates continuous damage to the object. Thus, the important indicators that are used to measure the impact capability of water jets include water hammer and stagnation pressures and their theoretical calculations adopted equations (5) 1 and (6), respectively. Next, the verification of the numerical simulation results will be quantified by comparing them with the theoretical results of the two pressures.

Where Ph denotes the water hammer pressure, ρ is the water density, c represents the shock wave velocity, and v is the water jet velocity.
In which Ps denotes the stagnation pressure.
The available literature shows that the water hammer pressure is slightly decreased with the increased jet radius. 11 It is necessary to exhibit the maximum value of the water hammer pressure for highlighting the impact ability of the water jet. Hence, element 191139 at the center of the jet was selected to examine its water hammer and stagnation pressures as shown in Figure 4. The Figure also reveals that the relative error between the simulation and theoretical results of the water hammer pressure was 18.1%. This was due to the slight deformation of the solid surface in the numerical calculation, and the deformation of the target body was completely ignored in the theoretical calculation of equation (5). This resulted in the theoretical results to be higher than the simulation results. On the other hand, the relative error between the simulation and the theoretical results of the stagnation pressure was only 2%. The reason behind this could be that the stagnation pressure was not affected by deformation of the solid surface, but the interaction of water and air slightly reduced the speed of water. This resulted in the theoretical results to be slightly higher than the simulation ones.
Relative errors of simulation and theory results.
It can be concluded that the simulation results were verified by qualitatively comparing the flow pattern of the water jet impacting on the solid surface with the existing experimental results. In addition, a quantitative comparison between the simulation and the theoretical results was performed between the water hammer and stagnation pressures generated during the impact. This will ensure that the results obtained from this simulation are considered reliable.
Pressure characteristics of water jets hitting a solid surface vertically
The water jet just touched the solid surface when t = 0 μs as shown in Figure 5(a). The fluid velocity at the front end of the jet was suddenly decreased to approximately zero. The subsequent fluid continued to move vertically under the action of inertia compressing the fluid at the front end of the jet. Thus, the fluid at the front end of the jet presented a high pressure state forming high pressure zone that is also shown in Figure 5(a). This high pressure zone was considered as a strong disturbance generated by the impact of water jets that is called a shock wave in shock wave theory. Due to the flatness of the front end of the jet in this simulation, the front end of the jet was in contact with the solid surface at the same time. Besides, the wave front of the shock wave was initially flat. After the shock wave was generated, it propagated and spread in the medium, and the pressure in the place where the shock wave swept was increased. Therefore, from t = 0.2–0.7 μs, the high pressure zone in the jet gradually evolved in the vertical upward direction as revealed in Figure 5(b) to (d). This indicated that the shock wave was generated by the impact of the water jet that was propagated along the vertical upward direction. Since water is viscous in this simulation, the energy carried during the propagation of the shock wave was dissipated in the form of frictional heat. This resulted in the gradual disappearance of the high pressure zone along the vertical evolution process as shown in Figure 5(e). In the horizontal direction, the formation of radial jets provided a medium for the propagation of shock waves. When the shock wave was formed in the radial jet, the fluid particles on the non-central wave front were vibrating in the vertical and horizontal directions. This shows that the energy carried by the shock wave had directivity. This led to a decrease in the amplitude of the fluid particle in the vertical direction and the wave front was no longer flat, but appeared in the shape of an arc. In this simulation, the velocity of the jet was in the order of 102 m/s while the propagation velocity of the shock wave in water was in the order of 103 m/s. This causes the shock wave to certainly catch up with the boundary between the radial jet and the air in the propagation process. When the shock wave propagated to the boundary, reflection occurred. The shock waves reflected on the boundaries moved toward the center of the jet forming the high pressure zone as revealed in Figure 5(f) and (g). After that, the two shock waves met at the center to produce a superimposed enhanced effect creating a high pressure zone in the center of the jet as shown in Figure 5(h). After t = 3.4 μs, the shock waves after meeting at the center of the jet continued to propagate to the left and right repeating the above process of being reflected at the boundary and interacting at the center of the jet. This resulted in a change in the shape of the pressure zone as shown in Figure 5(i) to (k). The shock wave disappeared when all the energy of the shock wave was converted to frictional heat energy. Besides, the pressure zone in the jet was stable and the shape did not change anymore as demonstrated in Figure 5(l).

Pressure characteristics of the water jet impacting vertically on solid surface.
Mechanism of pressure zone formation
The water jet hit the solid surface forming a radial jet. The flow velocity of the radial jet was not found stable when the velocity of node 186697 was recorded in the radial jet path. Figure 6 shows that it suddenly rose up and then dropped sharply to be finally stabilized. The crucial reason behind this phenomenon could be the flow of fluid produced by the pressure differences. When the water jet initially touched the solid surface, the water at the front of the jet had high pressure because it was compressed. According to the minimum energy dissipation theorem of fluid flow for this part of high pressurized water, it must have a radial flow trend and that is the reason for formation of high speed radial jet at the initial stage. However, since the water hammer pressure did not exist, the velocity of the radial jet was gradually decreased when the water hammer pressure gradually disappeared due to the shock wave dissipation. The water hammer pressure completely disappeared after the complete disappearance of the shock wave. At this time, the flow of the radial jet was provided by the stagnation pressure. It is worth noting that the stabilized radial jet velocity was slightly smaller than the initial jet velocity. This phenomenon happened due to the viscosity of water as there was internal friction in the flow of the radial jet, and part of the kinetic energy of the initial jet was consumed during the flow. Besides, the water jet hit the solid surface so that the solid surface has elastic energy. To conclude, when there is a shock wave in water, it is the stage of action for water hammer pressure and after the shock wave is disappeared, it is the stage of action for stagnation pressure on the object. In addition, it was found that the decaying path of the water hammer pressure to stagnation pressure was not smooth but appeared as a decay of the periodic fluctuations. This was due to the damping effect of viscosity of the fluid on the propagation of the shock wave. This caused the energy of the shock wave to be continuously dissipating. Therefore, the extreme value of difference for the pressure fluctuation was decreased with the increased time as shown in Figure 7.
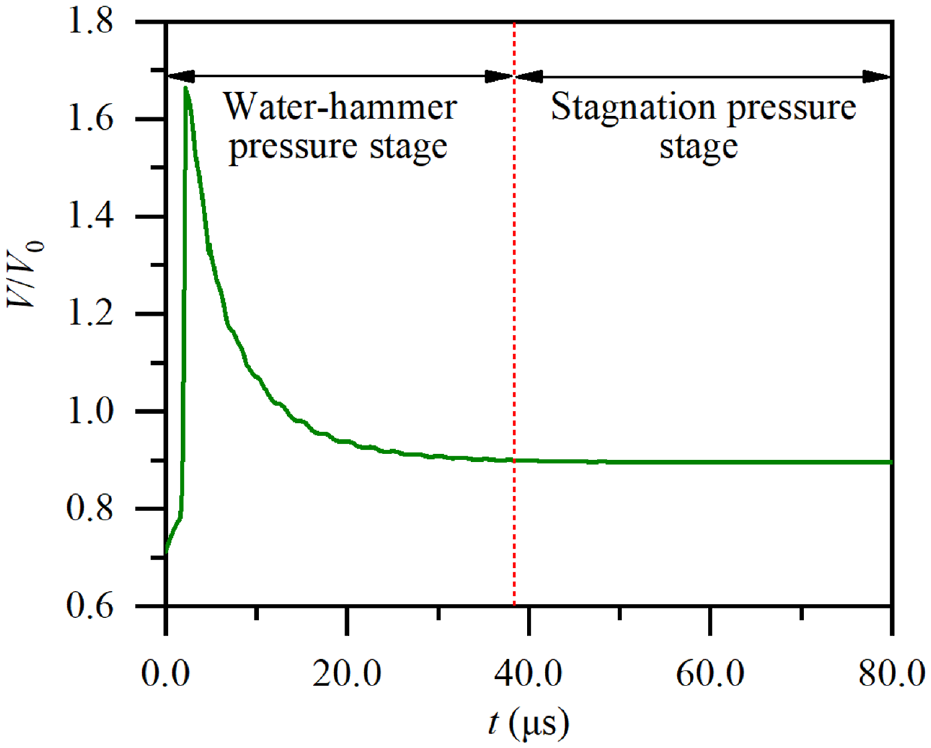
The ratio of the velocity of the node 186697 to the initial velocity of the water jet.

Pressure of element 1191139.
Referring to equation (6), the stagnation pressure is related to the density and speed of water. Meanwhile, this study assumed that water is an incompressible fluid, and the stagnation pressure is only related to the speed of water. Hence, the equivalent distribution of the pressure zone can represent the equivalent distribution of speed. The shape of the stabilized pressure zone revealed in Figure 5 changed gradually from a semicircle to a flying saucer shape. This process corresponded to the pressure attenuation from high to low pressure. It also corresponded to the attenuation of water velocity from high to low speed. It is important noting that the type of pressure in Figure 5 was static. According to the law of conservation of energy, static and dynamic pressures could be transformed into each other. Figure 5 shows that the static pressure was transformed from a dynamic pressure. Thus, it was assumed that the fluid particles of the initial jet could no longer directly contact the solid surface at the initial velocity after the disappearance of the shock wave. The velocity for most of the fluid particles was gradually decreasing when they first entered the pressure zone. The velocity of the particles was very small and could not produce an effective impact on the solid surface when they finally passed through the pressure zone and touched the solid surface. From this perspective, it is believed that the pressure zone reduced the impact capacity of the water jet and this pressure zone was defined in this study as a self-buffer. It can be concluded that there was a self-buffering effect when the continuous water jet impacted on the solid surface.
The effect of initial jet velocity and diameter on the pressure zone
The speed and diameter of the water jet are important parameters exhibiting the properties of the water jet. This section will analyze the influence of these two parameters on the pressure zone. Figure 8 reveals that the speed of the water jet had no effect on the shape and structure of the pressure zone. This is due to the speed of the water jet that only changed the contact time between the fluid particles and the solid surface. The contact time between the high speed jet and the solid surface was earlier than that of the low speed jet. The water flow was steadily driven by the stagnation pressure when the shock wave in the water was disappeared. Meanwhile, different water jet velocities are just the initial phases for different cycles and the evolution characteristics of the cycles won’t be changed when the entire impact cycle is concerned. Although the shape and structure of the pressure zone that was generated by the impact of different velocities of water jets on the solid surface were the same, the generated water hammer and stagnation pressures were different. The water hammer and stagnation pressures were generated by the high speed water jet impacting on the solid surface. They are both greater than that of the low speed water jet. This can be calculated based on equations (5) and (6).

Pressure zone under different jet velocities and diameters: (a) 0.5 mm of jet diameter and 200 m/s of jet velocity, (b) 1 mm of jet diameter and 100 m/s of jet velocity, (c) 1 mm of jet diameter and 200 m/s of jet velocity, (d) 1 mm of jet diameter and 300 m/s of jet velocity, and (e) 2 mm of jet diameter and 200 m/s of jet velocity.
The influence of the diameter on the pressure zone is not the same as the velocity of the water jet. Figure 8 shows that as the diameter of the water jet was increased, the shape and structure of the pressure zone remained unchanged but the size of zone was increased. Figure 9 reveals statistics of the relationship between the geometric characteristics of the pressure zone (height H and diameter D) and the jet diameter. The Figure shows that as the jet diameter was increased, the dimensions of the geometric characteristic of the pressure zone were increased accordingly and the ratio between them fluctuated within a very small error range (the maximum relative error is only 6%). This kind of error is caused by man-made measurement. These ratios were a constant. This shows that the change in diameter of the water jet won’t change the flow characteristics of the water jet after it hits the solid surface. Moreover, the increase in the diameter of the water jet caused an increase in space water that led to an increase in the geometric size of the pressure zone. Meanwhile, it can be concluded that there was a quantitative relationship between the geometric characteristics of the stagnation pressure zone generated by the water jet perpendicularly impacting the solid surface and the diameter of the water jet.

The relationship between the geometric characteristics of the pressure zone and the jet diameter.
Effect of impact angle on the pressure zone
Figure 10 shows the changes of the geometric characteristics of the pressure zone with the impact angle. As the impact angle was increased, the shape of the high pressure zone was gradually changed from a semi-circle to a semi-ellipse. On the other hand, the shape of the low pressure zone changed gradually from a flying saucer shape to like an ear. Besides, as the impact angle was increased, the symmetry of the pressure zone disappeared. Because after the impact angle was changed, the mass distribution of the fluid flowing in the direction of the solid surface was uneven. When the impact angle was further increased, this uneven distribution was more biased toward the direction of smaller momentum change that can be shown in the lower left side in Figure 10. It was found that whether it was a high or a low pressure area, the area was decreased as the impact angle was increased. The momentum theorem could explain the reason; the increase of the impact angle reduced the momentum change of the initial jet. This resulted in decreasing the dynamic pressure changes of the initial jet and the conversion from dynamic to static pressure was small. Hence, the area of the pressure zone in Figure 10 decreased gradually. In addition, as the impact angle was increased, the high pressure zone was farther away from the center and closer to the edge of the initial jet. This happened due to the momentum of the water jet that first contacted the solid surface changes and this dramatic momentum change caused the high pressure area shown in the figure. For the subsequent water flow, the momentum change was small and it was difficult to generate a higher pressure because of the impact of the initial jet flow after it hit the solid surface.

Pressure zone under different impact angles: (a) 0° of impact angle, (b) 30° of impact angle, and (c) 60° of impact angle.
The peak and steady pressures generated by the water jet impacting on the solid surface at different impact angles were counted. It was found that with the increased impact angle, the peak pressure was decreased sharply as revealed in Figure 11. When the value of the impact angle was 30°, the peak pressure was only 30.2 MPa that is 87.3% lower than the peak pressure generated at 0°. However, the pressure after the water jet hit the solid surface was unchanged. When the impact angle was increased to 60°, the peak pressure generated by the water jet impact was only 2.1 MPa higher than the stable pressure. This is an inexplicable phenomenon. The reason for this phenomenon was the determination of the magnitude of peak pressure using the rate of change for the water jet flow. The increase in the angle of attack led to a decrease in the absolute change after the water jet hit the solid surface that eventually reduced it.

Peak and steady pressures using different impact angles.
Conclusions
This paper used the ALE method to simulate a water jet impacting on a solid surface. The flow characteristics of the water jet impacting on a solid surface were studied and the formation mechanism of water hammer and stagnation pressures was investigated. Besides, the influencing factors of stagnation pressure zone were clarified. From the results and the analysis of the performed study, the following conclusions can be drawn:
The force generated by the water jet impacting the targeted solid surface could be divided into water hammer and stagnation pressures. Water hammer pressure was caused by the stress waves while stagnation pressure was a transformation from the dynamic pressure.
The radial jet velocity produced by the water jet impacting the targeted solid surface was first increased and then decreased to be finally stabilized. The high speed radial jet was triggered by the water hammer pressure and the final stabilized radial jet was triggered by the stagnation pressure.
The stagnation pressure zone was generated by the water jet impacting on the solid surface. It was also called as the self-buffer zone of the water jet and the continuous water jet impacting the object could not continuously generate water hammer pressure.
The velocity of the water jet did not change the size and shape of the stagnation pressure zone. The diameter of the water jet only changed the size of the stagnation pressure zone in proportions. The shape of the stagnation pressure zone was not affected by the changes in diameter. The angle at which the water jet impacted the solid surface changed both the size and shape of the stagnation pressure zone.
Footnotes
Acknowledgements
Handling Editor: Chenhui Liang
Declaration of conflicting interests
The author(s) declared no potential conflicts of interest with respect to the research, authorship, and/or publication of this article.
Funding
The author(s) disclosed receipt of the following financial support for the research, authorship, and/or publication of this article: Project supported by Graduate Research and Innovation Foundation of Chongqing, China (No. CYB21024), and the National Science and Technology Major Projects of China (No. 2016ZX05045).