
Abstract
In the milling process, under the high-efficiency and intermittent cutting loads, the instantaneous posture of the milling cutter and the instantaneous cutter-workpiece engagement are in an unstable state. It is difficult to accurately identify the friction and wear boundary of the cutter tooth flank. It has become an urgent problem to be solved in the life evaluation of milling cutters. The characteristics of the instantaneous posture variation of the milling cutter and the distribution of the thermal-stress mechanical coupling field of the flank of cutter tooth under the vibration were studied. Using the cross-scale load transfer method, the cross-scale relationship between the macro and micro friction loads on the cutter tooth flank was realized. The number of broken valence bonds, the sudden change of potential energy and the attenuation of elastic modulus of the super-cell on the flank of cutter tooth were studied. The mesoscopic scale identification method of the friction and wear boundary feature points of the tooth flank was proposed. The instantaneous and cumulative boundary distribution of friction and wear on the flank of cutter tooth were obtained, and verified by experiments.
Introduction
High-feed milling cutter is a typical high efficiency cutting tool, which is widely used in the machining of large structural parts. 1 In the process of high efficiency milling, under the milling cutter cutting into and out of the workpiece, the instantaneous contact relationship between the milling cutter tooth and the workpiece is in an unstable state.2–5 At the same time, the variation of vibration in the cutting process makes the friction process of the flank of the cutter tooth is unstable. It results in the ambiguity of the friction and wear boundaries, and the difficulty in assessing the life of milling cutter.
Under the combined action of vibration and cutting load, the friction and wear of the flank of high-feed milling cutter tooth are oriented from the super-cell damages in mesoscope. Then evolved to the macroscope, forming a macroscopic friction and wear area.6–9 Therefore, studying the deformation and damage of the super-cell on the flank of the cutter tooth, cross-scale identification method of flank friction and wear boundary was proposed. It had important significance for revealing the formation and evolution of friction and wear of high-feed milling cutter.
Scholars at home and abroad have made many contributions in milling cutter friction and wear state, boundary identification, and cross-scale research on milling cutter wear. Zhu et al.10–13 proposed a method for detecting cutter tooth wear based on the cutter tooth wear area. The results showed that the predicted wear area can summarize the cutter tooth wear degree and effectively prevent cutter tooth wear. Wu et al. 14 conducted wear experiments in micro-milling. They observed the wear characteristics of the milling cutter, and analyzed the wear mechanism. The results showed that the cutter wear was concentrated on the tip of the milling cutter. A wear band was formed on the bottom surface of the milling cutter. Altan et al.15–17 studied the effectiveness of cutting parameters on each wear area in the flank wear curve of the milling cutter to improve the service life of the cutter tooth. The results showed that in the initial wear area of the milling cutter, the wear is most seriously affected by the feed rate. In the steady-state cutter tooth wear area, the wear is most seriously affected by the cutting speed. Chang et al. 18 studied the evolution of the surface integrity of the cutter tooth at different wear stages. The results showed that the surface integrity and wear resistance of the treated cutter tooth were improved. The change of the cutter tooth wear was consistent with the change of the coating surface integrity. Scholars at home and abroad have conducted extensive research on the friction and wear of milling cutters, which has laid a foundation for the study of structural damage at small scales.
This study proposed a method for calculating the instantaneous milling posture of the flank of cutter tooth under vibration. According to the thermal-stress coupling field distribution of the flank in the milling process, a method for calculating the characteristic velocity vector of the flank was proposed. The stresses of the feature points of the flank was obtained. According to the cross-scale method, the effective correlation between the macroscopic and mesoscopic load was realized. The variation of the super-cell during the deformation and damage process were studied, and the local and integrity damage criteria were constructed. The feature points of the friction and wear boundary was identified. The instantaneous and cumulative friction and wear boundaries were obtained. The calculation results of the cumulative friction and wear boundary on the flank face and the experimental results were compared. Then the accuracy of the cross-scale identification method of the friction and wear boundary on the flank face was verified by experiments.
High-feed milling cutter flank feature point trajectory and milling vibration experiments
The high-feed milling cutter and its tooth structure are shown in Figure 1.

Structure of high-feed milling cutter.
In Figure 1, o s -xsyszs is the coordinate system of the milling cutter structure. Where os is the cutter tooth rotation center, the cutter origin. oi-xiyizi is cutter tooth coordinate. The coordinate origin oi is the tip point of the jth cutter tooth of the milling cutter. xi axis parallel to the lower boundary of the cutter flank. yi axis passes the tip of the cutter tooth and is perpendicular to the lower boundary of the cutter flank. zi axis is perpendicular to xi and yi axis. ri is the nominal milling radius of any cutter tooth of the milling cutter. rmax is the maximum turning radius of milling cutter tooth. θi is the angle between milling cutter tooth. αi is the milling cutter tooth installation angle. Δzi is the axial error of the cutter tooth. Δri is the radial error of milling cutter tooth. D is the diameter of milling cutter handle. H(xi, yi, zi) = 0 is the flank of cutter tooth equation.
The yq axis is an axis perpendicular to the installation and positioning plane, which is along the radial direction of the cutter tooth of the milling cutter and is tangent to the tip point of the cutter tooth near the milling cutter center. The xq axis is the axis perpendicular to the yq axis, and it lies in the mounting positioning plane. x1−xN was divided equidistantly along the xq direction. The cutting edge of the cutter tooth was taken as the benchmark. The curve y1−yN were divided along the yq direction with an equidistant offset. The feature point of the left end point of the flank along the xq axis was marked as feature point oa1−oaN. The feature point along the opposite direction of the yq axis were marked as oa1−oM1 in turn, as shown in Figure 2.

Meshing of milling cutter flank.
During the milling process, the cutting attitude of the milling cutter was offset due to the influence of the milling vibration. The milling cutter cutting reference coordinate and cutting attitude model under the vibration were established, as shown in Figure 3.
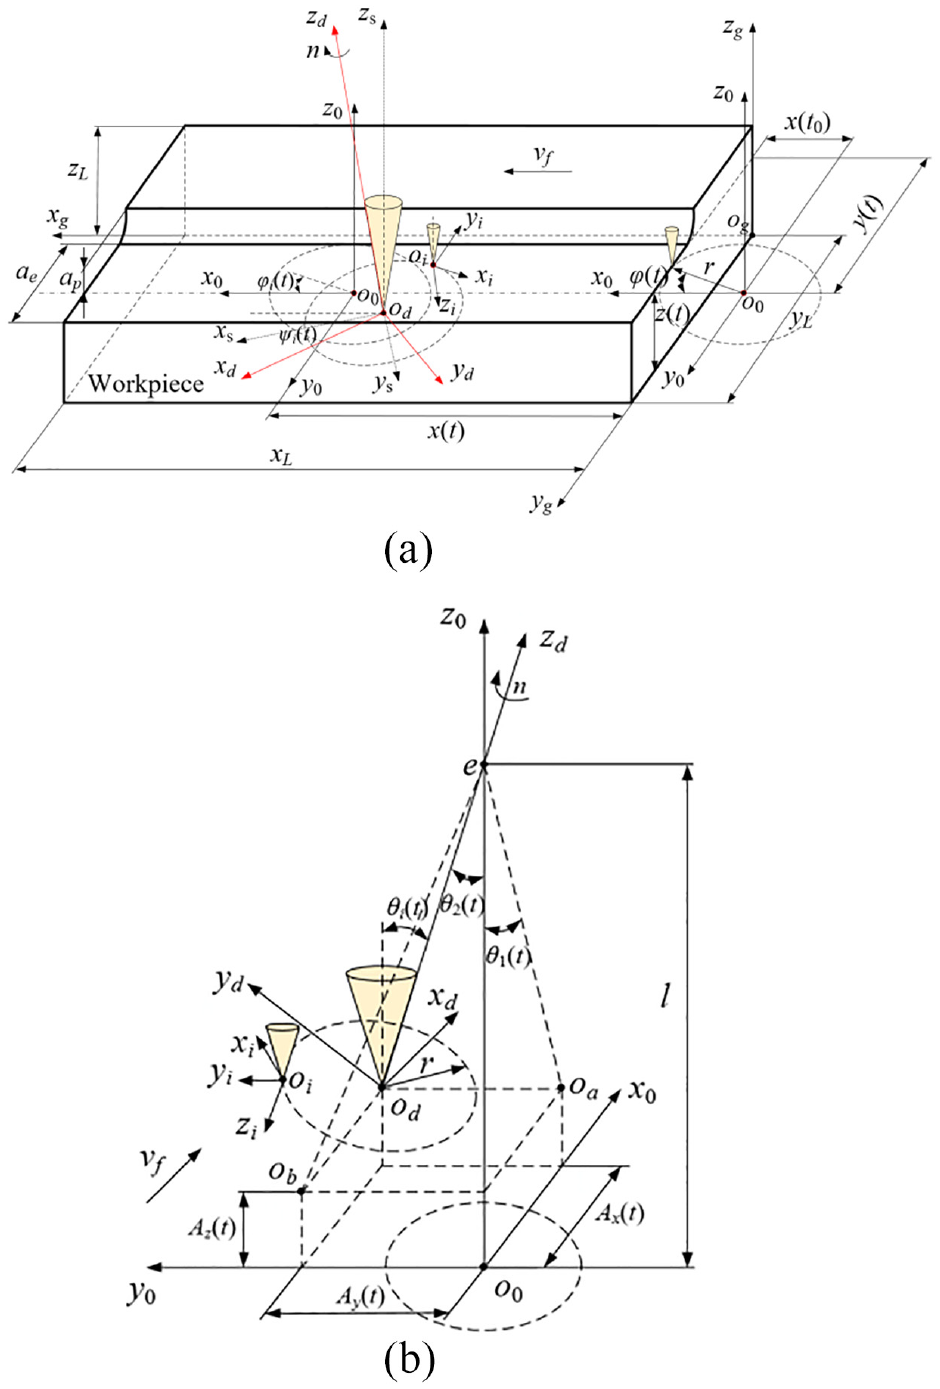
Cutting reference coordinate and posture model of milling cutter: (a) instantaneous posture of cutter tooth and (b) instantaneous attitude angle.
In Figure 2, o g -xgygzg is the workpiece coordinate, where xg is consistent with the feed speed direction of the milling cutter, yg parallel to cut width, and zg is consistent with the cutting depth direction. The cutting coordinate o0-x0y0z0 of the milling cutter without vibration is established with the rotation center o0 of the milling cutter under the vibration-free condition as the origin, where the x0, y0, and z0 are respectively parallel to the xg, yg, and zg of the workpiece coordinate. Under the action of milling vibration, the origin of the milling cutter coordinate becomes od. The cutting coordinate od-xdydzd of milling cutter with vibration is established, where xd, yd, and zd axis are the offsets of x0 axis, y0 axis, and z0 caused by vibration. os-xsyszs is the milling cutter structure coordinate, where os is the cutter tooth rotation center point, xs is os to the cutter tooth milling radius maximum tip point, zs parallel to zg, ys perpendicular to xs axis and zs. e, o0 respectively are the starting point and end point of the milling cutter overhang. l is the milling cutter overhang. φ(t) is the instantaneous position angle when the milling cutter cuts into the workpiece. θi(t) is the instantaneous attitude angle of milling cutter under vibration. eoa is the projection of the zd on the plane z0o0x0. eob is the projection of the zd on the plane z0o0y0. Where the angle between eoa and zd axis is θ1(t), and the angle between eob and z0 axis is θ2(t); Ax(t), Ay(t), Az(t) are the vibration displacements on x0, y0, and z0 axes respectively.
From Figure 3, the trajectory equation of the feature point of the flank in the workpiece coordinate is:

In the equation, M1, M2, and M3 are translation matrices, and T1, T2, T3, and T4 are rotation matrices, as shown in equations (2) to (4):


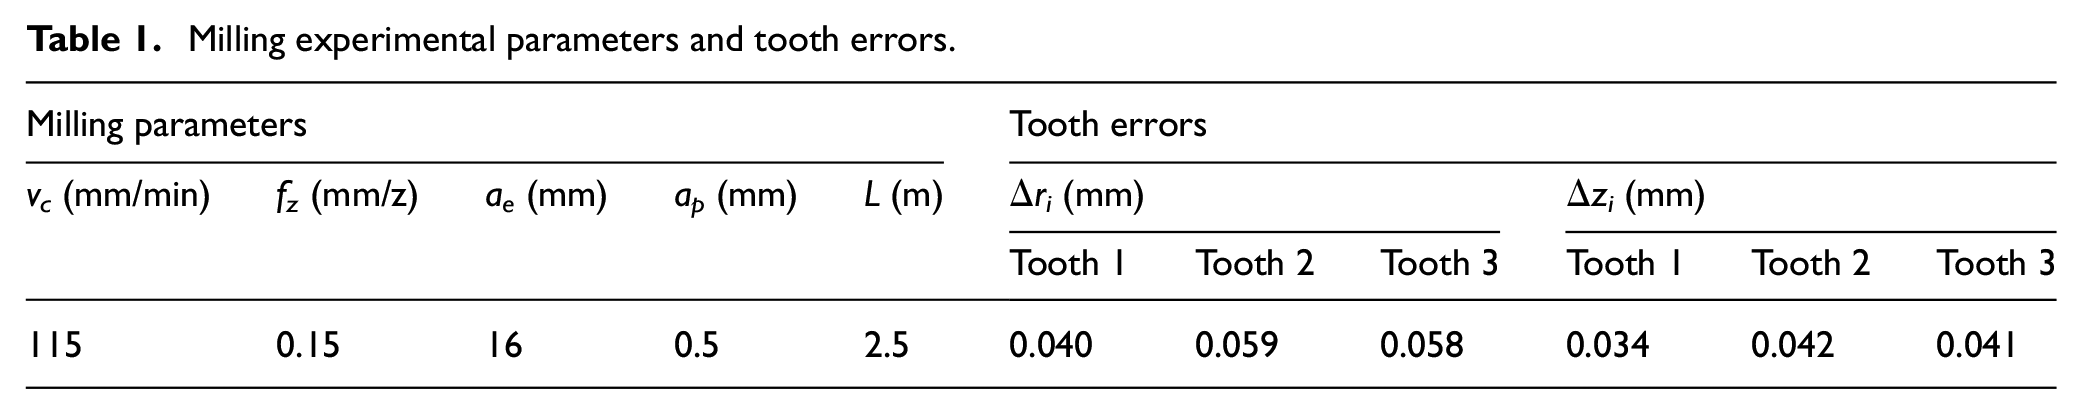
A high-feed milling cutter with a diameter of 32 mm was used to conduct the milling experiment of titanium alloy. Before the milling experiments, the axial error and radial error of the cutter tooth were measured. The milling experiment parameters are shown in Table 1.
Milling experimental parameters and tooth errors.
In Figure 4, the parameters of seven sampling cycles are shown in Table 2.

Experimental vibration signals.
Sampling cycle parameters.

According to Figure 4 and Table 2, the vibration acceleration signals of seven cycles are extracted, as shown in Figure 5.
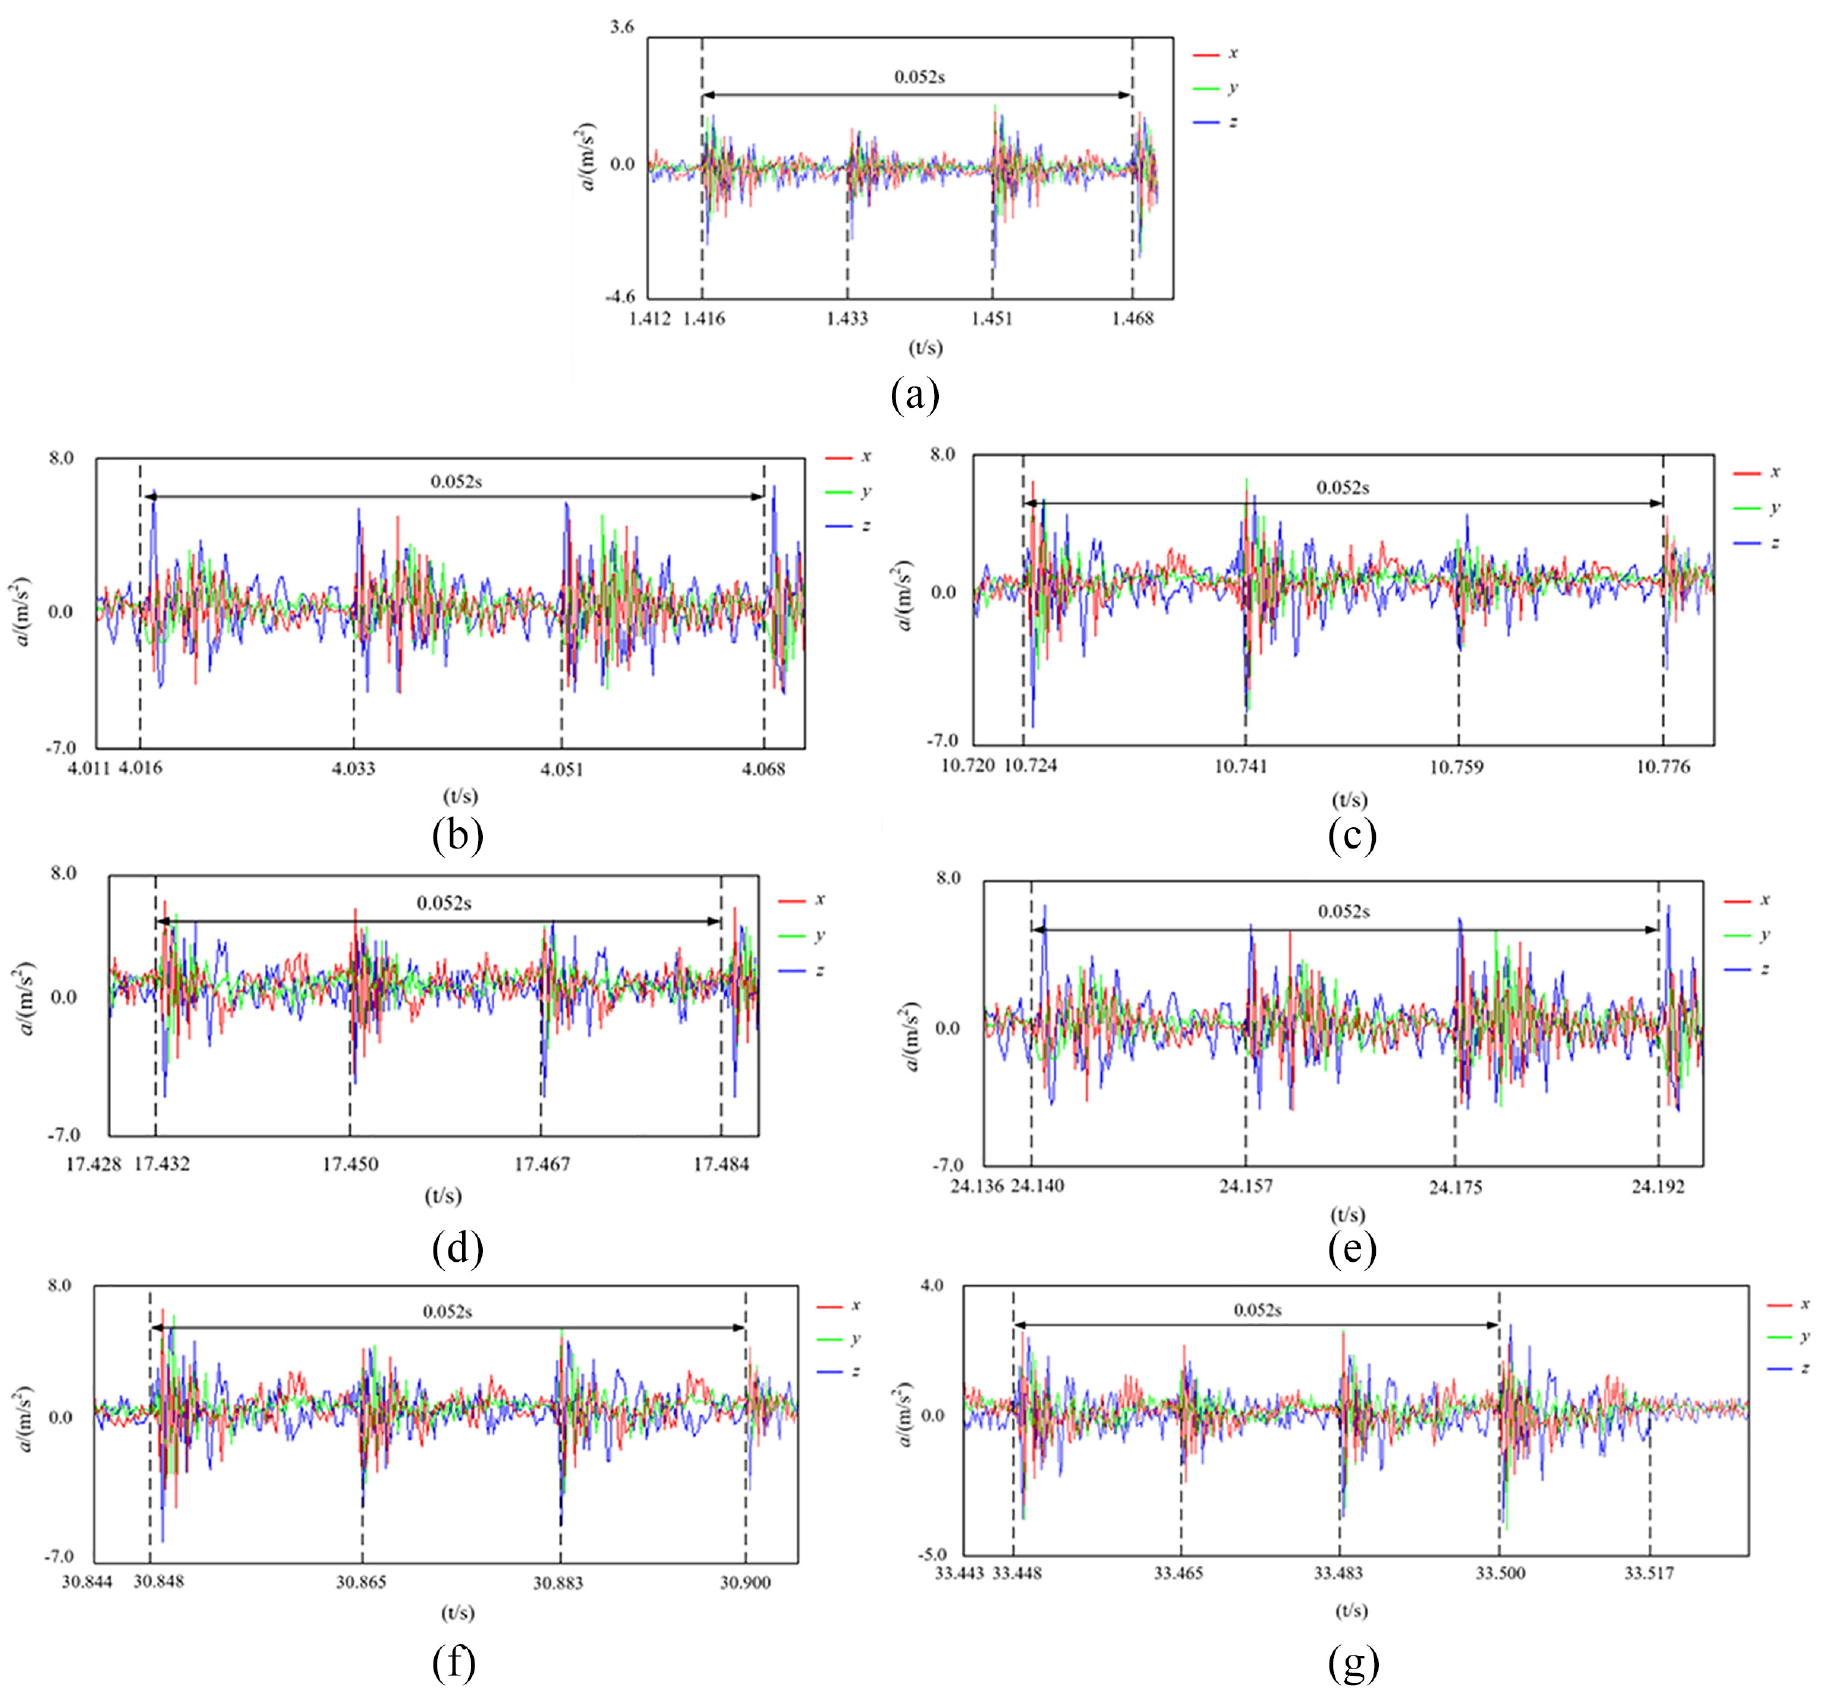
Vibration time domain signals of cycle 1 to cycle 7: (a) cycle 1, (b) cycle 2, (c) cycle 3, (d) cycle 4, (e) cycle 5, (f) cycle 6, and (g) cycle 7.
It can be seen from Figure 5 that the change characteristics of the milling vibration signal in different milling cycles are not the same, which directly affects the contact relationship between the cutter tooth and the workpiece, resulting in unstable friction and wear area of the flank of cutter tooth.
Distribution of thermal-stress coupling field on flank of high-feed milling cutter tooth
The finite element model and boundary conditions of the milling cutter were constructed by the above models and experimental results. Then the thermal-stress coupling field analysis of the milling cutter was carried out. It is found that the distribution area of the thermal-stress coupling field on the flank was more than 2.56 mm in yq. Therefore, the origin of coordinates was defined as oq′ along yq 2.56 mm. The distribution of the thermal-stress coupling field of the finite element cutter tooth at different instantaneous position angles was intercepted in each cycle. Among them, the thermal-stress coupling field distribution of cutter tooth 1 at different instantaneous position angles in cycle 3 of Table 2 is shown in Figure 6.

Thermal-stress coupling field of cutter tooth 1 (cycle 3): (a) φ = 5°, (b) φ = 31°, (c) φ = 57°, and (d) φ = 85°.
According to Figure 6, under the cutter tooth installation angle and the cutter tooth edge structure, with the increase of the cutter tooth instantaneous position angle in 1 milling cycle, the cutter tooth participated in the cutting area from the inside to the outside along the radial direction of the milling cutter.
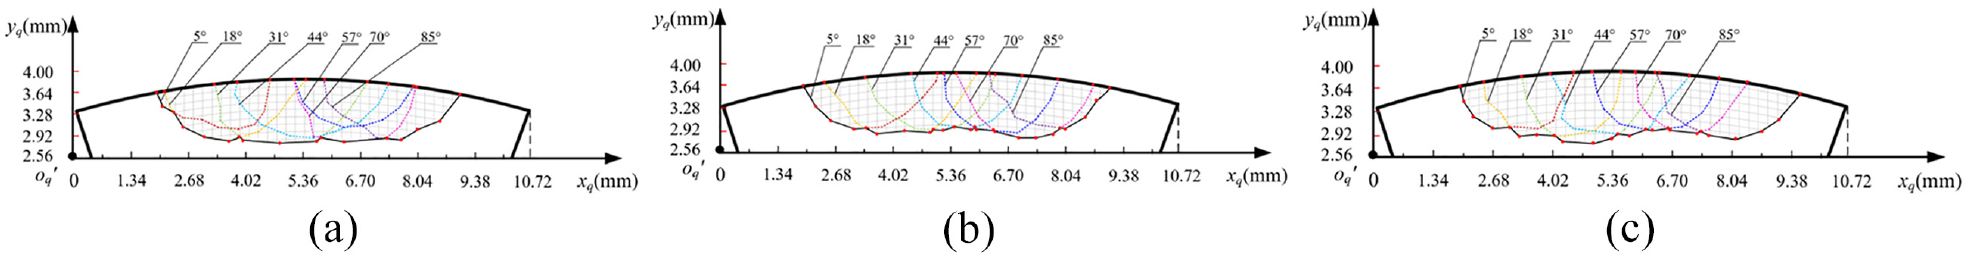
According to the distribution of the thermal-stress coupling field of the cutter tooth, the stress range of the cutter tooth is relatively large in the cutter tooth mid-cutting stage of the milling cycle. Taking the third milling cycle of tooth 1 as an example, extract the equivalent stress area above 2000 MPa in the instantaneous thermal-stress coupling field on the flank of the cutter tooth, as shown in Figure 7.

Stress distribution of tooth 1 (cycle 3): (a) φ = 5°, (b) φ = 31°, (c) φ = 57°, and (d) φ = 85°.
According to Figure 7, due to the influence of the cutter tooth structure, the force position of the cutter tooth was biased toward the inner side of the cutter tooth when it initially cut into the workpiece. In a milling cycle, the boundary of the equivalent stress distribution was shifted from the inside to the outside along the radial direction of the milling cutter. At different instantaneous position angles in the same cycle, the propagation range of the effective stress curves become larger and then smaller.
The 2000 MPa effective stress curves of the instantaneous thermal-stress coupling field of the flank under the conditions of different cutting cycles of different tooth were extracted, as shown in Figures 8 and 10.

Stress of cutter tooth 1 (effective stress is 2000 MPa): (a) cycle 1, (b) cycle 4, and (c) cycle 7.
According to Figures 8 to 10, under the influence of milling vibration and cutter tooth errors, the instantaneous posture of milling cutter and cutter tooth and cutter contact state were different. The effective stress distribution states of milling cutter tooth under different cycle conditions of the same cutter tooth load were different. There were obvious differences in the boundary distribution state of effective stress on the flank of different tooth.
Stress of cutter tooth 2 (effective stress is 2000 MPa): (a) cycle 1, (b) cycle 4, and (c) cycle 7.

Stress of cutter tooth 3 (effective stress is 2000 MPa): (a) cycle 1, (b) cycle 4, and (c) cycle 7.
Calculation method of instantaneous characteristic velocity vector and stress of flank of cutter tooth
For the feature point in the equivalent stress curve, the characteristic velocity vector model of the flank feature point relative to the machining transition surface was established, as shown in Figure 11.

Contact relation of cutter-workpiece and characteristic velocity vector: (a) contact relationship of cutter-workpiece and (b) characteristic velocity vector.
In the Figure 11, G(xg(t), yg(t), zg(t)) = 0 is the machining transition surface equation. H(xg(t), yg(t), zg(t)) = 0 is the flank equation of the cutter tooth. P(xg(t), yg(t), zg(t)) = 0 is the equation of the common tangent plane between the flank of the passing tooth and the machining transition surface.
According to equation (1), the instantaneous movement speed
Using vsx, vsy, vsz, the instantaneous movement speed
According to equations (5) and (6), the instantaneous movement speed
Using equations (2) to (4), the cutter tooth flank equation H(xg(t), yg(t), zg(t)) = 0 in the workpiece coordinate system and the machining transition surface equation G(xg(t), yg(t), zg(t)) = 0 simultaneously, the common tangent equation P(xg(t), yg(t), zg(t)) = 0 was obtained, as shown in equation (7).

In the cutter tooth coordinate system, the normal vector

Where,
The characteristic velocity vector


Where, θjs is the angle between the instantaneous movement speed vector
The feature point stress component was projected on the characteristic velocity vector direction, and the tangential stress in the characteristic velocity direction of the feature point on the flank of the cutter tooth was calculated, as shown in Figure 12.

Macroscopic stress calculation model of tooth flank: (a) flank feature point normal vector, (b) normal stress and tangential stress, and (c) feature point stress decomposition.
From Figure 12, using the finite element stress extraction results, the normal stress σN of the characteristic point of the flank of the cutter tooth was calculated, as shown in equation (12).

Where,
From Figure 12, using the equivalent stress extracted by the finite element, the tangential stress τm in the characteristic velocity direction of the characteristic point of the flank of the cutter tooth was calculated, as shown in equation (14).


Where, θmx, θmy, and θmz are the angles between the characteristic velocity vector and
Super-cell model and its failure criterion of the feature point of the flank of the cutter tooth
In order to study the influence of cutting load on the super-cell (expansion of the original cell to form new repeating units) structure of flank of the high-feed cutter tooth, the element content and proportion of flank of the cutter tooth were detected by scanning electron microscope and energy dispersive spectrometer, as shown in Figure 13. The appropriate lattice parameters of TiAlN were determined and the super-cell model of TiAlN coating on the flank of the cutter tooth was established by using ICSD Findit software.

Analysis results of energy spectrum of flank of the cutter tooth: (a) cutter tooth before milling experiment and (b) cutter tooth after milling experiment.
According to the minimum energy theory, the super-cell model on the flank of the cutter tooth was optimized to reduce the stress inside the atomic group and make the super-cell reach a stable state. High temperature relaxation method and fast condensation method were adopted to further optimize the super-cell model to eliminate unreasonable atomic configuration. The optimized super-cell model is shown in Figure 14.
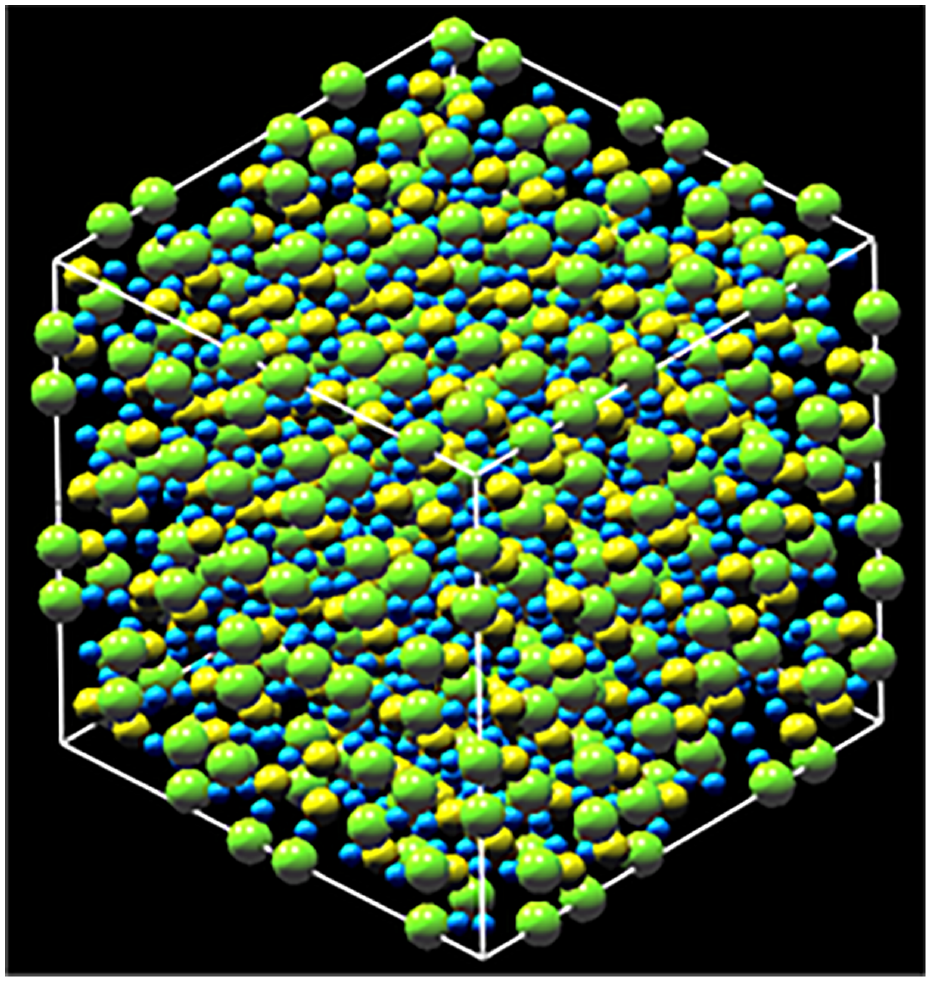
Optimized super-cell model.
The Bridge Domain cross-scale transfer method (BD) was introduced.19–22 Molecular dynamics theory was used to describe the selected area on the flank of the cutter tooth. And Lagrange method was used to describe the unselected area of flank of cutter tooth. The BD cross-scale coupling model is shown in Figure 15.

BD cross-scale model.
By using the above model and the cross-scale transfer theory, the macro scale cutting load could be transferred to atoms in mesoscale crystal cells. The motion of atoms at mesoscale could reflect the friction and wear characteristics of flank of cutter tooth. The effectiveness of the communication and transfer of macro scale and mesoscale load was realized.
In order to identify the critical value of potential energy when an atom crosses the boundary of the super-cell and reaches the potential energy mutation value of integrity failure, and the super-cell was loaded. The super-cell was subjected to a bidirectional normal stress of 2.23 GPa and a tangential stress in characteristic velocity direction of 0.92 GPa, as shown in Figure 16(a). Two-way normal stress of 2.84 GPa, tangential stress of 1.46 GPa, as shown in Figure 16(b). The bidirectional normal stress was 4.26 GPa, and the tangential stress was 2.21 GPa, as shown in Figure 16(c). The variation of failure parameters of super-cell is shown in Figure 17.

Stress loading results of super-cell: (a) first stress level, (b) second stress level, and (c) third stress level.

Variation of characteristic parameters of super-cell: (a) the potential energy curve, (b) number of valence bond fractures, and (c) elastic modulus.
As shown in Figure 17(b), there is no bond rupture occurs between atoms of super-cell with 2.23 GPa of τm and 0.92 GPa of σN, so the super-cell does not form local damage. When the potential energy of super-cell reaches −147,000 kcal/mol, atoms begin to leave the boundary of super-cell, and the super-cell structure forms local destruction. With the continuous application of load, when the potential energy difference between the two adjacent mutation points of the potential energy curve reaches 5500 kcal/mol, the integrity of the super-cell structure is destroyed.
Based on the variation of the characteristic parameters of super-cell failure, the local failure Dp on the flank of the cutter tooth was identified according to equation (16), and the local failure criterion of super-cell was constructed.

Where, t0 is the initial moment when the super-cell is loaded on the flank of the cutter tooth. e(t0) is the potential energy value of the super-cell at t0. e(t) is the instantaneous potential energy value of super-cell; Δe0 is the change value of potential energy in t0−t time interval. Δep is the critical potential energy value of the super-cell boundary corresponding to the formation of local destruction of the super-cell.
When the local failure of the super-cell has been formed, the integrity of the super-cell can be determined according to equation (17):

Where, Da is the integrity of the super-cell on the flank of cutter tooth. Δew is the potential energy change of super-cell in the time interval from tw to tw+1. Δea is the critical value of potential energy mutation corresponding to the integrity failure of super-cell. E(t0) is the elastic modulus of super-cell at t0. E(t) is the instantaneous elastic modulus of super-cell. ΔE0 is the change of elastic modulus of super-cell in t0−t time interval. ΔEa is the critical value of elastic modulus attenuation corresponding to the integrity failure of super-cell.
Mesoscopic failure identification and instantaneous boundary construction of feature point on flank cutter tooth
In order to reveal the friction and wear of the flank cutter tooth, the feature point of the flank cutter tooth were identified by using the super-cell damage evaluation method of the flank cutter tooth. The local and integrity damage feature points of the super-cell on the flank were marked with different colors.
The lowest integrity damage feature point along the yq axis on each line x1−xN was select. The set of feature points of the boundary of the super-cell integrity damage feature point on the flank of the tooth flank is obtained, as shown in equation (18):

The lowest local damage feature point along the yq axis on each line x1−xN was select. The set of feature points of the boundary of the super-cell local damage feature point boundary on the flank of the tooth flank is obtained, as shown in equation (19):

In order to analyze the variation of super-cell damage within the boundary range of super-cell damage feature points. The paper taked the period as 3 and the instantaneous position angle as 31° as an example. The feature point within the boundary range of the integrity damage feature point was (5.16, 3.67). The feature point within the boundary of the integrity damage feature point and the local damage feature point was (5.16, 3.29). The characteristic parameters of super-cell damage at the same position were extracted for the remaining two teeth, and the results are shown in Figures 18 to 20.

Characteristic parameters of super-cell damage of cycle 3 and tooth 1 (φ = 31°): (a) potential energy, (b) elastic modulus, and (c) valence bond breaking.

Characteristic parameters of super-cell damage of cycle 3 and tooth 2 (φ = 31°): (a) potential energy, (b) elastic modulus, and (c) valence bond breaking.

Characteristic parameters of super-cell damage of cycle 3 and tooth 3 (φ = 31°): (a) potential energy, (b) elastic modulus, and (c) valence bond breaking.
It can be seen from Figures 18 to 20 that the super-cell damage structure was mainly related to three mesoscopic characteristic parameters. In small-scale time, as the load continues to be applied, the valence bonds of the super-cell were broken, causing a sudden change in the potential energy. Its mesoscopic structure began to form damage, and the elastic modulus began to decay. When the elastic modulus decay reaches the critical value of its structural integrity damage, it means that the integrity of the super-cell structure was destroyed.
It can be known from equations (18) and (19). In UA, along the xq direction, the feature point with the smallest yq coordinate value was selected to form the boundary of the super-cell integrity damage feature point. In the UP, the feature point with the smallest yq coordinate value is selected to form the boundary of the feature point of the local damage of the super-cell.
Using the above method, the number of valence bond fractures, the value of potential energy, and the distribution of elastic modulus of the super-cell damage in Figure 7(b) were extracted for fitting. Two types of instantaneous boundaries were obtained, and the results are shown in Figure 21.

Super-cell characteristic parameters distributed surface of tooth 1 in cycle 3 (φ=31°): (a) number of valence bond fractures, (b) potential energy value, and (c) Elastic modulus.
It can be seen from Figure 21 that the characteristic parameters distribution of the super-cell integrity damage feature point boundary and the local damage feature point boundary were obviously different. The boundary of the integrity damage feature point were larger than the local damage feature point boundary. The above method can be used to characterize small-scale friction and wear boundary.
According to the meshing method of the flank surface, the flank and the feature point were selected to identify the damage of the feature points within the boundary of the supercell damage feature points. Stress loading was performed on the super-cell of the feature point of the flank of cutter tooth. The super-cell damage of feature points in a milling cycle were determined. Figure 22 shows the boundary of the super-cell damage feature point of tooth 1 and cycle 3.

Super-cell damage characteristic points boundary of cycle 3 and tooth 1.
It can be seen from Figure 22 that the boundary of the super-cell damage feature point on the flank of cutter tooth was related to the integrity of the super-cell structure. When the super-cell is loaded, its structure was partially damaged and its integrity was damaged. By accumulating the damage of the super-cell structure of the flank in a milling cycle, the super-cell integrity damage and local damage feature point boundary of a single milling cycle were obtained.
In order to analyze the changes of the super-cell integrity damage and local damage feature point boundary between different cutter teeth. The same milling cycle as tooth 1 was selected, and the feature points of tooth 2 and tooth 3 stress were applied. The results are shown in Figures 23 and 24.

Super-cell damage characteristic points boundary of cycle 3 and tooth 2.

Super-cell damage characteristic points boundary of cycle 3 and tooth 3.
It can be seen from Figures 23 and 24 that the boundary of the super-cell integrity damage and the local damage feature point on the flank of cutter tooth were different, but the overall distribution area was relatively close. Due to the existence of milling vibration and the installation angle of the cutter tooth, with the increase of the instantaneous position angle of the cutter tooth, the part of the cutting edge that participates in cutting shifts from the inner side of the cutter tooth to the outer side. The scale of super-cell damage was much smaller than the detection scale of friction and wear in the experiment. The extent of the boundary of the super-cell integrity damage and local damage feature point may be larger than the experimental results of friction and wear boundary.
Cumulative friction and wear boundary of flank of cutter tooth and its experimental verification
To reveal the correctness of the cross-scale identification method of the friction and wear boundary of the flank of cutter tooth, the test results of the wear of the experimental scheme in Table 1 were obtained, as shown in Figure 25.
Test results of friction and wear boundary test of cutter tooth: (a) Cutter tooth 1, (b) cutter tooth 2, and (c) cutter tooth 3.
According to the entire milling process, using the above-mentioned friction and wear boundary identification method, the thermal-stress coupling field of the three cutter teeth were analyzed. The super-cell damage feature point boundary of a single instantaneous position angle in one milling cycle were obtained. The super-cell failure feature point boundary of all instantaneous position angles of a single milling cycle were accumulated to obtain the super-cell failure feature point boundaries of one milling cycle. To get the cumulative solution boundary of friction and wear of a cutter tooth, accumulation the boundary of the super-cell failure feature points formed by the seven milling cycles divided in Table 2, as shown in Figures 26 to 28.

Comparison of friction and wear boundary of tooth 1.

Comparison of friction and wear boundary of tooth 2.
Comparison of friction and wear boundary of tooth 3.
In the Figure, owl is the characteristic point of failure of the super-cell integrity at the leftmost end of the tooth flank. osl is the leftmost local damage feature point. owr is the rightmost integrity damage feature point. osr is the rightmost local destruction feature point. owd is the lowest integrity damage feature point. osd is the bottommost local damage feature point. lw is the friction and wear width of the tooth flank, and is the distance between the leftmost integrity failure feature point and the rightmost integrity failure feature point along the xq axis. lf is the local failure width of the tooth flank, and is the distance between the leftmost local failure feature point of the tooth and the rightmost local failure feature point along the xq axis. hw is the friction and wear height of the flank of the cutter tooth, which is the distance between the bottom integrity failure point and the midpoint of the cutter tooth cutting edge along the yq axis. hf is the local failure height of the tooth flank, which is the distance between the bottommost local failure feature point and the midpoint of the tooth cutting edge along the yq axis.
It can be seen from Figures 26 to 28 that, along the xq direction, comparing curve 1 and curve 3, the left and right boundaries were relatively close. Comparing curve 2 and curve 3, there was a certain difference between the left and right boundaries. Although curve 1 exhibited similar distribution characteristics to curve 2 and curve 3, there were still some differences along the yq direction. The reason was that the measurement scale of curve 2 was 0.3 nm, and the overall measurement scale of the super-cell was 7 nm, which is much smaller than the measurement scale of curve 1. The micro-scale structural damage caused by friction can be identified in a larger range, so that the range of curve 2 was larger than that of curve 3. And the range of curve 3 was larger than that of curve 1.
Using the gray correlation analysis method, the correlation analysis was carried out on the distribution characteristics of curve 1, curve 2, and curve 3. Among them, ξ1 was the gray correlation degree between curve 1 and curve 3. ξ2 was the gray correlation degree between curve 1 and curve 2.
From the Table 3, the correlation value between the solution and experimental of the friction and wear boundary of each milling cutter was above 0.72. The results showed that the solution and experimental of the friction and wear boundary had similar distribution characteristics. The cross-scale identification method of milling cutter friction and wear boundary can identify the smaller-scale wear caused by the friction on the flank of the cutter tooth, which was beneficial to improve the evaluation accuracy of milling cutter service life.
Friction and wear boundary correlation degree.
Conclusions
The instantaneous cutting posture and thermal-stress coupling fields on tooth flank of milling cutter have been analyzed. The result showed that, the contact stress distribution of the flank was shifted from the inside to the outside of the tooth in each cutting cycle. And the equivalent stress boundary propagated cyclically from the inside to the outside along the radial direction of the milling cutter. A method for calculating the instantaneous characteristic velocity vector, normal stress and shear stress in the characteristic velocity direction of the flank of cutter tooth was proposed. The variation of the instantaneous contact relationship between the flank of cutter tooth and the machining transition surface under vibration was revealed. The cross-scale correlation of the macro-mesoscopic friction force on flank of cutter tooth was realized by the cross-scale transfer method.
A mesoscopic identification method for the feature points of friction and wear boundary on the flank of cutter tooth was proposed. This method utilized the number of valence bond fractures, potential energy abrupt change, and elastic modulus decay characteristics of the super-cell. The local and integrity damages in mesoscope of the tooth flank under the effects of shear stress in the characteristic velocity direction and normal stress were identified. The results showed that the boundaries formed by super-cell integrity damage feature points on flank were significantly larger than that by local damage feature points. These two boundaries reflect the instantaneous distribution of two different degrees of friction and wear on the flank of the cutter tooth, respectively.
The boundary distribution of instantaneous friction and wear on the flank was revealed. The cumulative friction and wear distribution of tooth flank were obtained by using the feature point of the maximum value of the instantaneous boundary in the whole cycle of milling cutter. The results showed that the range of the cumulative friction and wear solution boundaries were larger than that in experiments. But correlation degree between two kinds of boundaries was greater than 0.7, they had similar distribution characteristics. This method could be used to identify the formation of the friction and wear boundaries of the flank and the distribution of small-scale wear.
Footnotes
Handling Editor: Chenhui Liang
Declaration of conflicting interests
The author(s) declared no potential conflicts of interest with respect to the research, authorship, and/or publication of this article.
Funding
The author(s) disclosed receipt of the following financial support for the research, authorship, and/or publication of this article: This research was funded by National Nature Science Foundation of China, 51875145 and the National Natural Science Foundation of China, 52105440.