
Abstract
Due to the recent earthquakes in Korea, many cases of damage to anchorage of the electric cabinet in the power plant have been reported. Accordingly, for the purpose of reviewing the seismic safety, a study on the load characteristics transmitted to the anchorage during an earthquake is proceeding. It was investigated that the load transmitted to the anchorage also changes according to the change in the natural frequency of the cabinet. However, in the case of cabinets used in the actual field, it is necessary to prove the results of previous studies under more diverse conditions because they are composed of various stiffness. In this study, a structure replacing a cabinet was manufactured and the load transmitted to the anchorage under various conditions was analyzed through an experimental and analytical approach. As a result of this study, it was confirmed that the load transmitted to the anchorage increases as the natural frequency of the structure increases, and a correlation equation between the natural frequency of the structure and the transmission load of the anchorage was derived. Using the correlation equation proposed in this study is expected to help identify the load delivered to the cabinet anchorage under an earthquake.
Introduction
The recent occurrence of earthquakes on the Korean Peninsula since 2015, 1 including magnitude 5.8 and 5.4 earthquakes in Gyeongju and Pohang in 2016 and 2017, respectively, illustrates a sharp increase in the rate of seismic activities. 2 The earthquake in Gyeongju was the largest among the recorded earthquake observations, and exceeded the seismic design criteria within certain frequency sections of the acceleration response spectrum; in addition, the earthquake in Pohang caused major damage to buildings and facilities.3,4 As such, the environment in South Korea is no longer safe against earthquakes, and research must be conducted to minimize the loss of life as well as social and economic damage. In particular, if a power plant, an important facility of indirect social capital, is exposed to a natural disaster such as an earthquake, functional losses and malfunctions of the operating and power generating facilities may occur, which may lead to secondary damage that causes more serious social disruption and damage. 5 According to a recent survey result, more than 70% of the seismic damage to buildings has occurred in operating facilities, thereby indicating their importance.6,7 Accordingly, studies have been actively conducted to analyze the seismic behavior of operating facilities and secure the seismic performance with a goal of minimizing loss of life and social and economic damage.8–11
In South Korea, the Seismic Design Codes of Buildings revised in March 2019 stipulates that the seismic performance of major nonstructural components should be verified in terms of maintaining their functions after an earthquake. 12 In the case of a nuclear power plant, the strict seismic performance verification of the major equipment related to safety is required, and in the case of broadcast communication facilities, 13 as a seismic test method, it is necessary to verify the basic seismic design by conducting a shaking table test or numerical analysis.
In power plant operations, typical mechanical and electrical equipment are mostly cabinet types. The exterior is made of steel panels and frames; the interior accommodates mass such as a variety of electrical and electronic components and computational processing devices; and the base of the main body and the concrete slab are fixed using anchor bolts, as a self-sustaining type. In actual operating facilities, however, it is difficult to conduct parameter experiments considering various conditions owing to economic and spatial constraints. Therefore, the study was carried out by fabricating test specimens composed of steel frames and mass, as shown in Figure 1. In the case of an alternative structure, reliability was ensured by comparing the natural frequency measured through shaking table test with the natural frequency measured through shaking table test of the actual cabinet.

Steel structure to replace electric cabinet.
Before analyzing the seismic motion load characteristics of the anchorage, the natural frequency of the target structure was measured through a shaking table test with reference to the previous study 14 that evaluated the performance of the anchorage of the electric cabinet during the earthquake.
In addition, eigenvalue analysis was performed with numerical analysis, and the reliability between the experiment and analysis was verified by comparing the experimental eigenvalue. Using the verified initial finite element modeling, the structural rigidity was increased by adding a steel frame, and the change in natural frequency was confirmed. And by additionally checking the characteristics of the load transmitted to the anchorage of the structure according to the change of the natural frequency, a correlation expression between the natural frequency of the structure and the load transmitted to the anchorage was derived.
Input earthquake ground motion
A resonance search test was conducted according to ICC-ES AC 156: 2010 Section 6.4.5 15 to evaluate the suitability of the experimental response spectrum or analyze the deformation of the system after the test. The search test was conducted using a sinusoidal sweep in the left and right (X), front and rear (Y), and top and bottom (Z) directions, respectively. During the test, the sweep rate was 2 octave/min and the magnitude of acceleration was set to a low level (0.49 or higher) to minimize the damage of the specimen. The applied range of frequency was set to 14–20 Hz in the front and rear directions and 8.15–10.5 Hz in the left and right directions, considering the natural frequencies of a common cabinet, that is, within the 5–20 Hz range, based on a previous study. 16 To satisfy the required response spectrum (RSS) of ICC-ES AC 156, considering the seismic design standards of South Korea, 17 the seismic waveforms that are input to the shaking table were applied through an artificial earthquake (100%) acceleration adjustment based on the seismic design codes of the building. Because the seismic design codes stipulate a mandatory use of 100% when applying an artificial earthquake, 100% was applied in this study accordingly.
The required response spectrum of ICC-ES AC 156 considering the layered response of the test specimen is shown in Figure 2, 18 and the variables for preparing the required response spectrum are shown in Table 1. Here, single-cycle design spectrum acceleration (SDS) was derived as shown in equation (1), in accordance with the domestic architectural structural standards. The seismic zone coefficient (S) was assumed to be seismic zone I to apply 0.22 g, and the single-cycle ground evaporation coefficient (Fa) was assumed to be solid soil ground to apply 1.5. Since equipment facilities such as electric cabinets can be installed on all layers of the structure, the ratio (z/h) of the structure and the installation position was assumed to be 1 in consideration of the most stringent conditions, installation on the uppermost layer. The damping ratio of the required response spectrum was assumed to be 5% based on the ICC-ES AC 156 shaking table test. Equations for determining the spectral acceleration in the horizontal direction are shown in equations (2) and (3). Equations (4) and (5) are equations for determining spectral acceleration in the vertical direction. ARIG-H is a horizontal ZPA (zero period acceleration), and ARIG-V is a vertical ZPA. According to the ICC-ES AC 156 criterion, AFLX-H did not exceed 1.6 times the SDS.


ICC-ES AC156 RRS (PGA 100%).
Seismic parameters of AC156 based on KBC.

Experimental and analytical approach
In this study, it fabricated test specimens and measured the natural frequency through the shaking table test. Then, the results of numerical analysis were compared with the experimental results to verify the reliability.
Experimental study
Specification and installation of test specimen
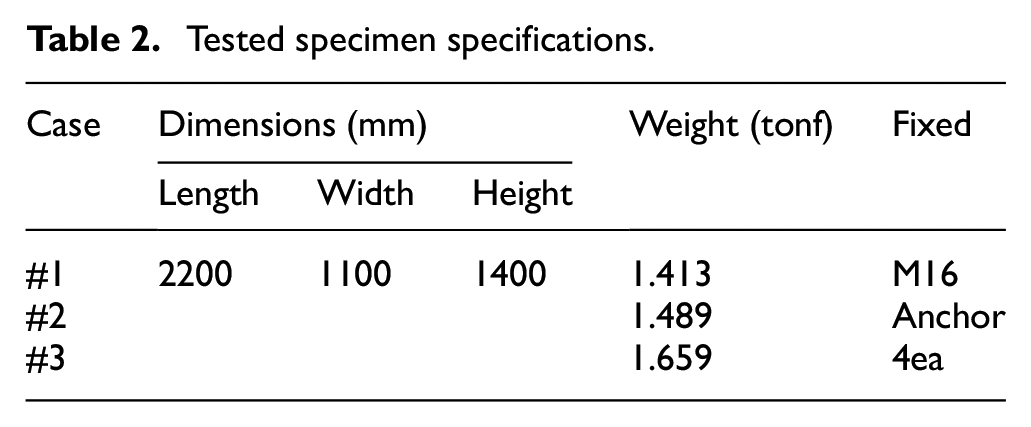
For the test specimen used in the shaking table test, a steel rectangular frame for a regular structure was fabricated and assembled based on the design shown in Figure 3, and was constructed according to the specifications summarized in Table 2. A steel mass of 0.9 tonf (0.3 tonf × 3ea) was fastened to the upper center of the specimen to take the mass into consideration; similar to the installation of an actual structure, the base of the shaking table and both ends of the specimen were fixed using M16 high-tensile bolts. Using the change in the natural frequency of the structure owing to addition of steel frames as a parameter, test specimens were arranged as shown in Figure 4, and the load transferred to the fixed anchorages owing to the input earthquake was comparatively analyzed between test specimen types.
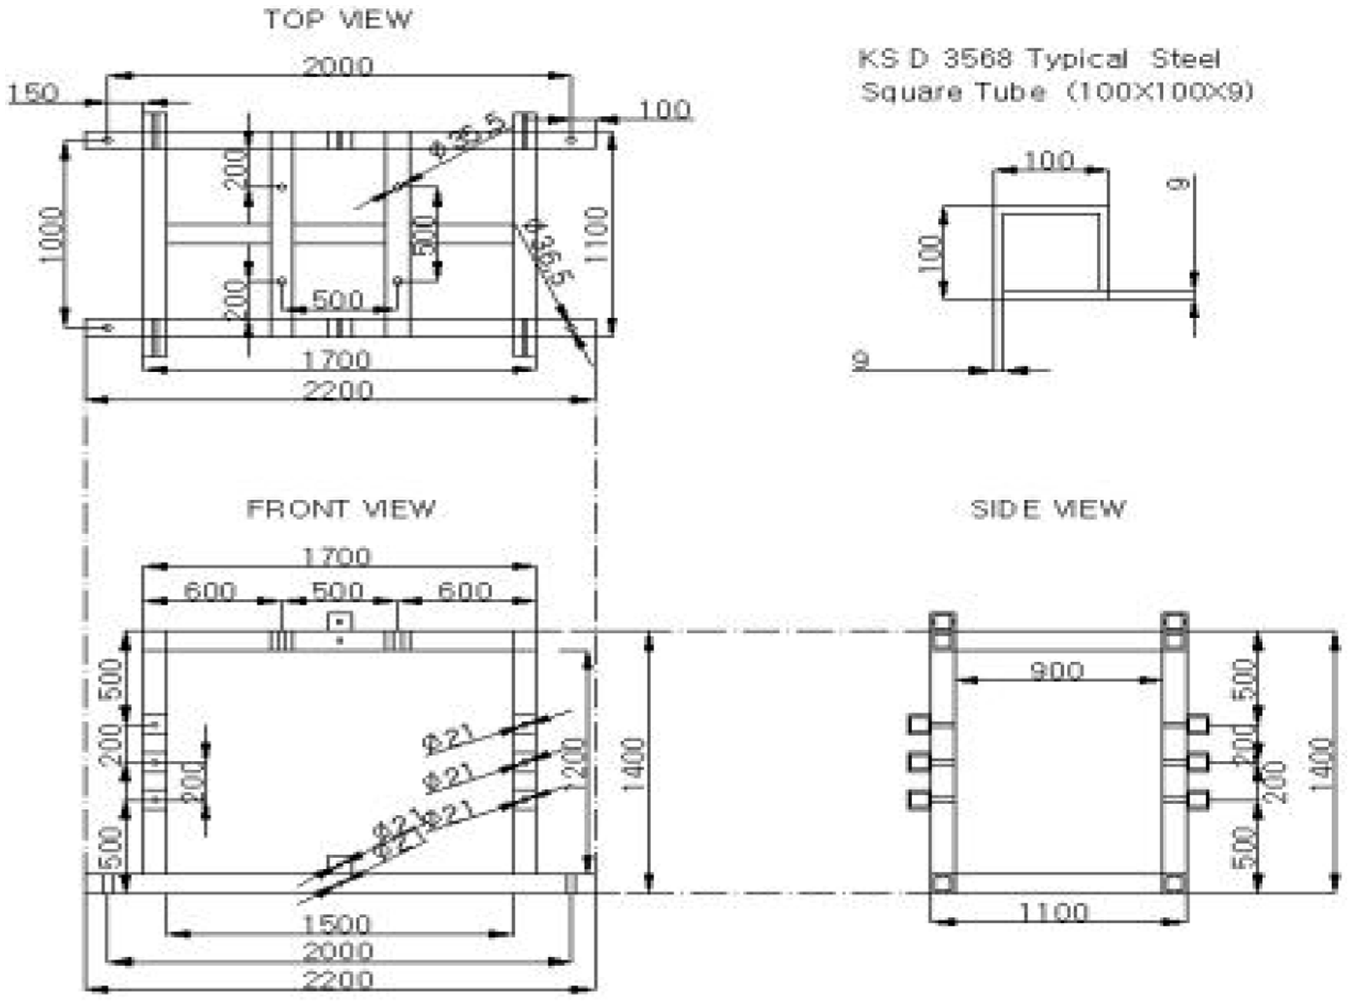
Dimension of the tested specimen.
Tested specimen specifications.

Shape and weight of the alternative structures for each case: (a) case #1_No reinforcement, (b) case #2_ Add vertical frame (2ea), and (c) case #3_ Add vertical frame (2ea) and horizontal frame (4ea).
To analyze the response of the specimens, three-axis accelerometers were installed at the upper and middle parts on the left side of the frames and the center of the upper part. A three-axis accelerometer was installed on the shaking table to check the control results of the shaking table, and two linear variable differential transformers (LVDTs) were installed in the left and right (X) and front and rear (Y) directions on the upper- and lower-left parts to measure the relative displacements of the test specimen. A ring-type load cell (LC1–LC4) was installed on each bolt to measure the anchorage load caused by the earthquake ground motion. Figure 5 illustrates the installation position and image of each measurement sensor.

Sensor location.
Experiment method and procedure
The six degree of freedom shaking table system (MTS Systems Corporation, USA) operated by the Seismic Simulation Test Center of Pusan National University was used in the seismic performance tests. Table 3 summarizes the specifications of the shaking table system. Prior to conducting the seismic simulation test, a resonance search test was first applied to confirm the natural frequency and dynamic characteristics of the test specimens. The test procedure is summarized in Table 4, and in each experimental case, the seismic simulation test was conducted by identically adjusting the artificial earthquake AC 156 (PGA 100%) for one axis, that is, the X-axis.
Shaking table specifications.

Shaking table test procedure.

Analytical study
In this study, time history analysis was performed using the finite element analysis method, which is one of the representative methods, to examine the reliability of the experimental seismic performance evaluation method of electric cabinets of power generation facilities. In general, numerical analysis has more accurate dynamic behavior than static behavior and more accurate nonlinear behavior than linear behavior. Time history analysis is an analysis to identify the dynamic behavior of structures, and nonlinear time history analysis is the most accurate analysis method to identify nonlinear dynamic behavior of structures, so it is often used for seismic performance evaluation. In addition, since the history of displacement/anchor load/acceleration response that cannot be obtained through static or response spectrum analysis can be known, time history analysis can be more objective and accurate to review dynamic behavior such as shaking table tests.
Modeling specifications and geometry
A finite element analysis was performed using ABAQUS, and a nonlinear model for steel material was considered by referring to data from previous studies as shown in Figure 6 to find out the nonlinear behavior characteristics. 19

Stress-strain curve of the steel material properties.
According to Figure 6, the elastic modulus applied to the steel was determined to be 199,596.7 MPa, and the yield strength and strain were 412.7 MPa and 0.0021, respectively. As shown in Figure 7(a), the FE model was composed by classifying three groups: the main body composed of wires, a bottom frame composed of solids, and anchor bolts (eight-node Solid element, C3D8). To analyze the loads transferred to the fixed anchorages owing to the input earthquake ground motion, it used the interaction function, shown in Figure 7(b), to assign the interface between the contact surfaces of the bottom frame and the anchor bolts and induce a sliding effect.

(a) Overall 3D-modeling geometry and (b) assigned contact surfaces.
Damping effect
Mass and damping must be reflected in the time history analysis. Therefore, in order to realize the damping effect of the cabinet, the method of applying the α and β factors to the material properties was used using the commonly used Rayleigh damping system algorithm. 20 For the calculation of the damping coefficient αm and βk values of this system, the natural frequency obtained through Eigen value analysis with reference to previous studies 21 and the seismic resistance prescribed in US nuclear power plants The damping coefficient value was calculated using the non-structural element damping coefficient 3% suggested for general equipment in the performance review method. 22 The damping effect was realized by applying the material properties in Table 5 to the analysis program.
Description for the material properties of the modeling.

Load condition
The seismic load was analyzed using 100% PGA of the ICC-ES AC156 artificial seismic waves described earlier in Section 2. The seismic load and direction were considered based on the axis on which the LVDT was installed during the test (the X-axis during the test and Z-axis during the analysis). In the case of an eigenvalue analysis, the positions were all-fixed; in addition, in the case of a time history analysis, two-axes (X- and Y-axes) upon which the load was not applied, were fixed, and the Z-axis, upon which the load was applied, was released, after which the analysis was conducted.
Comparison and verification of experimental and analytical results
Natural frequency
Among the major factors affecting the natural frequency, the weight was set identically in each case, and the test was conducted by focusing on the change in natural frequency according to the frame increase. The natural frequency of test specimen was determined by calculating the transfer function of the response acceleration (unit, b) at each position of the test specimen for the acceleration (base, a) input to the shaking table during the resonance search test.
The transfer function (Tab) is calculated using the Cross Power Spectral Density (Pba) of the input and output signals for the Power Spectral Density (Paa) of the input signal, as shown in equation (6). A symmetric hamming window was applied for each signal to improve the precision of the resonance analysis. The minimum frequency interval of the resonance search was 0.25 Hz.

In the resonance search test results, identical transfer functions were measured in each case at the measurement positions A2, A3, and A4 as shown Table 6. It was determined to be due to the symmetrical structure characteristics of the test specimens. After the resonance search test, the ABAQUS finite element analysis program was used to verify the reliability of the test. In each case, the weight of the test was identically applied to the upper frame part of the finite element model, and the results were compared to the test results based on the change in natural frequency for the single axis (X-axis) direction.
Results of the resonance search test.

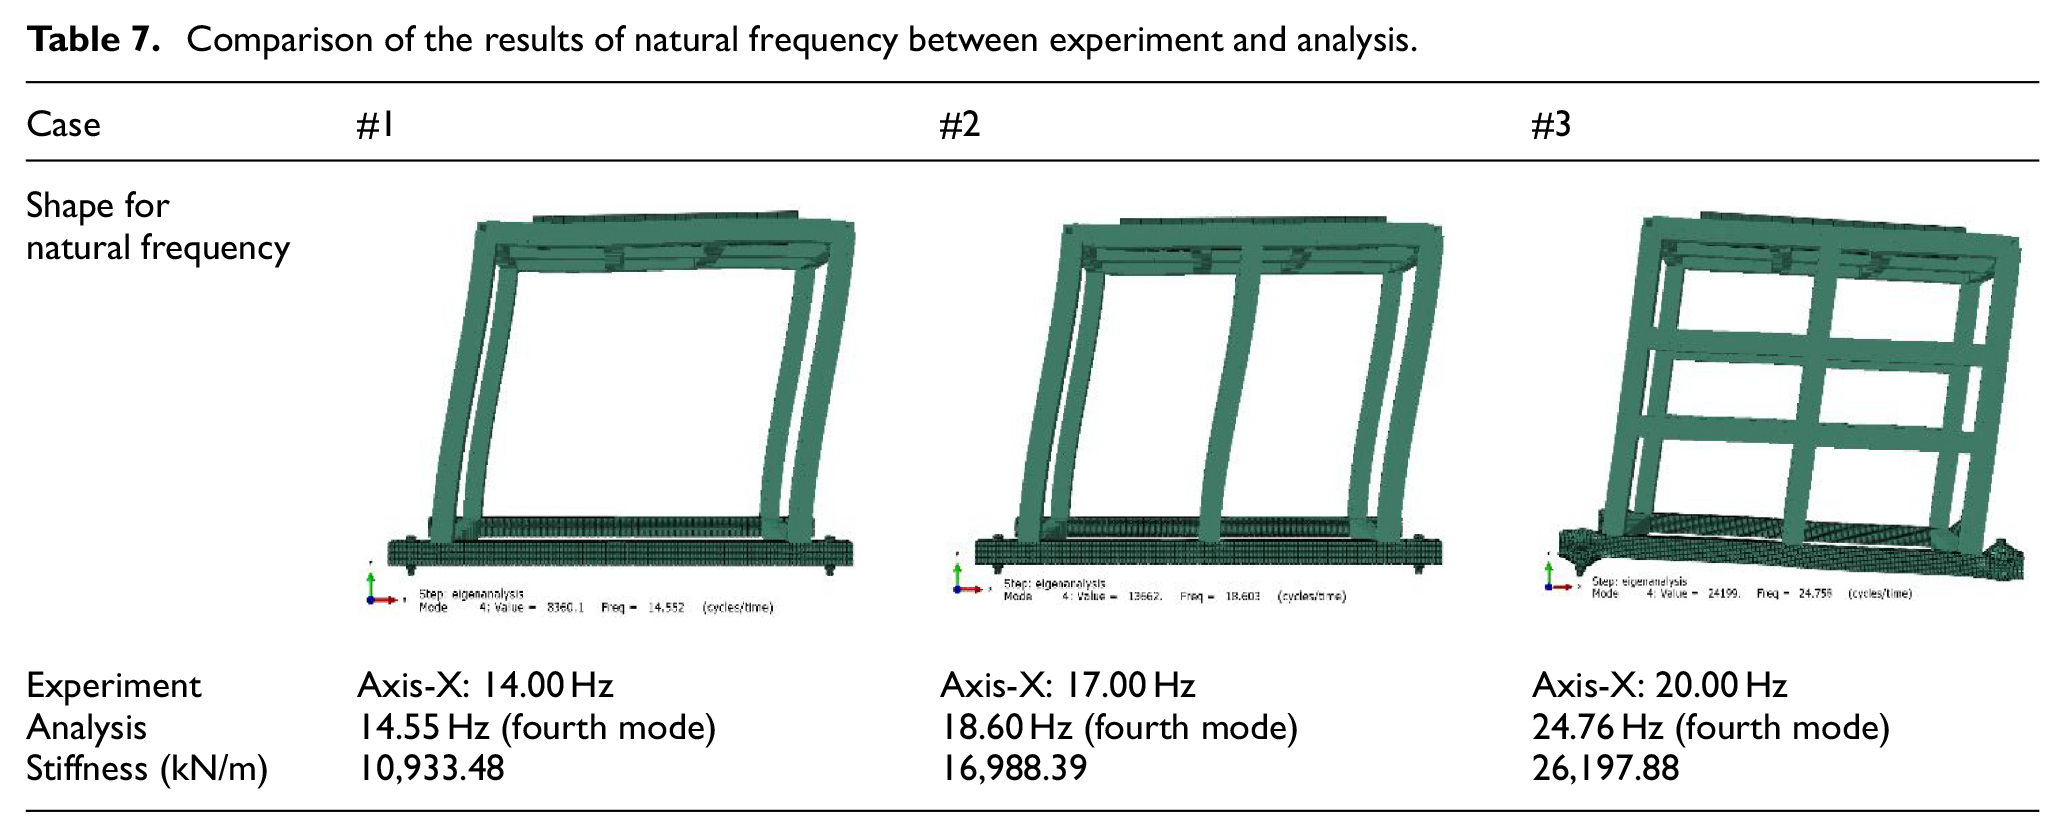
In the analytical study, the Lanczos method, a mode extraction approach, was used to determine the natural frequency for a total of 10 modes, and the value at the fourth mode, in which more than 90% of mass was engaged on the X-axis, was determined as the natural frequency. Similar to the test results, the analysis results showed that the natural frequency changed owing to the change in stiffness caused by an addition of frames. Furthermore, as shown in Table 7, the natural frequency and equation (7) were used to calculate the stiffness value k through a reverse calculation, thereby experimentally confirming the change in natural frequency caused by the change in stiffness of the structure, which is theoretically known.

Comparison of the results of natural frequency between experiment and analysis.
Anchorage load
Ring-type load cells were installed on the bolts that fixed the base of the shaking table and both ends of the test specimen, and the loads transferred by the input earthquake ground motion were measured to analyze the characteristics of the loads transferred to the fixed anchorages of nonstructural components according to the natural frequency change of the structure in the event of an earthquake. The test was conducted in the one-axis direction by applying the ICC-ES AC 156 RRS (PGA 100%) spectrum of Figure 2, described earlier in Section 2, as the input earthquake. In the case of the one-axis seismic simulation test, the same axis (X-axis) as used in the resonance search test was considered for the seismic load and direction. The experimental results confirmed that among the loads transferred to the anchors, the load measured at the LC-3 anchor was relatively larger than that of the other anchors, as shown in Table 8. It was determined that the load was concentrated in the corresponding area because strain occurred in the frame owing to the welding and joining during the process of fabricating the specimen. Therefore, LC-3 was excluded as an outlier, and the loads acting on the remaining anchors were averaged and compared with the numerical analysis results.
Comparison of the maximum anchorage load results between experiment and analysis respectively.

Summary of results
In the comparison of the test and numerical analysis results, the natural frequency was reasonably consistent. Therefore, the reliability of the test and numerical analysis was verified. It was confirmed that the transferred load of the fixed anchorage changed (increased) according to the change (increase) in the natural frequency when the earthquake ground motion was input. Based on this, it is confirmed that, as the stiffness of the structure increases, a larger load is transferred to the fixed anchorages.
Parametric study of anchorage load
As mentioned of Chapter 1, because it is difficult to conduct parameter experiments when considering various conditions owing to economic and spatial constraints, it considered an analytical approach to additionally analyze the characteristics of loads transferred to the anchorages of structures having various natural frequencies during an earthquake.
Additional modeling
In the FE modeling, seven structures having different stiffness were additionally modeled by joining the main body with steel frames in horizontal, vertical, and diagonal shapes based on the proven analytical model, that is, Case 1. When modeling, the nonlinear steel material model mentioned earlier in Section 3.2.1 was applied. Furthermore, for the input earthquake ground motion, the artificial earthquake of ICC-ES AC 156 (PGA 100%) applied to the experimental and analytical studies was utilized after conversion.
Comparing results and deriving correlations
Table 9 summarizes the results of a numerical analysis additionally conducted to determine the characteristics of the loads transferred to the anchorages according to the change in the natural frequency of the structure. A change in the stiffness of the structure according to the frame reinforcement could be observed, and through the additional analysis, it was revealed that the structure reinforced diagonally has a relatively superior stiffness than the structures reinforced horizontally and vertically.
Comparison results for natural frequency change according to frame addition of structures.

V/F, H/F, and Dia/F means vertical frame, horizontal frame, and diagonal frame.
In fact, to secure the torsional stiffness of the structure during the seismic reinforcement of the structure, members are often added in the diagonal directions of the cross-section of structure, and the analytical results prove the effectiveness of such a reinforcement method. Based on experiment Cases #1–#3 conducted earlier and the additionally conducted Cases #4–#10, the graph in Figure 8 was composed to illustrate the correlation between the change in natural frequency and the anchorage load. As the natural frequency changed owing to the increase in stiffness, the load transferred to the anchorage also increased, and a trend equation was used to derive a correlation.

Graph of correlation between natural frequency and anchorage load.
Conclusions
In this study, owing to the difficulties in conducting parameter experiments when considering various conditions based on economic and spatial constraints of actual electric cabinets, shaking table tests were conducted through a replacement with the test specimens consisting of steel frames and mass. For the anchorages where the most damage occurs in electric cabinet of the power plants when an actual earthquake occurs, it analyzed the load characteristics under an earthquake ground motion according to the change in the natural frequency of the structure and derived the following conclusions.
In order to investigate the dynamic characteristics and seismic performance of the anchorage that secures the structure during an earthquake, the natural frequency of the target structure was first confirmed through a shaking table test. The test results demonstrated that the natural frequency of the test specimen changed owing to the change in stiffness, following the addition of frames to the main body. Furthermore, the natural frequency f and the weight of test specimen were used to reverse calculate the value of stiffness k, thereby experimentally confirming the change (increase) in natural frequency according to the change (increase) in structural stiffness, which is theoretically known.
In the results of a shaking table test, the load applied to the anchorage showed an increasing trend as the natural frequency increased. Because the RRS of ICC-ES AC 156 has the maximum spectral acceleration within the range of 1.3–8.3 Hz, it was confirmed that, as the natural frequency approaches the maximum spectral acceleration range of the RRS, the dynamic load transferred to the anchorage increases.
It was inferred that the load size differs among LC1, LC2, LC3, and LC4 for the following reasons: (1) the precision at the bottom surface of the specimen when connected to the shaking table, (2) the precision of the load cell joints, and (3) the biased center of gravity of the upper load toward LC3.
The additionally conducted analytical study showed the change in structural stiffness according to the reinforcement positions. It was demonstrated that the diagonally reinforced structure has a relatively superior stiffness compared with the horizontally and vertically reinforced structures. However, because the earthquake ground motion was input on one-axis (X-axis) during the analysis, and the frames were added in the direction of the load progress, there is limitation in generalizing the behavioral characteristics of the structure as described above in the event of an actual earthquake. In the future, therefore, experimental and analytical studies should be conducted for three-axes, similar to real earthquakes, to additionally analyze the structural behavior characteristics and anchorage loads of nonstructural components.
This study demonstrated that the load transferred to the anchorages increases owing to the change in natural frequency caused by the increase in structural stiffness. Based on the analysis, a correlation equation between the natural frequency and the transferred load was derived. Because the types of cabinet that are actually operated on-site have various stiffness and shape, it is not easy to determine the load transferred to the anchorages for the case of an earthquake. Therefore, the correlation equation proposed in this study is expected to be used as a reference when applying a seismic design and reinforcements for actual electric cabinets.
Footnotes
Handling Editor: Chenhui Liang
Declaration of conflicting interests
The author(s) declared no potential conflicts of interest with respect to the research, authorship, and/or publication of this article.
Funding
The author(s) disclosed receipt of the following financial support for the research, authorship, and/or publication of this article: This present work was supported by Basic Science Research Program through the National Research Foundation of Korea(NRF) funded by the Ministry of Education (2021R1A6A1A03044326) and the power plant research program (22IFIP-B128598-06) funded by the Ministry of Land, Infrastructure, and Transport.