
Abstract
Launch missions of small satellites have been increasing in recent years. As the main payload, the camera plays a pivotal role in remote sensing detection. Therefore, on-orbit health estimation is a continuous concern for satellite design. This study aims to develop a dynamic intelligent health estimation algorithm for the on-orbit satellite camera. Based on fuzzy theory in the intelligent health estimation algorithm, the reliability and the remaining useful life are transformed into a newly defined health estimation index, namely “health vector,” which reflects camera health from the aspects of the electrical and mechanical parts. Compared with traditional methods, the new intelligent health estimation algorithm can not only judge the development direction of satellite camera’s health status, but also predict the degree of change. In addition, the proposed “health vector” is concise for engineers to monitor the health status of satellites in real time from the ground in multiple dimensions. In summary, this study provides a new method for on-orbit health management of satellite cameras.
Introduction
Nowadays, more mature technologies and lower manufacturing costs make satellite launching undergo an exponential growth. 1 Among the launched satellites, remote sensing satellites are playing a critical role in many fields. Remote sensing satellite imaging can be used in the study of urbanization, 2 environmental pollution monitoring, 3 species diversity protection,4,5 and atmospheric composition, 6 etc. Moreover, since satellite camera (SC) is the main payload on remote sensing satellites, its on-orbit health state has long been recognized as an essential part of satellites design. However, the dramatic temperature change, space debris 7 and the complicated radiations 8 will cause irreversible damages to SCs. 9 If in-orbit SCs fail, they cannot be repaired and thus the satellite must retire. As an important but high-cost product, scholars all over the world begin to focus on satellite reliability and risk research. 10
SC health estimation algorithm which is based on the reliability analysis of the SC, is an effective way to study the life and failure of the SC in the working process. However, the SCs contain many structures of different missions. The reliabilities and life of these structures will also affect the health state of the entire camera, which makes SC health state estimation complex. Thus, many factors need to be taken into consideration.
In literature, scholars have made contributions in reliability modeling for complex systems. Kaplan-Meier estimation is a common survival assessment method. Fox et al. 11 used Kaplan-Meier survivor function to estimate the space systems’ remaining lifetime from operating lifetime. In their research, the Weibull and exponential failure rate fitting functions were compared and the results proposed that Weibull function had better fitting effect. Similarly, Dubos and Castet et al.12,13 use K-M estimation to build nonparametric reliability models based on traditional reliability models and the extrapolation results of these models are close to the real data. Damircheli et al. 14 have developed a failure assessment logic model (FACM) model to study attitude subsystem component failure and satellite reliability with an inadequate supporting database. Liu et al. 15 have employed a multi-objective reliability optimization method to resolve the design of the compressor disk with multiple correlated failure modes, which method has also improved computational efficiency. A dynamic fuzzy reliability model put forward by Gao et al. 16 is used to analyze the dynamic reliability of multistate systems. Wu has proposed Petri net to accomplish the reliability apportionment of the solar array. 17 Zhao et al. 18 analyzed the failure characteristics of the satellite in his study. He thought that life characteristics of satellite could be divided into three categories: random life and degraded life and consumable life, and each life characteristics had a corresponding failure mode. This model is of great help to the study of satellite in-orbit failure analysis as the failure rates take the actual working conditions into account.
Although investigations mentioned above adopt new methods to improve the reliability model and solve their research questions well, it has not yet been determined how SC failure rates change during the whole life cycle. The questions also remain that how the failure rate of different components affects satellite health state and its remaining useful lifetime. Against this background, to develop an intelligent SC health estimation algorithm that can predict its remaining useful life based on the whole lifetime reliability model of the SC is indeed necessary.
Besides endeavors to improve the reliability calculation algorithm, many scholars have also contributed to the improvement of health estimation. Traditional health estimation algorithm is no longer suitable because the systems and functions of satellites have now become more complex. To put it more accurately, earlier prediction of healthy life span is urgently needed as the SC systems’ damage leave changes with the increase of on-orbit time 19 and the possibility in different health leave is also different. 20 For instance, to improve the capability of satellite to independently perform its on-orbit tasks, Suo et al. 21 have proposed a feasible soft decision-making framework. The authors propose the soft decision-making mechanism to execute the output based on a data-driven model called neighborhood decision-theoretic rough set model and T-S fuzzy theory. Yairi et al. 22 have also employed a data-driven health monitoring method which can learn the model parameter values from the training data and inform operators of the health status of satellite systems. Fang et al. 23 have brought a dynamic probability model under the time-varying condition to monitor aircraft structural health state. This model fully considers changeable the reliable damage monitoring and combined with the short term and long-term dynamic update of the models. Che et al. 24 have carried out the prognostic and health management (PHM) of aircraft with multiple deep learning algorithms. The requirements definition PHM model proposed by Li et al. 25 sheds new light on health prediction with a multitasking system.
For the remaining useful lifetime prediction, Bayesian network is a widely used model. At present, most scholars have developed life prediction models based on Bayesian networks. Huang et al. 26 given a Bayesian framework to predict the on-orbit remaining useful lifetime which was driven by big data. Using in-orbit failure data, Bayesian/Markov Chain Monte Carlo was proposed for satellite reliability modeling. 27 This model was proved having good performance when very limited in-orbit failures are observed. What’s more, Muthusamy and Kumar 28 proposed a health monitoring framework to predict remaining useful life of onboard satellites. In his research, a data-driven model was used to simulated fault and the general path model was applied to capture the prognosis of the system. The algorithm performed with 96.25% accuracy with certain data support. In addition, complex system analysis models based on Bayesian network was also established. Mi et al. 29 established an evidential network for the reliability analysis and evaluation of complex multi-state systems. This method which combined Dempster-Shafer evidence theory with the Bayesian network was proven having high computational efficiency. A compression inference algorithm based on multilevel Bayesian network was improved by Zheng et al. 30 His study said that its reliability analysis was more efficient than the Bayes Net Toolbox and the AgenaRisk software. Besides, Erlank and Bridges viewed the satellites as multicellular system architectures and used an extension of k-out-of-n system theory to predicting system reliability.31,32 This was an entirely new forecasting method with has some drawbacks.
However, it is worth mentioning that the question of how different components’ failure rates affect the SC health and the remaining useful life is still unresolved. Moreover, the dynamic estimation of SC’s health state in the whole life cycle is not clear.
Motivated by these unsolved problems, this study develops a new whole life cycle reliability model of the SC. This reliability model not only defines different fault modes of components, but also considers the periodic interference’s influence on the failure rates. To estimate health state dynamically and analyze the effects of different parts on satellite health, a fuzzy health estimation method is established in which SC fault can be judged and health state can be presented in terms of “health vector.”
The main contributions of this study are as follows:
A whole life cycle failure rate model is introduced to analyze the reliability variation during orbit of the SC. In this model, the failure rate of the SC is divided into base failure rate and instantaneous failure rate. The instantaneous failure rate is composed of many different frequencies of influence signals and it represents the real-time influences during the orbit time which previous studies seldom considered. This model can not only be used in the research of the SC, but also has a great space to be popularized in the reliability research.
A new SC intelligent health estimation method is proposed. TS-Fuzzy is applied in this method to analyze the health state by the current reliability and used life. Health state and predicted life of the SC can be given by this method. A health estimation index, namely “health vector” is first proposed which is concise for engineers to monitor the health status of the SC in real time. The method presented in this work should prove useful to the space industry for example in the reliability designs and on-orbit health studies.
The structure this paper is as follows. Section 2 briefly introduces the camera’s subsystem structure and the reliability model and illustrates the health estimation process. Section 3 demonstrates the mathematical model of reliability and the intelligent assessment method of camera health in detail. Based on these models, the results of reliability calculation and health estimation are analyzed in Section 4. Section 5 concludes and discusses the study.
Structure and algorithm flow of the SC
SC structures and reliability relationship
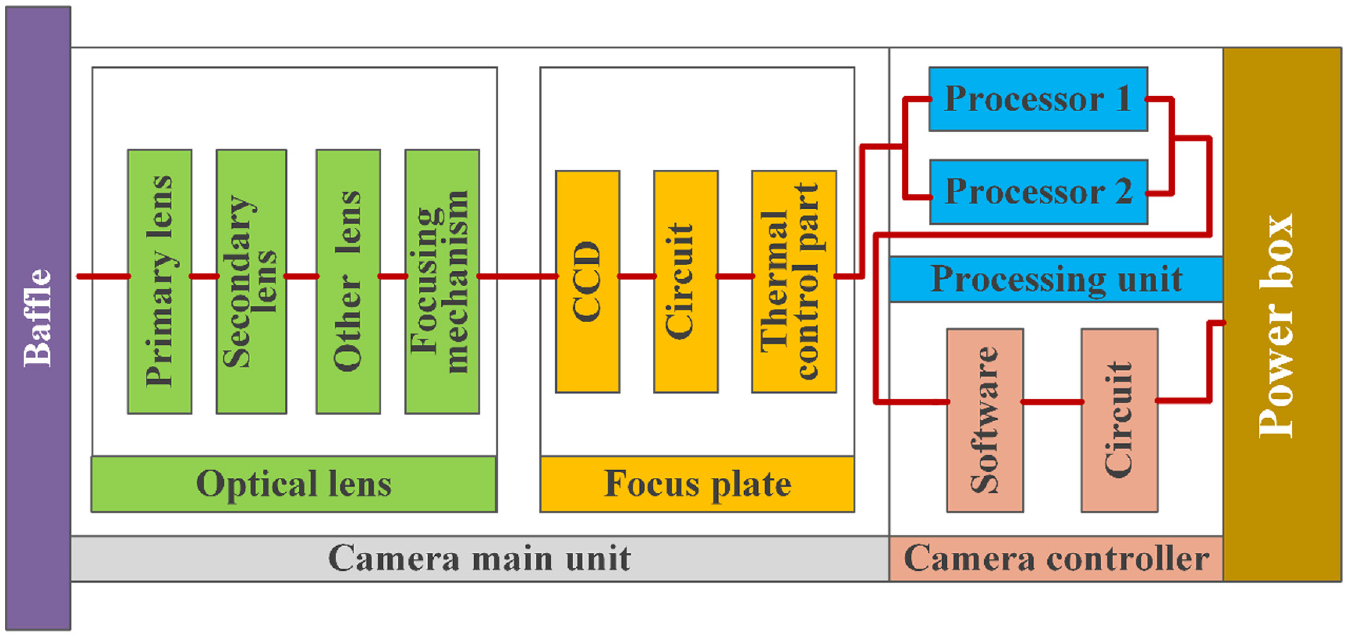
The SC needs to be divided into several parts to simplify the evaluation process. Figure 1 shows the split-up of a satellite camera into four major parts based on different missions:
SC main part
Camera controller
Image processor
Power box

The sketch map of satellite camera (SC).
It is worth mentioning that the four parts are not completely isolated parts. SC adopts push broom imaging modes by focusing the reflected light of the ground scene on the focus plane through the optical lens. After the photoelectric conversion, the processed electrical signal in the processing part transmits to the ground through the data transmission subsystem. Moreover, the camera controller governs (1) power distribution, (2) communication with thermal control part, (3) focusing control, and (4) telemetry data acquisition. The power box supplies power for the SC. The health status of each component will affect the on-orbit works of the SC. According to the classification, it is more convenient to observe the reliability changes and potential failure forms of different parts.
The satellite camera reliability relationship is presented in Figure 2. The failure of any component will cause the SC break down. More details about the connections are in Section 3.1.2.
Reliability relationship diagram of SC.
The SC health estimation algorithm
Figure 3 displays the process flow of the SC health state estimation method, which is divided into two stages: subsystem reliability modeling and health status estimation. In the first stage, a reliability model is established after studying the structure of the subsystem to analyze how reliabilities change during satellite on-mission time. Besides, to describe the failure rate change of SC, the whole life cycle failure model is carried out. This model is used to dynamically simulate the instantaneous failure rate of SC in the universe.

Flow chart of subsystem reliability and health analysis.
The second stage, namely the health state estimation, has two main proposes, that is, fault prognosis and health management. After obtaining the reliability information of the SC from stage one, stage two focuses on the judgment of the SC health. A virtual SC in orbit that can generate a “true health state” is carried out. Through a failure diagnosis and fuzzy dynamic assessment, the health state information of the subsystem and the components which may lead to camera failure are obtained. Moreover, the health results are referred to as the “health vector,” which is designed to simplify the estimation criteria.
SC reliability and health state modeling
Mathematic model of SC reliabilities
Figure 4 shows an exponential curve for the reliability variation of SC, which is divided into three parts, namely, Part A, B, and C:
Area of Part A is caused by the steady deterioration of SC and is defined as the unavailable life loss
Area of Part B is referred to as the integral average life
Area of Part C stands for the predicted life
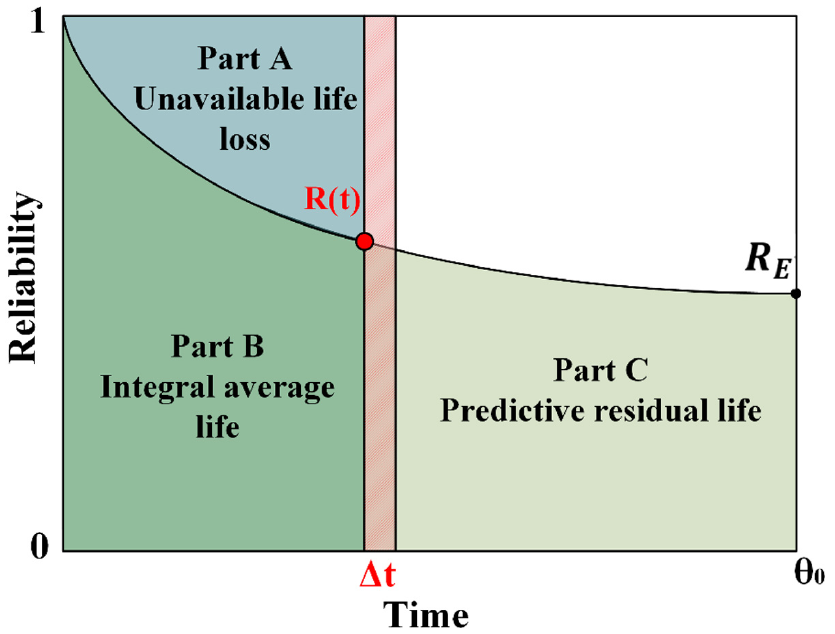
SC’s reliability curve and life divisions. (Part (A) Unavailable life loss; Part (B) Integral average life; and Part (C): Predicted residual life).
The three reliability characteristics defined in Figure 4 are critical for the analysis afterward.
As shown in Figure 4, the unavailable life loss

where

To obtain the predicted life
(1) The area of Part C represents the predicted life
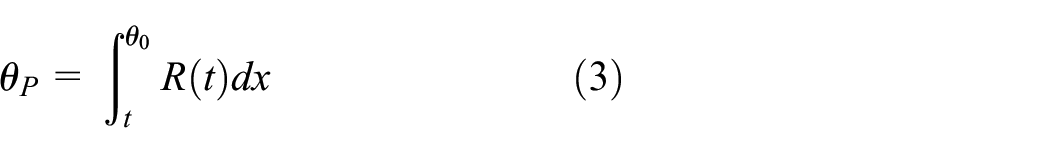
where

where
(2) The second method assumes that the reliability of SC will be constant.
If the reliability of SC (shown in equation (5)) does not change after time t, the change rate of reliability


where

when
Then


The predicted lifetimes
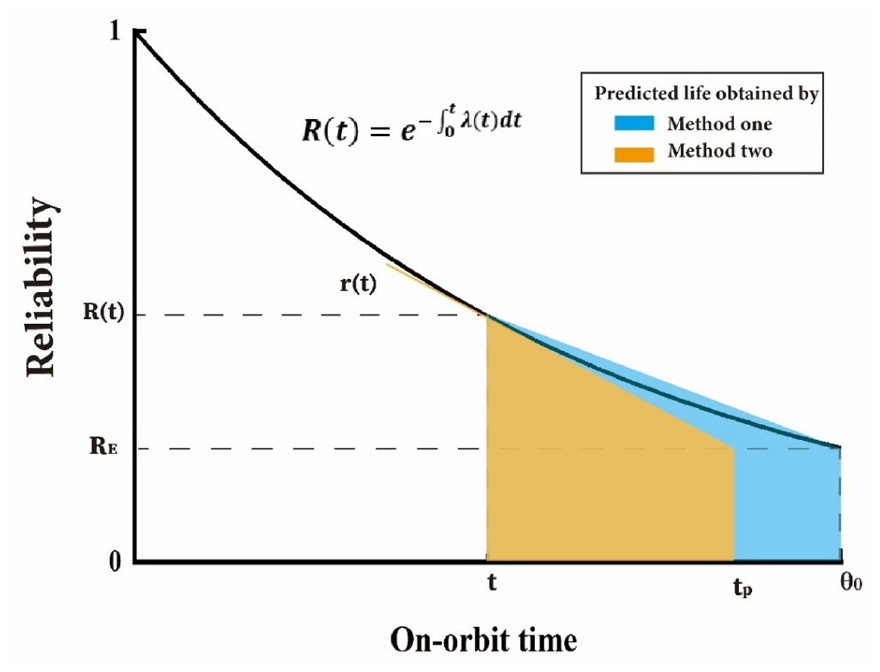
The comparison of the predicted life obtained by two different methods.
The failure rate of the on-orbit SC is variable. On the one hand, factors such as temperature, illumination, high-speed charged particles and unknown microwave irradiation usually change in space and do not follow a fixed rule. On the other hand, since the distinct working conditions, the failure behaviors of different parts of the SC vary. Therefore, the SC reliability throughout the whole life cycle needs to be analyzed in depth.
Taking the uncertain factors and effects into account, the instant failure rate of the SC is expressed in equation (9)

There are two parts in the instant failure rate function:
The failure model expression is in the form of a Fourier series because effecting signals are changing with time. This function is obtained to simulate the transient failure rates of the SC components in different working environments, thereby enabling an analysis of the reliability at different operating states of the satellite over its whole life cycle. Given that the SC may perform various missions, the base failure rates are in three forms:
(1)
The base failure rate of the subsystem is constant, indicating that the failure rate of the part is unchanged over time. Such components often consist of long lifetime structures such as supports and bearings whose lifetime is even beyond the life cycle of the SC. Such instant failure rate formulas can be applied to the mechanical structure of the SC.
(2)
However, for most parts of satellites, their base failure rates change with time. Recall that a Weibull probability density function is in equation (10):

where

where
3)
The exponential probability density function, as a base failure function, can be used to predict components’ life distributions, especially electronic devices. The exponential probability density function is used to describe system failure conditions and to express MTBF distribution of complicated systems. For example, the sampling scheme of semiconductor devices adopts the exponential distribution in Japanese industrial standards and American military standards. However, exponential probability density has “no memory,” which means that the rest working life will not be influenced after being employed for a period of time. The system life distribution is still equal to its initial value after long-time working. The SC life is completely inconsistent during the satellite working in space.
To make up for this “no memory” defect, a correction parameter

where
Where the improved design life
The SC intelligent health estimation method
Preparation for health estimation
A health state assessment strategy is recommended based on the reliability calculating functions provided in the previous subsection. It is aimed to simulate the working condition’s satellite camera subsystem and to dynamically estimate the SC’s health state. With this strategy, a “health vector” is obtained. This vector informs the health status of the mechanical and the electrical part and shows the part of the SC subsystem that undergoes a potential failure. The first step is to initialize the parameters before the SC health state estimation is carried out.
In the health state estimation stage, a dynamical vector is designed, namely “health vector”
The subsystem reliability is 1 while life loss is 0;
“Health vector”
Each part’s fault parameters
After initialization, the SC starts its on-orbit mission, and the reliability begins to change as the task goes on. To obtain the “health vector,” the health management strategy is divided into five steps as explained in detail below.
Fault diagnosis of the SC
The first step in health management is fault diagnosis. Figure 6 displays the flowchart of fault diagnosis. In this process,
for the electrical part,
for the camera,

Flowchart of fault diagnosis.
The estimation for the mechanical part is the same. Both the electrical and mechanical part can make the camera fail but engineers can detect the failure part from
Fuzzy health estimation processes of the SC
After the fault diagnosis, a health estimation will be carried out which contains four steps. This estimation mainly discusses the mechanical and electrical parts’ evolution direction and extent. Take the electrical part as an example.
After a fault diagnosis of the electrical part,
Step 1: To simplify the calculating parameters and to translate the data into a clearer version so that engineers can easily understand. Reliability
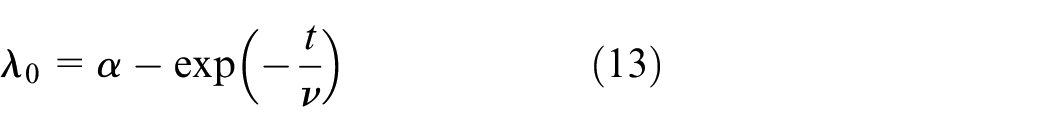
Step 2: To obtain the linguistics values of the possible probability of evolution direction (PPD) and the maximum possible evolution extent (MPE) of the electrical part based on fuzzy rules. The accurate values including the possible probability of positive (negative) health evolution
Step 3: To determine if the electrical part truly change in the positive (negative) direction,
Step 4: To calculate

Flowchart of four steps in calculating
Health factors inform us the health state of different parts of the camera. Health vectors consisting of health factors display the SC health state. The health state estimation stage can provide information on which part of the SC will wear out during the task and how different faults affect camera function and camera lifetime. Next, estimation steps and the parameter design will be introduced in detail.
It is acknowledged in academia that one advantage of the fuzzy strategy is that fuzzy control is a kind of rule-based strategy which directly adopts linguistic rules rather than relying on an accurate mathematical model. In fact, this estimation is not a completely fuzzy process, although some principles of fuzzy strategy are applied in the judgment.
The reliability
IF
where the subscripts

Fuzzy sets and membership degree function.
Fuzzy decision rules of
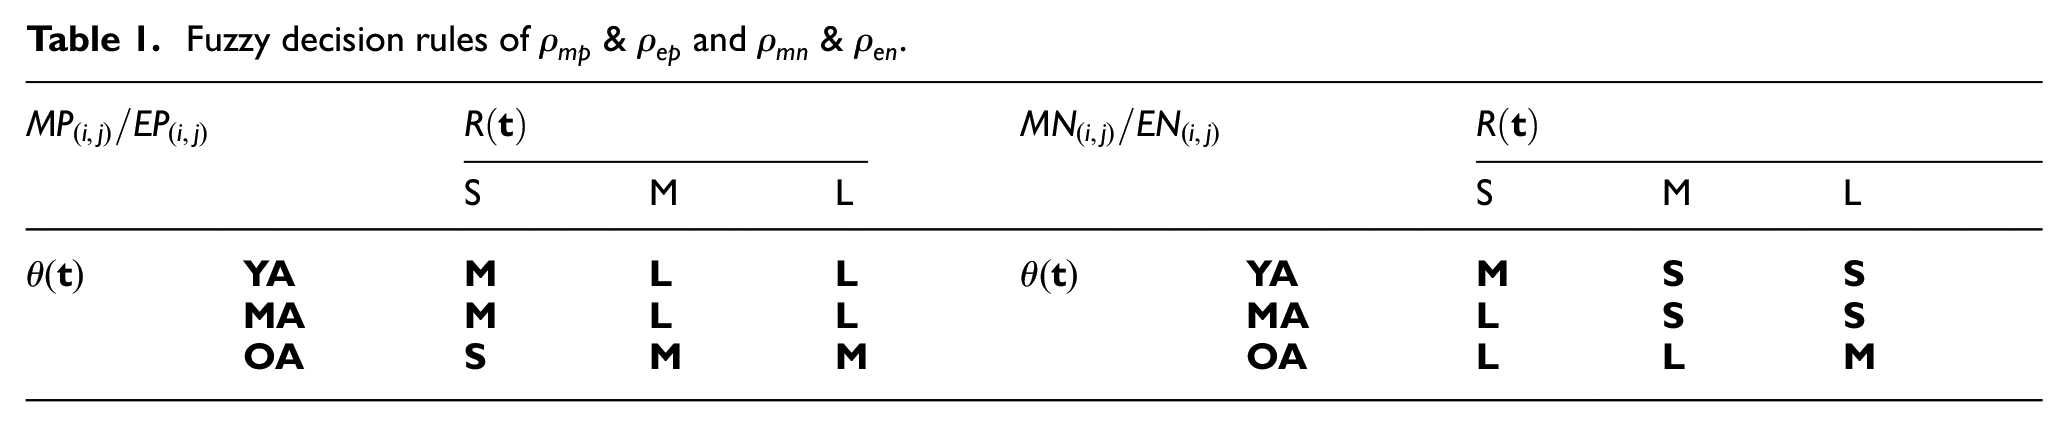
After obtaining the PPD, the maximum possible evolution extent (MPE)
IF
where the subscripts

The whole life cycle failure rate input in three different period.
Fuzzy decision rules of

The parameters illustrated above only indicate the “probable” changes which are defined by the real-time
Then, the evolution taking place in the mechanical part and the electrical part can be inferred. When
The health vector


where
Results and discussions
In the previous section, the methods to calculate the SC reliability and estimate camera health state are established. In this section, different whole-life cycle modes are carried out to explore the effect of different models on SC’s remaining useful life and reliability. In the end, the SC health state is estimated.
The whole life cycle analysis of the SC
In this function, the base failure rate has three forms and the instantaneous failure rate is in a Fourier series form. Considering different impacts that the SC undergoes, the instantaneous failure rate is divided into three periods as shown in Table 3.
Different instantaneous failure rate cycle of the whole life cycle failure model.
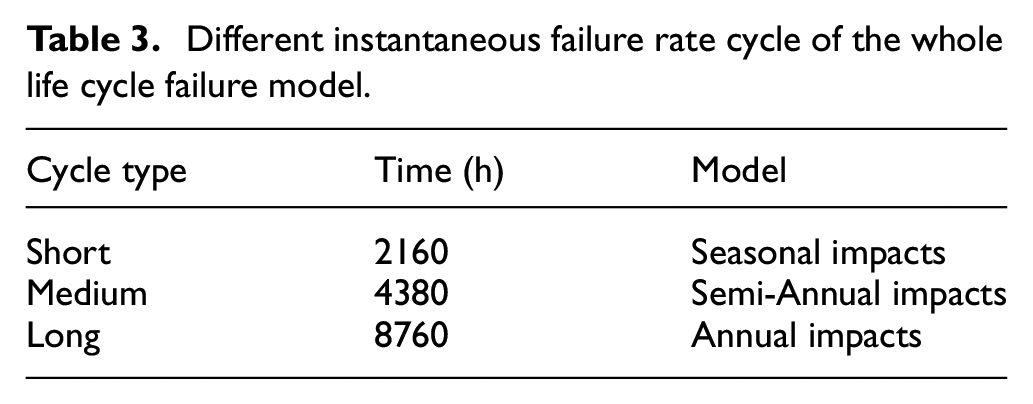
The designed life of a SC is usually 5–10 years (43,800–87,600 h). A short cycle, a medium cycle and a long cycle are divided to simulate the seasonal, semi-annual, and annual impacts that a SC undergoes. For example, in the case of earth revolution around the sun, since sunlight condition is different between perihelion and aphelion, this impact changes semi-annually. Impact cycles shorter than 2160 h are not considered in this study. For one reason, a shorter cycle makes the reliability and the life change curve more crowded. For another, the failure rate trend is consistent between “2160 h” cycle and a “shorter” cycle. In the following, different base failure rates and different instantaneous failure rate proportions will be compared and tested to observe the reliability change of the SC.
Different cycle proportion
Taking the influences of different instantaneous failure rates proportion into consideration, three types of different the whole life cycle failure models are designed to analyze the change of the SC reliability and remaining useful lifetime. The designed corresponding input instantaneous failure rate proportions are listed in Table 4. The SC’s designed lifetime

Input of the whole life cycle models of the SC.

The reason for choosing these input waves is to better observe the influence of different cycle composition on reliability in the simulation process.
Figure 10 presents the SC reliability and remaining useful lifetime. For subsystem reliability, the SC reliability decreases and the speed slows down as the service extends. Three reliabilities decline from the initial value 1 to 0.1 after 3 years. The general trend is independent of the instantaneous failure rate. According to the fluctuation of the curve in Figure 10(a), type 1 reliability has the highest wave frequency among these three instantaneous failure rates while type 3 has the lowest frequency. This means that different instantaneous failure rates affect reliability change frequency. The instantaneous failure rate will lead to the periodic change of camera reliability. The larger the proportion of short period in the input instantaneous failure rate, the smaller the fluctuation period of the SC reliability will be.

Results of the SC reliability parameter change based on three input models.
As regards the remaining useful lifetime, dramatic changes can be observed among the three curves. In Figure 10(b), the remaining useful lifetime of the SC changes from the same initial value (around 4 years) while the change cycles and ranges are different during the working process of the camera. In the beginning, input failure increases and the remaining useful lifetime decrease until the failure rate reaches an extreme. When the failure rate declines, the camera remaining useful lifetime raises and peaks in one cycle. From Figures 8 and 10(b), there is a strong relationship between failure rate and subsystem remaining useful lifetime. Different proportions of instantaneous failure rates lead to different change frequencies and the short period signal is the dominant factor. Moreover, according to different smallest failure rate inputs, the remaining useful lifetimes in Figure 10(b) have different crest values. The crest values also decrease when the camera’s working continues.
Different base failure rate
Since different parts have different working conditions, it is also worthwhile to study the influences of different base failure rates. The three basic failure rates introduced in Section 3.1.1 are selected to compare the influence of different basic failure rates on the SC reliability. Parameters in each model are presented in Table 5 and the whole life cycle failure models are shown in Figure 11. Overall, the constant function and the exponential function display a similar trend. However, the Weibull Function failure rate rises from 0, crosses the other two curves after around 1 year, and stays relatively stable to the end.
Input of the whole life cycle models of SC.


The whole life cycle failure model with three different base failure rates.
The SC subsystem reliabilities provided in Figure 12(a) demonstrate three types of trends, namely the Weibull trend, the constant trend and the exponential trend. Curves whose base failure rates are in constant and exponential forms decline faster than the Weibull trend. The reason is that the Weibull failure rate is much smaller than others at the beginning. At the end of the simulation, though the trends are close, the reliability of the Weibull function (at 0.3) is higher than others (near 0.1). As regards the constant and exponential trend, different base failure rates affect the slope of reliability curve. The reliability of the constant failure rate changes more slowly than that of the exponential failure rate.

Results of the SC reliability parameter change based on three different base failure rate functions.
Figure 12(b) shows the remaining useful life of the SC. The Weibull function’s base failure rate of camera remaining useful lifetime undergoes a sharp decline from 10 years at the beginning. This is because the camera’s remaining useful lifetime is determined by the minimum remaining useful life of the components. The minimum lifetime is the design lifetime, namely 10 years, when reliability is 0. In the middle of the on-orbit time, the remaining useful lifetime decreases to 4.5 years. The remaining useful lifetimes of constant base failure rate and exponential base failure rate change slowly, undergoing a slight decline from the initial 4 years to around 3.5 years during the three on-orbit years. The comparative results show that the parameters in the base failure rate function significantly influence the change of the trend.
Camera health estimation and management
In this subsection, the camera health estimation is simulated and the results of the SC health state will be discussed. Weibull reliability whole lifetime model is chosen and the input signal curve is presented in Figure 13.

Input signal of satellite failure rate.
Before simulating the dynamic health model of the SC, some assumptions about working conditions have to be mentioned:
As the five parts of the SC have different missions, optical lens such as the mechanical part and focus plane, processing part, camera controller, and power box are defined as an electrical part;
For each part, fault simulation carries out once a month.
In fault diagnosis, reliabilities


When
The fault results in Figure 14 point out that this SC retires at 3.53 years due to a breakdown of the electrical part. When the SC is in its youth age, both

Comparison of generated reliability and simulation reliability for electrical part and mechanical part.
Health factors

Simulated results of health factors during the whole life cycle.
Conclusions
In this study, we carry out two models of the SC health management. The first one is the whole life cycle failure model which combines camera base failure rate and the instantaneous failure by taking the periodic disturbance into consideration. The other one is the SC health estimation model which is based on fuzzy rule design and a health vector. Numerical values are also provided in this model.
Numerical simulations have been conducted to analyze the estimation results of the SC. Different whole life cycle failure models have been applied to the SC and the results show that:
instantaneous failure rate cycle can influence subsystem reliability and remaining useful lifetime change cycle;
different base failure rates lead to great differences in the remaining useful life of subsystems;
The SC health state estimation results show that electrical failure leads to the retirement of the SC after 3.52 years on orbit. The health factor of the electrical part changes from 1 to 0.2 while the mechanical health factor only declines to 0.4 in 3.52 years, which also reflects the health state of the SC.
Compared with traditional reliability calculation, the whole life failure model brought up in this research concerns the instantaneous failure rate. The instantaneous failure rate represents the real-time influences during the orbit time which previous studies seldom considered. And the SC intelligent health estimation method is a new strategy in space reliability and health analysis. It provides a new way in health estimating. However, the fuzzy rules in this method need more accurate theoretical analysis and data support.
In the future, the reliability and the SC health assessment joint model in this study can support the reliability design of satellites under extreme conditions and online health management research. Given the recent boom in deep space exploration, this joint model can also contribute to the study of the extended service of future space vehicles and the extension of satellite life.
Footnotes
Appendix
Handling Editor: Chenhui Liang
Declaration of conflicting interests
The author(s) declared no potential conflicts of interest with respect to the research, authorship, and/or publication of this article.
Funding
The author(s) disclosed receipt of the following financial support for the research, authorship, and/or publication of this article: This study gratefully acknowledges the financial support from Beijing Institute of Spacecraft System Engineering (grant number KH52-3476-01).