
Abstract
Aiming at the contact strength reliability of variable hyperbolic circular arc gear, a reliability analysis method for contact strength of variable hyperbolic circular arc gear based on Kriging model and advanced first-order and second-moment algorithm is proposed. Kriging model was used to establish the limit state equation of the contact stress reliability analysis of variable hyperbolic circular arc gear, and the advanced first-order second-moment method was used to analyze the contact stress reliability of variable hyperbolic circular arc gear based on the limit state equation of the contact stress. In order to verify the effectiveness of the proposed algorithm, a Markov Chain Monte Carlo reliability analysis method based on Important Sampling was proposed. Markov Chain and Important Sampling were exploited to improve the accuracy of contact reliability analysis based on Monte Carlo method for variable hyperbolic circular arc gear. The comparison between the analysis results of Markov Chain Monte Carlo with Important Sampling method and first order second moment shows that it is feasible to analyze the reliability of variable hyperbolic circular arc gear by first-order second-moment method.
Keywords
Introduction
Gear is the most commonly used power transmission and motion transmission device. Installation error, manufacturing error, external load and other factors are random, which will lead to gear vibration, noise and pitting failure. These random factors seriously affect the reliability of gear meshing transmission. 1 When study the reliability analysis of gear transmission, due to the limitations of human, material and financial factors, it is difficult to carry out real reliability test to obtain a large amount of useful data. Therefore, virtual simulation with sampling method has become one of the commonly used tools for reliability analysis instead of real response. 1 At the same time, the surrogate model method can effectively reduce expensively time-consuming in virtual simulation. 2 Kriging, response surface, RBF and so forth have been widely used analytical methods.3–5 Tong et al. used response surface and Markov Chain Monte Carlo (MCMC) to study the influence of random factors such as installation error, manufacturing error and external load on the reliability of gear transmission. 1 Yu et al. 6 established the reliability analysis model of gear thermal transfer error based on PC-Kriging model and active learning function, through which the reliability of gear transfer error was effectively investigated. Liu et al. 7 proposed a corrected-partial least squares regression to study the dynamic reliability analysis of a gear transmission system (GTS) of wind turbine (WT). Hu et al. 8 combined Response Surface Methodology (RSM) and first-order second-moment method (FOSM) analysis methods to study the effects of elastohydrodynamic lubrication (EHL) on contact fatigue reliability of spur gear. Bai et al. 9 proposed a MDCRSA method based on the response surface methodology and Monte Carlo to study the reliability analysis of the gear transmission errors of the steering mechanism of the gun (GTESMG). Yin et al. 10 set up the reliability limit state equation of the retraction system by busing a quadratic polynomial that has no cross terms and discussed how the key parameters affect the reliability of the retraction system. Zhang et al. 11 derived a quadratic polynomial function by using the response surface method to describe the quantitative relationship between the tooth modification parameters and the dynamic transmission error fluctuations of helical planetary gear pair. He has established a quantitative relationship between the tooth modification parameters and the transmission error fluctuations, and carried out a reliability sensitivity analysis to demonstrate the effects of the tooth modification parameters on the dynamic transmission error fluctuations of the based on the quantitative relationship. 11 Liang et al. 12 proposed contact stress reliability limit state equation by using full quadratic RSM to study the effects of size parameters on reliability of the main reduction gears in a car. Zhang et al. 13 used Kriging model to simplify the calculated stress-strength reliability mathematics of gear transmission and employed genetic algorithm to globally optimize the volume and reliability of large ball mill gear transmission. Zhou et al. 14 used the adaptive Kriging model to study the vibration reliability and sensitivity of retraction-extension system under the condition of single failure and multiple failure modes. Yang and Tong 15 proposed reliability analysis method based on dimensionality reduction visualization and Kriging model to solve the problems of large computation and low precision during gear vibration reliability analysis. Cui et al. 16 used the Kriging method to simplify the reliability calculation model established on the basis of stress-strength interference theory. Zhang et al. 17 used the Kriging metamodel to build the approximate the real limit state function of the landing gear shock absorber to analyze the reliability of the multi-mode sensitivity analysis method of the shock absorber.
Variable hyperbolic circular arc gear (VHCAG) is a new type of gear transmission, which, theoretically, has the characteristics of high contact rate, high bearing capacity, no-axial force, high transmission efficiency, low noise, and so forth. 18
At present, there is no study on the contact strength reliability for the variable hyperbolic circular arc gear. This paper proposes a method for calculating the contact strength reliability of variable hyperbolic circular arc gear based on Kriging model and first-order second-moment. In the proposed method, the limit state equation of contact strength for reliability analysis of variable hyperbolic circular arc gear is established by using the Kriging model, and the first-order second-moment. The proposed reliability analysis method was used to analyze the contact strength reliability of variable hyperbolic circular arc gear based on the established limit state equation of contact strength.
Mathematical model and contact stress finite element model of circular arc gear
Cylindrical gear with arc tooth transmission device, shown in Figure 1, which is a new type of gear transmission has the advantages of good meshing performance, high coincidence, no axial force, stable transmission, and so on.

Cylindrical gear with arc tooth.
Mathematical model
According to its forming principle, the coordinate system of forming principle of circular arc tooth line cylindrical gear is shown in Figure 2.18,19

Coordinate system of forming principle of cylindrical gear with arc tooth, R: dividing circle radius of gear; RT: cutter head radius of machining tool; Rn: inner edge radius in the tangent direction of dividing circle; Rw: outer edge radius in the tangent direction of dividing circle; Rw = RT+πm/4; m: gear module; a: pressure angle; ω: cutter head rotation angle speed of machining tool; VT: cutter head moving speed of machining tool.
In Figure 1, S(O—XYZ) is the static coordinate system, S1(O1—X1Y1Z1) is the solidification coordinate of the gear blank, and ST(OT—XTYTZT) is the tool coordinate, which moves relative to S(O—XYZ) coordinate at the speed of VT = R×ω.
Unit normal vector of tool surface
The tool surface equation is:

Where, q is the distance from the tool to the X axis of the reference frame along the bus direction
While the unit normal vector of the tool surface is:

Relative speed of tool and gear at meshing point
The direction vector can be expressed as:

Therefore, the relative speed of the tool and the gear at the meshing point is:

Meshing function
Based on the meshing principle, the meshing function is expressed as follows:

As ω1≠0, it can be concluded from the above formula that:

Conjugate surfaces
The contact line equation between the tool and the gear to be machined is as follows:

By converting the coordinates in ST (OT—XTYTZT) to S1(O1—X1Y1Z1), the tooth surface equation of the cut gear can be obtained as follows:

Instantaneous contact line
Meshing function

Tooth profile equation
In the axial middle section of the gear, from its extended coordinate system, it can be seen that b = 0, then

According to equation (10), it can be seen that the tooth profile of the axial symmetry surface of the gear is in involute.
Similarly, on the axial asymmetric plane, considering that z1 = b, according to the expressions of Z1 and q in equation (8), we can get:

Thus, the expression of the tooth profile of the non intermediate section can be obtained as follows:

Contact stress finite element model
The point cloud data of gear 3D model was calculated by numerical solution method based on the mathematical model of gear meshing principle established in sections 2.1, and precise gear 3D model was established by UG. The finite element analysis model of gear is established based on the 3D model. Contact stress finite element model of Variable Hyperbolic Circular Arc Gear is shown in Figure 3.
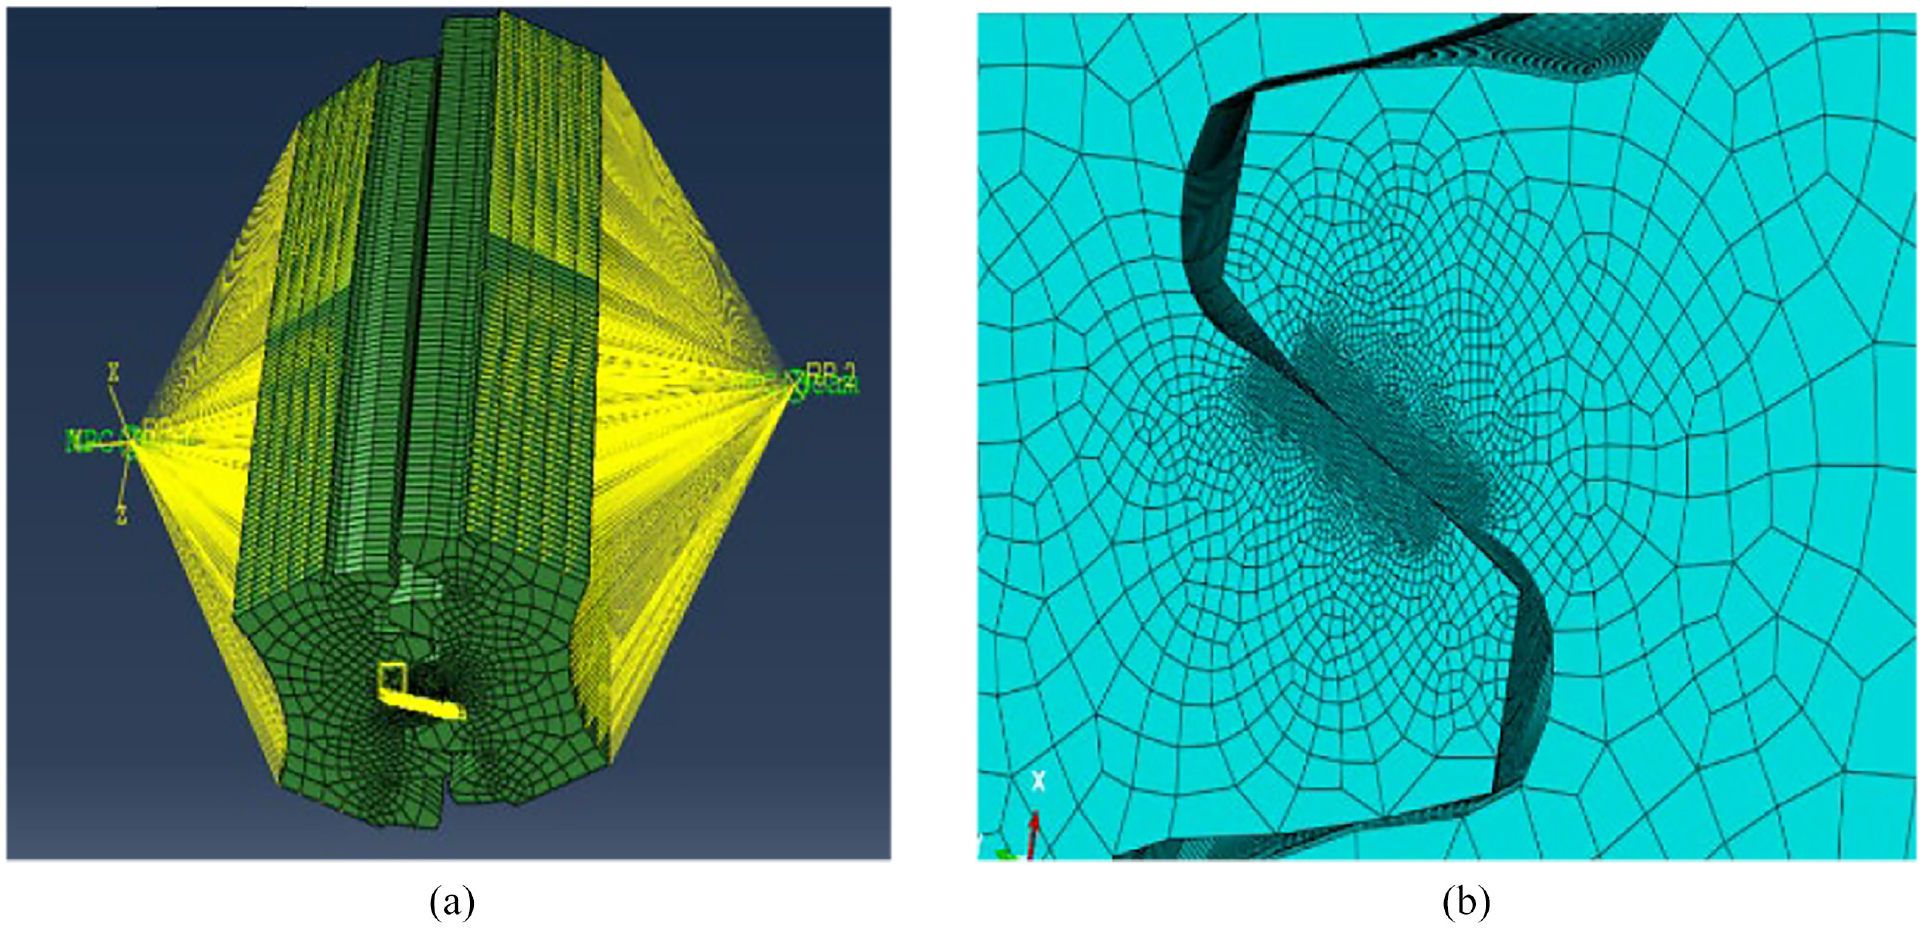
Contact stress finite element model of variable hyperbolic circular arc gear: (a) constraint and (b) mesh.
Set contact type of finite element analysis of circular arc tooth line gear pair as “friction free.” The MPC (multi-point constraint) is established by the rotating center of the active and the driven. At the same time, MPC is added to the driving wheel: the direction of its rotation axis is set as free, and other rotation and translation are set as fixed. For the driven wheel, MPC is fixed and omnidirectional fixed. The method of sweeping is used to divide the mesh of gear pair, while the type of mesh is C3D8I. The mesh of gear tooth contact area is subdivided locally to improve the analysis accuracy of contact stress and reduce the calculation time. The calculated stress pattern of driving wheel and driven wheel is shown in Figure 4. The Figure 4(a) shows the dynamic contact stress diagram of driving wheel, and the Figure 4(b) shows the contact stress diagram of driving wheel. As can be seen from Figure 4, the values of contact stress of driven wheel and driving wheel are (a) and (b) respectively, which are basically the same, and the contact form is point contact, which is consistent with the characteristics of gear.
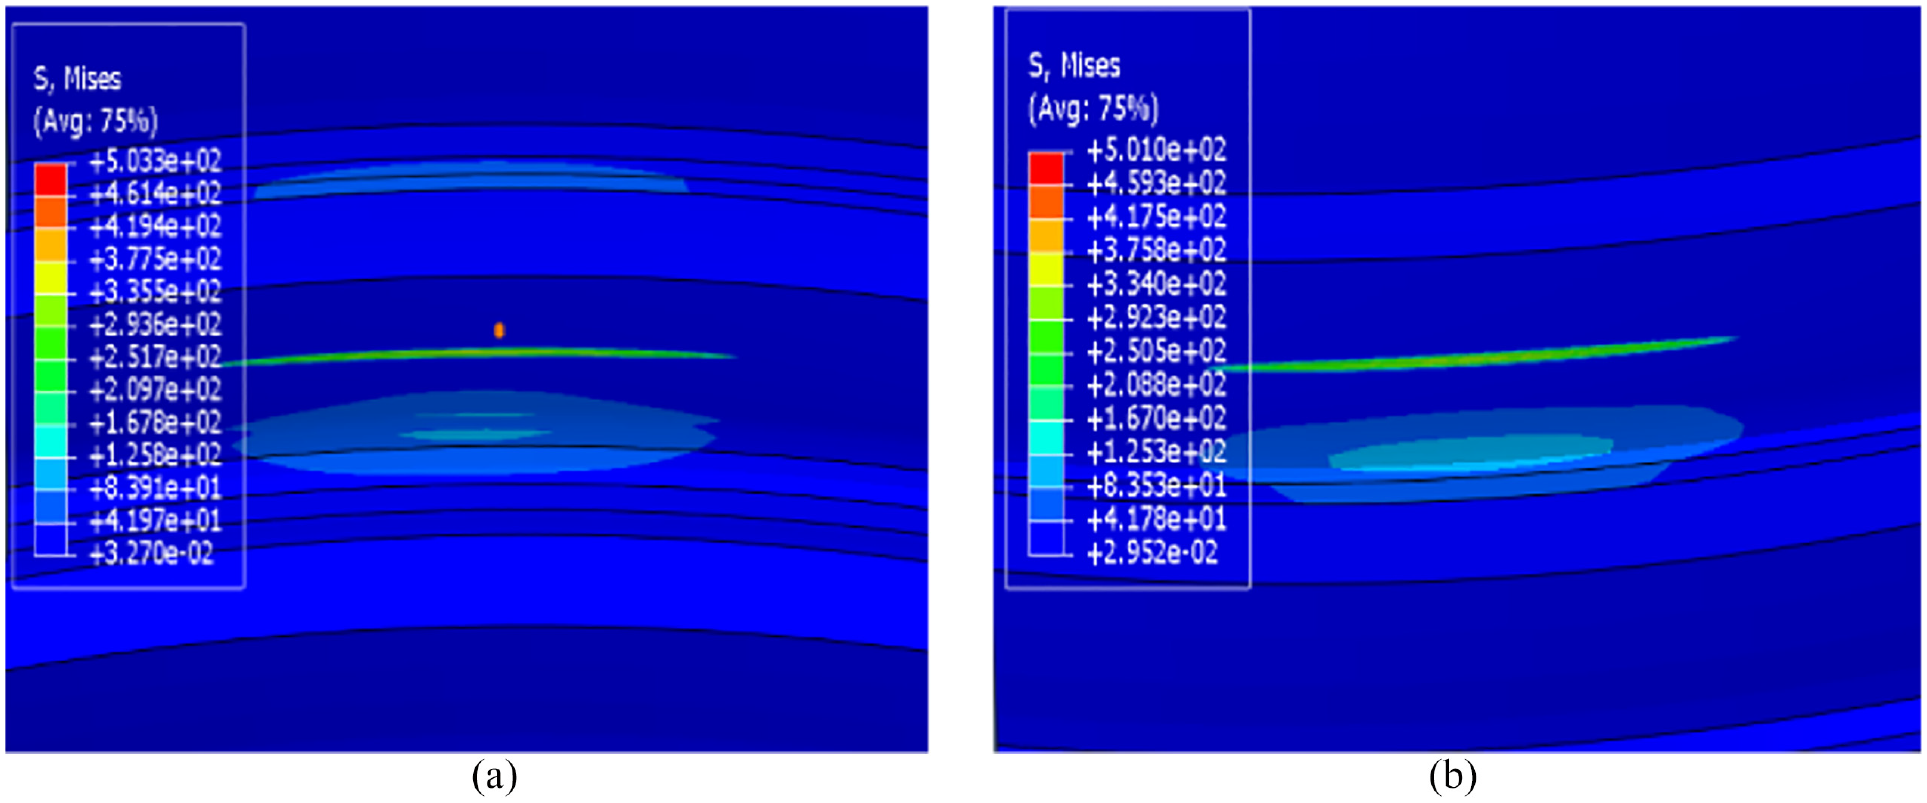
Stress pattern analysis of driving wheel and driven wheel: (a) driving wheel and (b) driven wheel.
Limit state equation of contact stress of circular arc gear
Stress-strength interference model
Figure 5 shows the stress-strength interference model. The safety margin determined by conventional design methods in parts will attenuates, while the safety margin becomes smaller. The strength and stress distribution function varied from interval to crossover, and the crossover region is the unsafe region (width is

according to the definition of reliability, the reliability is:


Stress-strength interference model.
Figure 6 shows the calculation of part strength over stress in the interference region. According to the joint integration method of probability density function, the probability in the interference region is:

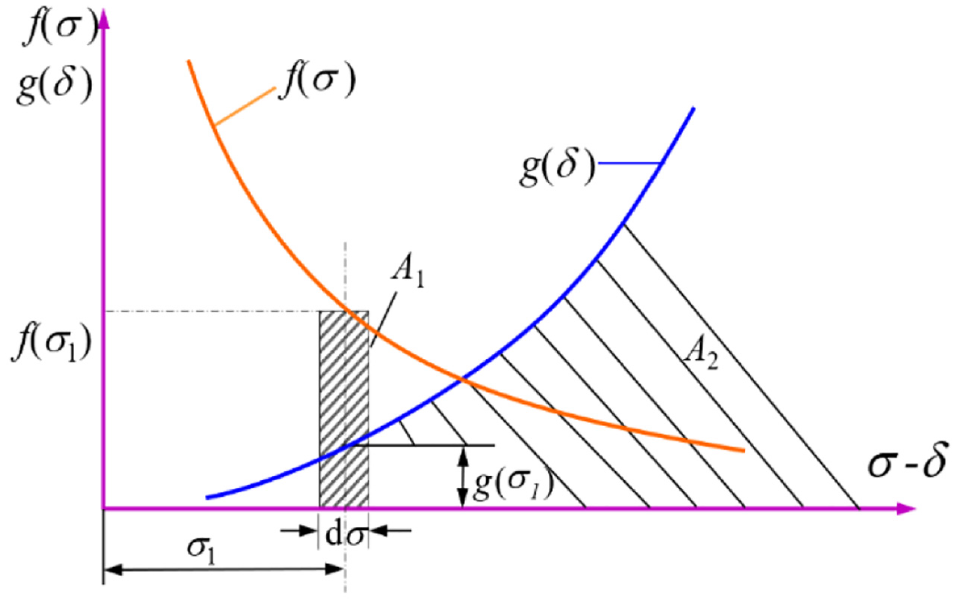
Schematic diagram of reliability calculation in interference region.
Limit state equation
Tooth Width (
Accuracy Indexes of surrogate model.

After comprehensive analysis of R2, RMSE and RMAE, Kriging method has higher accuracy, so Kriging was selected as the method to establish the limit state equation of gear contact strength. In order to further improve its accuracy, an AQPSO-Kriging surrogate model was proposed in Ma et al. 18 The proposed AQPSO-Kriging surrogate model was used to calculate the gear contact stress. However, the AQPSO-Kriging surrogate model cannot directly provide the explicit expression of the established approximate model function between input and output. 19 In this paper, Isight and Matlab are used to jointly simulate and construct the binomial expression of the gear contact stress state equation. According to equation (13), it is obtained

Gear selection material is

Reliability analysis principle based on improved the first-order second-moment method (AFOSM)
Let the function of the structure be

According to literature, (18) can be rewritten as follows:


The exact solution of reliability index


The reliability calculation process of the AFOSM algorithm is shown in the Figure 7.

Process of solving reliability by AFOSM algorithm.
Reliability analysis principle based on Markov Chain Monte Carlo
Monte Carlo
Suppose

Where,
The
Flow chart of reliability analysis using Monte Carlo method is shown in Figure 8. The whole process mainly includes the following three steps.
Step 1. According to the distribution types and parameters of random variables, N groups of samples
Step 2. Substituting each group of samples
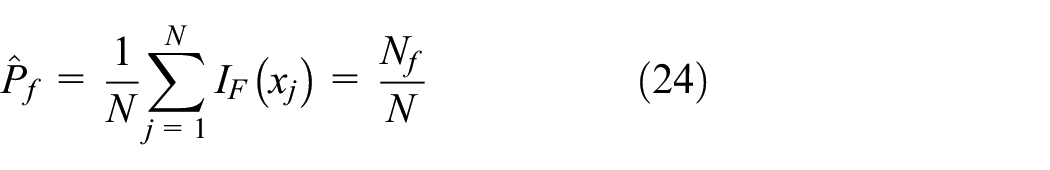
Step 3. Estimating failure probability

Flow chart of reliability analysis using Monte Carlo method.
Markov Chain Monte Carlo with important samples
Important sampling
In order to improve the accuracy of reliability calculation using Monte Carlo method and make the sample points more likely to fall into the failure domain as much as possible, importance sampling is adopted in this paper. The important sampling method makes the sample points more likely to fall into the failure domain by changing the center of random sampling, and reduces the number of simulations appropriately to ensure the accuracy and efficiency of the algorithm. Sample sampling is simulated based on Metropolis-Hastings criterion. The sample points extracted are more likely to fall into the failure domain or the so-called important region, which improves the solution accuracy. From the above, the formula (25) is obtained

In equation (25),

Suppose
The variance of

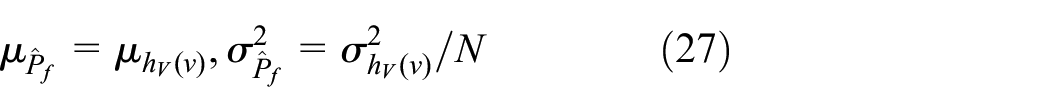
According to equation (27), when

Formula (29) is called the sampling density function of optimal importance sampling.
Process of generating random numbers by rejection technique
The main idea of generating random numbers by rejection technique is whether the selected random number satisfies a criterion. If satisfied, it is an effective random number, otherwise it is generated again. Suppose variable
Uniform distribution in
Let
Discriminant
Markov Chain simulation sample process
In order to generate simulation samples by Markov Chain, a probability density function
Markov Chain Monte Carlo reliability analysis based on important sampling
The contact stress reliability analysis process based on important sampling MCMC is shown in Figure 9.

Process of solving reliability by Markov Chain Monte Carlo algorithm.
Contact stress reliability analysis variable hyperbolic circular arc gear
Contact stress reliability analysis variable hyperbolic circular arc gear with AFOSM
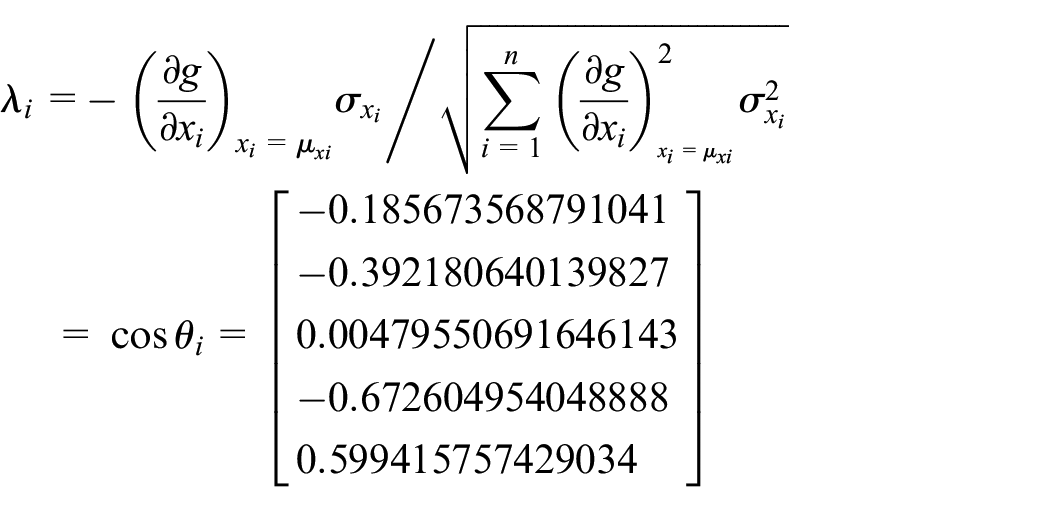
According to AFOSM reliability and sensitivity analysis method, the limit state equation between input parameters (pressure Angle, tooth width, modulus, tooth radius, and torque) and output (contact stress) of variable hyperbolic circular arc tooth line cylindrical gear was established in Section 3. The reliability of contact strength of cylindrical gear with variable hyperbolic arc tooth line and its sensitivity to design variables, mean value and variance are calculated. Reliability index, failure probability and corresponding sensitivity and sensitivity coefficient are:


Contact stress reliability analysis variable hyperbolic circular arc gear with Markov Chain Monte Carlo with important samples
In order to verify the correctness of AFOSM method. Markov Chain Monte Carlo with important samples method was used to calculate the reliability of the research object in this paper. Sample space of Markov Chain Monte Carlo with important samples is shown in Figure 10.

Simulates sample distribution based on Markov Chain sample sampling: (a) x1-x2, (b) x1-x3, (c) x1-x4, (d) x1-x5, (e) x2-x3, (f) x2-x4, (g) x2-x5, (h) x3-x4, (i) x3-x5, and (j) x4-x5.
The sample points of Markov Chain simulation samples based on the Metropolis-Hastings criterion are all near the failure points determined by AFOSM algorithm, which improves the accuracy and reliability of reliability calculation.
Contact stress reliability analysis results of variable hyperbolic circular arc gear with Markov Chain Monte Carlo with important samples was obtained as follows:

Compared with AFOSM, the calculation accuracy is close to that of AFOSM. The reliability obtained by MCMC algorithm is close to that obtained by AFOSM algorithm, so it is correct and feasible to analyze the reliability of gears by AFOSM algorithm.
According to the definition of reliability, we have. 24

The structural failure probability of the gear under the current working condition is close to 0, So R is close to 1, indicating that the gear is reliable under the current working condition.
Conclusions
At present, there is no study on the contact strength reliability for the variable hyperbolic circular arc gear. A method for calculating the contact strength reliability of variable hyperbolic circular arc gear based on Kriging model and AFOSM is proposed in this paper.
A method of construction the explicit expression of limit state equation of contact strength is proposed, and the explicit expression of limit state equation of contact strength for reliability analysis of variable hyperbolic circular arc gear was established.
The AFOSM reliability analysis method was used to analyze the contact strength reliability of variable hyperbolic circular arc gear based on the established limit state equation of contact strength. The structural failure probability calculated by the AFOSM is
The correctness of the reliability algorithm in this paper is studied by Markov Chain Monte Carlo reliability analysis method based on Important Sampling. The structural failure probability calculated by the Markov Chain Monte Carlo reliability analysis method based on Important Sampling is
The results show that the reliability algorithm in this paper can effectively realize the reliability analysis of variable hyperbolic circular arc gear. The structural failure probability of the gear under the current working condition is close to 0, indicating that the gear is reliable under the current working condition.
Footnotes
Handling Editor: Chenhui Liang
Declaration of conflicting interests
The author(s) declared no potential conflicts of interest with respect to the research, authorship, and/or publication of this article.
Funding
The author(s) disclosed receipt of the following financial support for the research, authorship, and/or publication of this article: The research was supported by the National Natural Science Foundation of China (No. 51375320, 51875370), Sponsored by Natural Science Foundation of Sichuan, China (No. 2022NSFSC0454), the Science and Technology Research Program of Sichuan Province (No. 2018JY0420), the University Key Laboratory of Sichuan in Process Equipment and Control Engineering (No. GK201905).