
Abstract
In engineering design, none of the existing models for calculating the contact pressure in pin-loaded lug is fully compatible with the actual working conditions. In order to obtain a more accurate formula for calculating the maximum contact pressure in pin-loaded lug, after verifying the reliability of the finite element model with PRESCALE pressure measurement film, single-parameter and multi-parameter analysis of two types of factors affecting the contact pressure distribution in the compressive surface of the pin-loaded lug were conducted in the fully elastic state. The influence of the relevant design parameters of the pin-loaded lug on its maximum contact pressure was obtained, and a formula for calculating the maximum contact pressure of the pin-loaded lug based on the Hertz stress distribution model was introduced. It is verified by a large number of finite element samples that the predicted values of the formula are in good agreement with the finite element solutions in the range of common scales for engineering design, and have high accuracy, which can be used for engineering design reference.
Keywords
Introduction
Pin-loaded lug is a common connection structure used in mechanical engineering and construction.1–3 In an ideal pin-loaded lug, the pin stiffness is large, the pin fits closely to the pin hole, and there is no gap between the lugs, at which time the pin is mainly subject to shear and the lugs are mainly subject to contact pressure and friction. In actual engineering, due to unavoidable machining errors or to improve the rotational performance of the pin connection, there will be a certain clearance between the pin hole and the pin or between the lugs. At this time, the pin will be subjected to large bending moment and the pressure distribution at the contact surface between pin and lugs will change, which will cause stress concentration at the contact edge between pin and pin hole.
At present, the pin-loaded lug in mechanical structure is designed adequately to resist shear and bending, so in practical engineering application, the main reason for the failure of pin-loaded lug in mechanical structure is the wear failure of pin surface and pin hole wall caused by large contact stress. Some studies have shown that the clearance in the pin-loaded lug has a great impact on the bending bearing capacity of the pin and the pressure-bearing capacity of the contact surface of the pin and the lugs.4–7
However, the current specification does not consider this influence factor, and the current research does not propose a calculation formula for this problem in engineering.8–10
In this paper, the contact pressure distribution of a typical three-lugs double-shear pin-loaded lug structure with the clearance between pin hole and the spacing between lugs as shown in Figure 1 is studied, and the calculation coefficient of lug width is introduced based on Hertz contact theory.
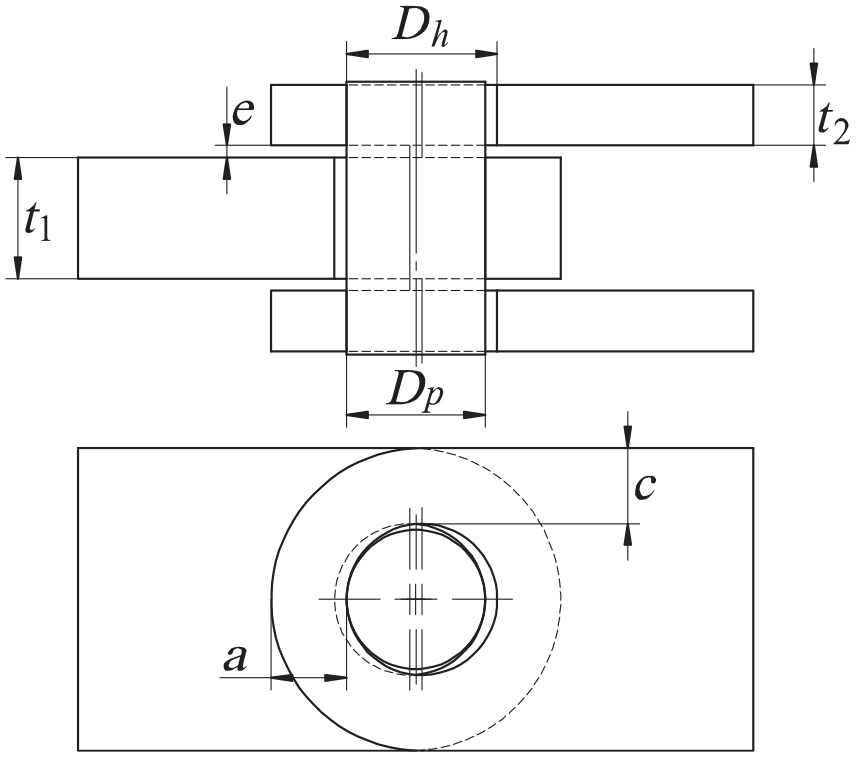
Schematic diagram of a typical three-lugs double-shear pin-loaded lug structure with the clearance between pin hole and the pin or between the lugs.
After verifying the results of the finite element model, a parametric analysis of the pin-loaded lug structure was carried out to investigate the effects of the diameter of the pin hole
Introduction to existing contact pressure distribution model for the contact surfaces of pin-loaded lug
According to the corresponding design specifications and relevant research statistics of each country, the current contact pressure distribution models of pin-loaded lug contact surfaces are roughly divided into three categories, as shown in Figure 2.
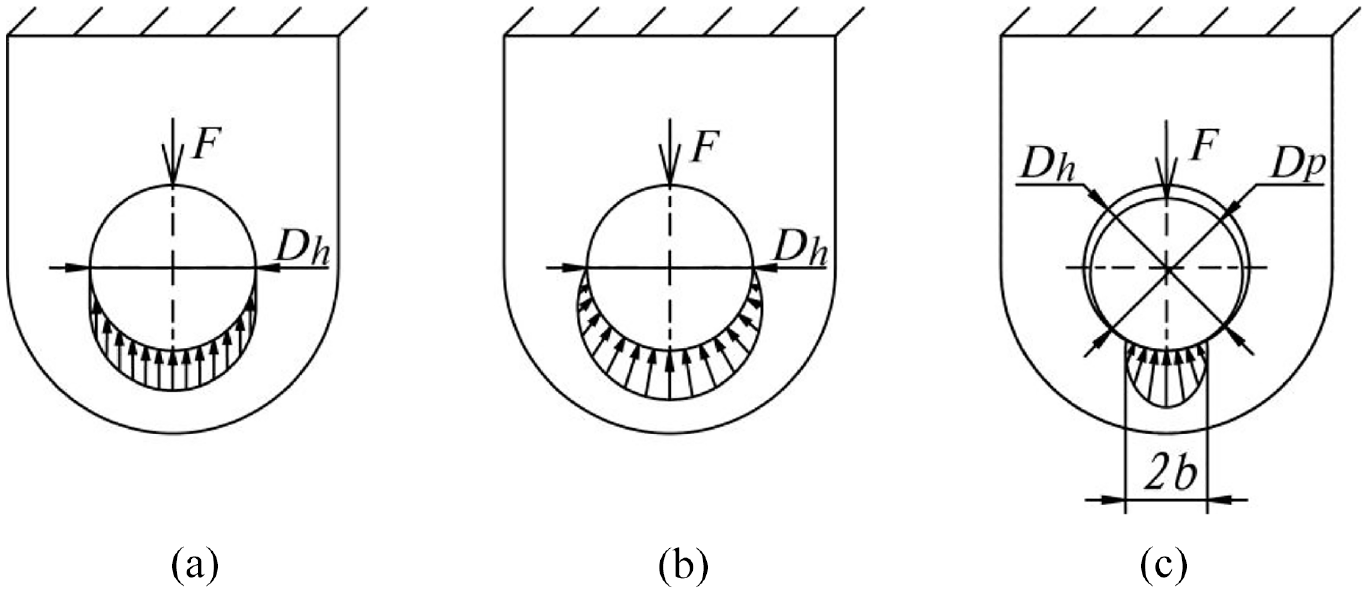
Pin-loaded lug contact pressure distribution model ((a) uniform pressure distribution model, (b) sinusoidal pressure distribution model, and (c) Hertz pressure distribution model).
Figure 2(a) shows the uniform pressure distribution model represented by the Chinese steel structure design standard.
8
This model considers that the bearing area of the pin-loaded lug is half of the pin hole area and the load

Where
Figure 2(b) shows the Sinusoidal pressure distribution model.
9
The engineering test shows that the load
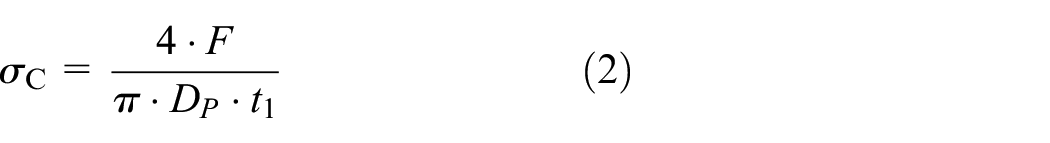
Figure 2(c) shows the Hertz pressure distribution model represented by the Eurocode3. 10 This model takes into account the pin hole clearance existing in actual engineering and considers the contact force transfer between the pin and the lugs, which gives the formula for the maximum contact pressure on the contact surfaces in the pin-loaded lug based on the contact theory of two infinitely long cylinders proposed by Hertz as equation (3).

Where
Each of these three models has its own advantages, disadvantages and scope of application. The uniform pressure distribution model is simple to calculate, but it far underestimates the maximum contact pressure of pin-loaded lug, so it is necessary to take a large safety factor to ensure the safety of the structure. The Sinusoidal pressure distribution model is close to the actual contact pressure of pin-loaded lug without pin hole clearance, but it is not suitable for pin-loaded lug with clearance. The Hertz pressure distribution model takes full account of the clearance between pin hole and the pin, but there is a certain range of application of Hertz contact theory: it is required that there is only normal force between the contact surfaces, there is no friction between the contact surfaces, the contact body is in a small deformation state and fully elastic state, and the size of the object should be much larger than the size of the contact area. Therefore, the Hertz contact theory is considered in the Japanese road and bridge code to be applicable only in pin-loaded lug where the pin hole-pin diameter ratio
At the same time, all three existing models are two-dimensional models, which neglect that the deformation of pin under the combined action of shear and bending moment will cause uneven distribution of contact stress between pin and pin hole, which is inconsistent with the actual situation. Therefore, it is necessary to carry out a more sufficient study on the contact stress distribution of pin-loaded lug in actual engineering, and make corrections based on the Hertz stress distribution model, so as to guide engineering design.
Contact pressure analysis of contact surfaces of pin-loaded lug
Theoretical analysis of contact pressure on contact surfaces of pin-loaded lug
Most of the existing studies treat the pin-loaded lug with clearance as a contact problem between two cylinders of equal length with parallel axes.10–13 As shown in Figure 3, according to the Hertz contact theory, when the load
Schematic diagram of two equal length cylinders in contact with parallel axes.
Therefore, as shown in equation (4):
The load
From the Hertz contact equation, the half-width

The maximum contact pressure is obtained by taking equation (5) into equation (4) to obtain the analytical equation (3).
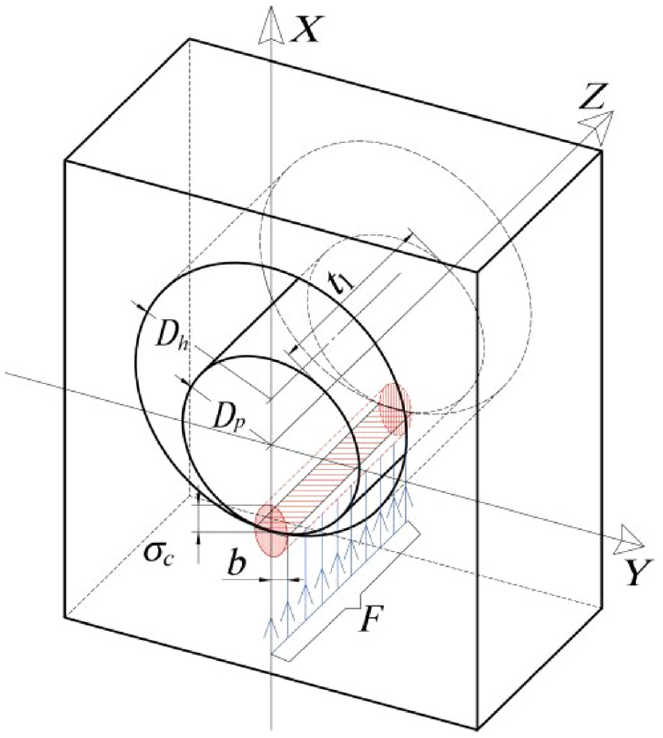
However, the actual pin-loaded lug is not the contact problem of two cylinders of equal length. As shown in Figure 4, under the action of load
Pin-loaded lug contact diagram.
And in each contact section along the axis of the pin, the contact pressure can still be considered as two cylindrical contact problems of equal length. Therefore, the contact pressure on the contact surface of the pin hole of the main lug shall present a saddle shape with high ends and low middle as shown in Figure 5. According to equation (4), the volume
Schematic diagram of contact pressure distribution on the contact surface of the main lug.
Pin-loaded lug contact pressure distribution measurement test
In order to verify the above theory, relevant experiments need to be conducted. Since the pin-loaded lug contact surface is a closed interface, the measurement of its contact pressure is more difficult. The existing research results lack of reports on relevant measurement tests. At present, the measurement methods for the closed contact surface include flexible contact pressure sensor method, 16 photo-elastic method,17–19 X-Ray diffraction method, 20 infrared stress method, 21 ultrasonic reflection method,22,23 and pressure measurement film method.24,25
The flexible contact pressure sensor method can measure the pressure range is small, the resolution is also very low, and the thickness of the sensor is large, which will change the original contact structure. The photo-elastic method can only use a special material to make a model, heat the material to the freezing temperature, apply a load and then cool it, freeze and save the birefringence effect under the load and then slice it for observation, so it can only indirectly measure the pressure distribution on the contact surface and the measurement results are not continuous. The X-Ray diffraction method is only at the
This pin-loaded lug contact pressure distribution measurement test is based on a pin-loaded lug joint in a skeleton membrane structure of an engineering project. The design parameters of this pin-loaded lug are:

Tensile samples of materials for pins and lugs.
Material parameters of pin-loaded lug samples.
Because the measurement range of the pressure measurement film is limited, the test measured the contact pressure distribution when the axial force
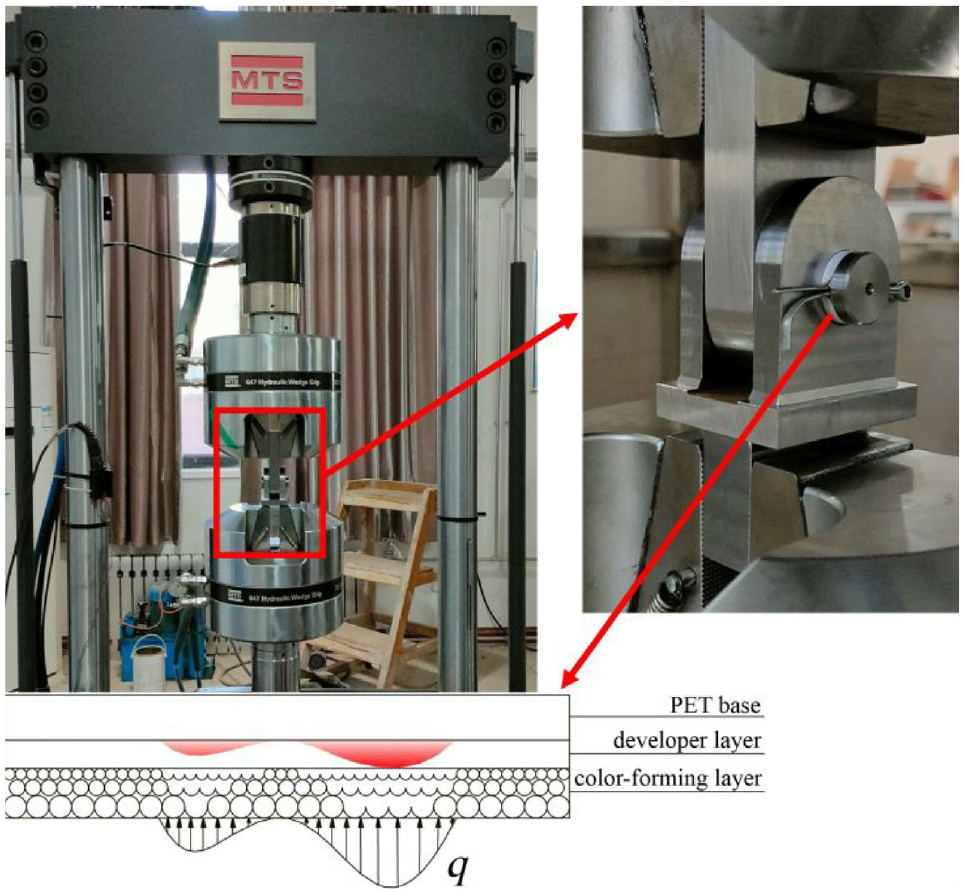
General view of the pin-loaded lug contact pressure distribution measurement test.

Scan of the pressure measurement film and standard color card after the test.
From the test results, the contact pressure of the pin-loaded lug shows a saddle shape with high ends and low middle, which is consistent with the theoretical analysis. Because the pressure measurement film needs to be taken out and scanned, the film cannot be directly pasted on the pin during the test, resulting in the film not fitting well with the contact surface. The processing error and clamping error of the sample during loading result in the added load not being completely in the geometric center of the pin-loaded lug, so the contact pressure distribution image obtained from the test is incomplete, but the maximum value of the contact pressure and the distribution trend of the contact pressure can also be obtained.
In order to more intuitively display the distribution of contact stress of the pin-loaded lug, according to the corresponding curve of image color concentration and contact stress provided by the standard color card, Matlab tool is used to program the scanned pressure measurement film, After image grayscale processing, numerical processing and color mapping, the obtained pressure measurement film on the contact surface of the pin shaft connection is converted into a visual cloud diagram of stress distribution, and the results are shown in Figure 9.

The stress distribution nephogram of the contact surface of pin-loaded lug obtained after Matlab processing Scan of the pressure measurement film and standard color card after the test.
Finite element test of pin-loaded lug contact pressure distribution
Due to the limitation of contact pressure measurement by pressure measurement film, in order to further explore the distribution pattern of pressure on the contact surface of the pin connection, the specimen was modeled and further finite element analysis was performed by applying ANSYS.
Solid186 unit is used to establish the finite element model, because this paper studies the stress distribution on the contact surfaces of the pin trunnion in the fully elastic state, so the material is used in the ideal elastic model, and the material parameters are used in the test results of material properties.
The contact between the pin and the pin hole was established using Conta174 and Targe170 contact pairs, and the contact algorithm was the augmented Lagrange method. All nodal degrees of freedom at the end face of the double lugs are constrained, and the surface load is applied to the end face of the main lug to simulate the axial force, and due to the symmetry of the model forces, a quarter model is used for the analysis as shown in Figure 10 to save computational resources. 27

Finite element model of pin-loaded lug.
When the load of the main lug is 10 kN, the stress diagram of the pin-loaded lug contact surface is shown in Figure 11.
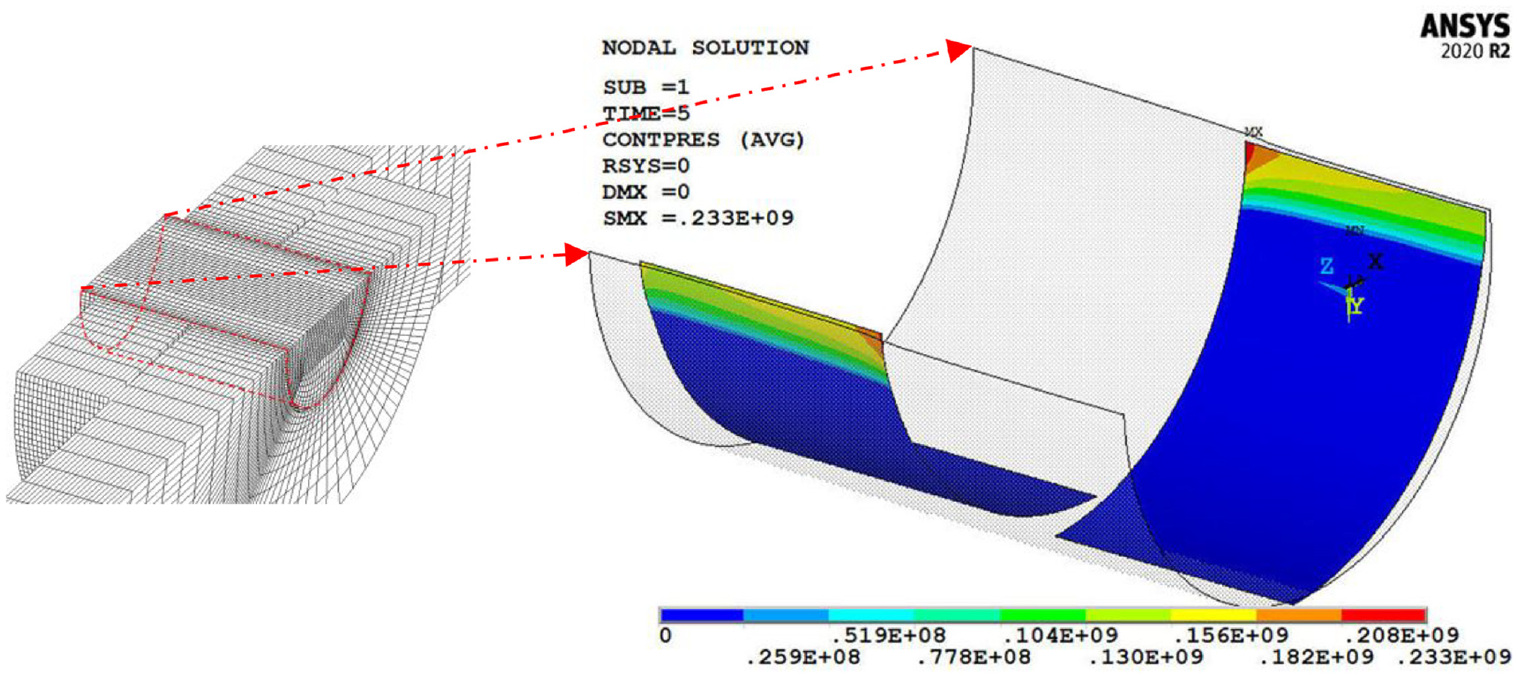
Stress distribution diagram of contact surface between pin and lugs (unit: Pa).
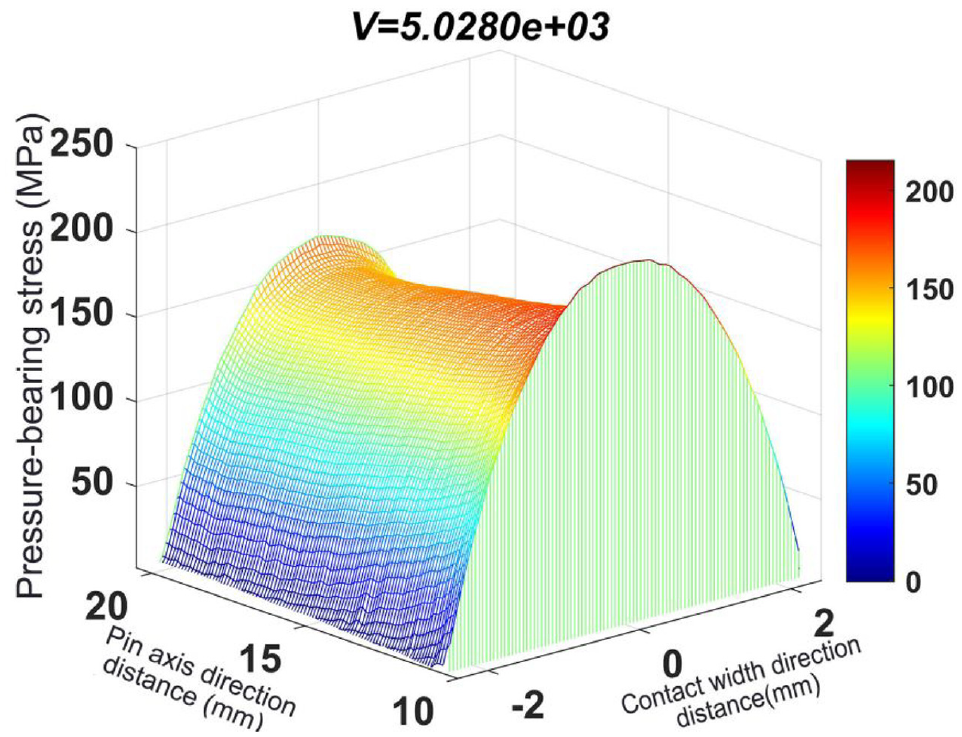
The coordinates and pressure data of the contact surface nodes were extracted and imported into Matlab, and the three-dimensional maps of the contact pressure distribution of the pin-loaded lug surface were plotted along the contact width direction and the pin axis direction, and the volume enclosed by the coordinate plane was solved using the micro-element method, and the results are shown in Figures 12 and 13.

Three dimensional distribution of contact pressure on contact surfaces of main lug.
Three dimensional distribution of contact pressure on contact surfaces of double lugs.
From the simulation results, it can be seen that the contact pressure distribution on the contact surface of the pin-loaded lug can be clearly obtained using the finite element method, which is very close to the results of the theoretical analysis.
Similarly, finite element simulations were carried out for the main trunnion load of 5 kN working condition, and the maximum contact pressure on the contact surfaces of the main lug and double lugs were compared with the average value of the test data measured by the pressure measurement film, and the results are shown in Table 2.
Comparison of the results of finite element simulation and test.

It can be seen that the simulation results are close to the test data, which indicates that the finite element model is appropriate, so this finite element model can continue to be used for the virtual test of the contact pressure distribution on the contact surfaces of the pin-loaded lug.
Contact pressure distribution lawof pin-loaded lug
After theoretical analysis and test verification, the contact pressure distribution of the pin-loaded lug can be obtained by the finite element method. We observe that this distribution law is very complex and difficult to describe analytically. In practical engineering applications, the pressure distribution on the entire contact pressure is usually not of concern, but only the maximum pressure value on the contact surfaces. Therefore, the effect of the design parameters of the pin-loaded lug on its maximum contact pressure is investigated with the help of the finite element method.
According to the theoretical analysis, the factors affecting the contact pressure distribution on the contact surface of pin-loaded lug are mainly divided into two categories:
The factors affecting the contact surfaces area.
The factors affecting the degree of deformation of pin and lugs.
Therefore, the existing Hertz stress distribution model is modified by considering the effects of these two types of factors separately.
Factors affecting the contact surfaces area
The main factors affecting the contact surface are the tangential friction between the contact surfaces and the roughness of the contact surface, which is reflected as the friction coefficient in engineering application. The friction coefficient of steel-steel surface is 0.15–0.2 under the condition of no lubrication and 0.05–0.15 under the condition of lubrication. Therefore, ANSYS was used to investigate the effect of friction coefficient in the range of 0–0.2 on the pressure distribution on the contact surface of the pin-loaded lug, and the results are shown in Figure 14,

Friction coefficient
It can be observed from the figure that the maximum contact pressure increases with the increase of the friction coefficient
In order to facilitate the calculation in engineering, the most common working condition of pin and pin hole without lubrication and friction coefficient


Factors affecting the degree of deformation of pin and lugs
The actual pressure distribution on the contact surface of the lugs when the pin and the lugs are deformed by the load is shown in Figure 15(a). To facilitate the calculation, the maximum contact pressure of the pin-loaded lug is described using the calculated width method. As shown in Figure 15(b), assuming that the maximum contact pressure values at the contact surfaces of the main lug and double lugs under actual non-uniform loads are equal to the maximum contact pressure values applied to the uniform loads on the calculated width

Equivalent calculation diagram of the maximum contact pressure value ((a) actual force distribution of contact surfaces and (b) equivalent force distribution of contact surfaces).
Where
Single-parameter analysis of lugs width calculation coefficient
The main factors influencing the deformation degree of pin and lugs are the geometrical design parameters of pin-loaded lug and the applied load. Therefore, on the basis of the design parameters of the original test pin-loaded lug, the influence of the diameter of the pin hole

Calculated width coefficient
From the results, it can be seen that, with the pin-loaded lug in a fully elastic state, the end distance of the lugs
An increase in the spacing of the lugs
An increase in the load to pin diameter ratio
Multi-parameter analysis of the calculation coefficient of the lugs width
According to the results of the single parameter analysis of

Based on the sample data in Table 3, a quadratic polynomial regression model for


The goodness of fit of both regression models was greater than 0.9, indicating that the models have high reliability, and Tables 4 and 5 show the ANOVA results of the regression models.
Analysis of variance of quadratic polynomial model of

Analysis of variance of quadratic polynomial model of

As can be seen from the variance results, the p-values of both regression models are less than 0.0001, indicating that the significance of the models is high, where the p-value of the respective variables of the models represents their influence on the dependent variable, and the smaller the value, the greater their influence. As can be seen in Figure 17, the finite element solutions of

Distribution of actual values of
Calculation formula for maximum contact pressure of pin-loaded lug
After the study of the two types of factors affecting the contact pressure distribution on the contact surfaces of the pin-loaded lug, the correction coefficients of these two types of factors based on the Hertz stress distribution model were obtained respectively, and the maximum contact pressure of the pin-loaded lug was finally calculated as in equation (11).

Where the value of
In order to verify the reliability of the formula in practical engineering, a large number of sample points were established by taking random values in the range of pin-loaded lug design scale commonly used in engineering practice. Solutions by finite element method are applied and compared with the predicted results of equation (11). The results are shown in Figure 18.
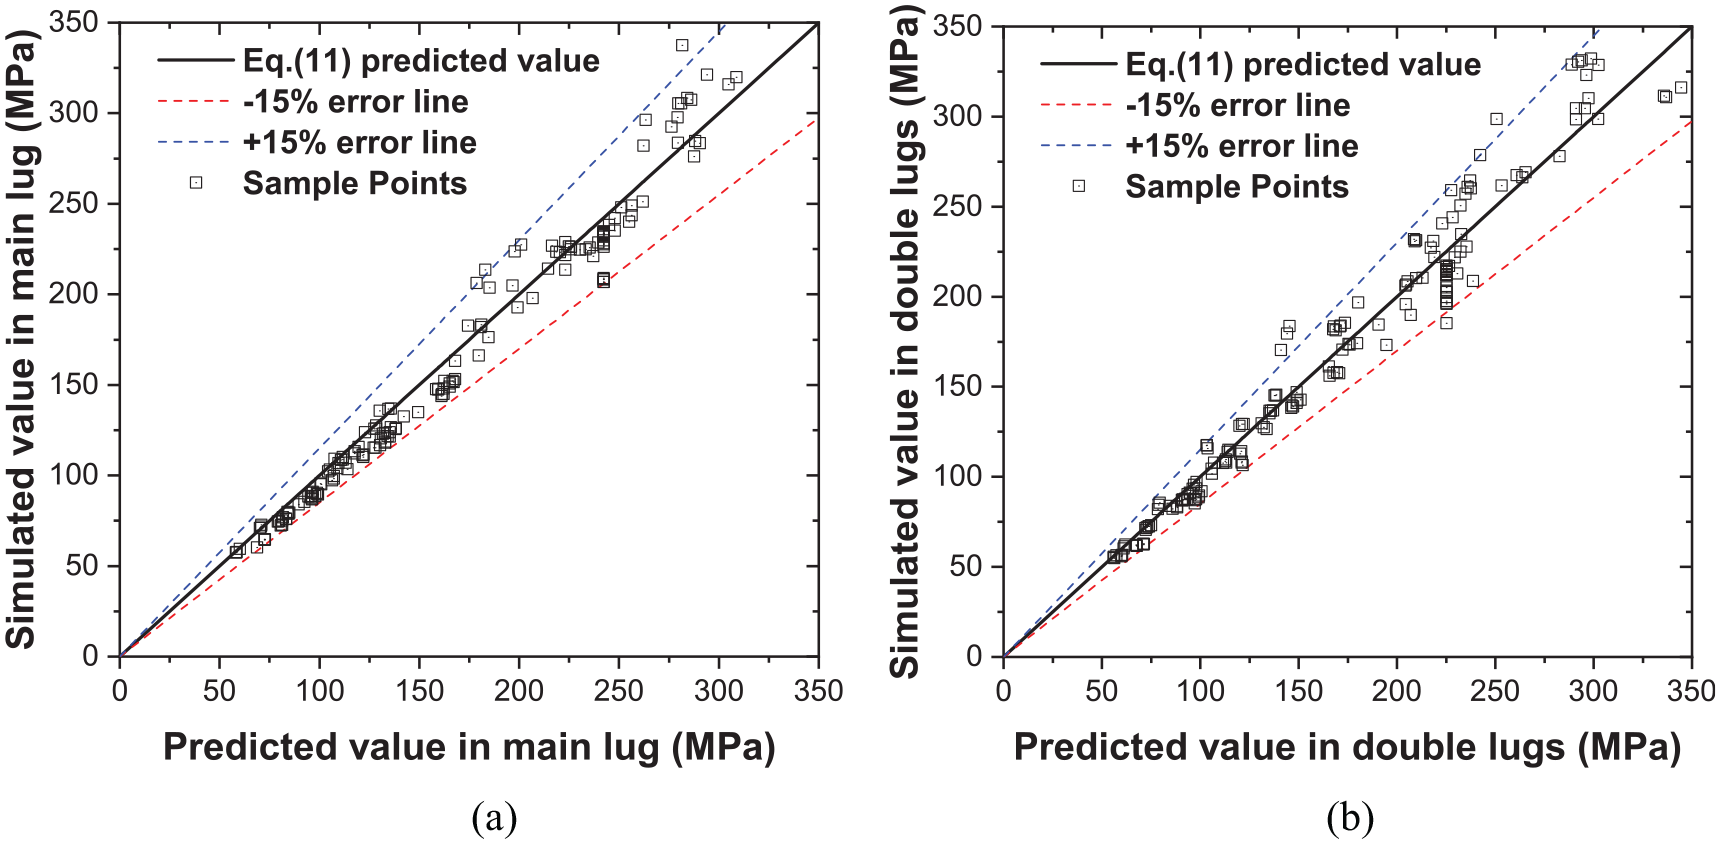
Comparison between finite element solution of
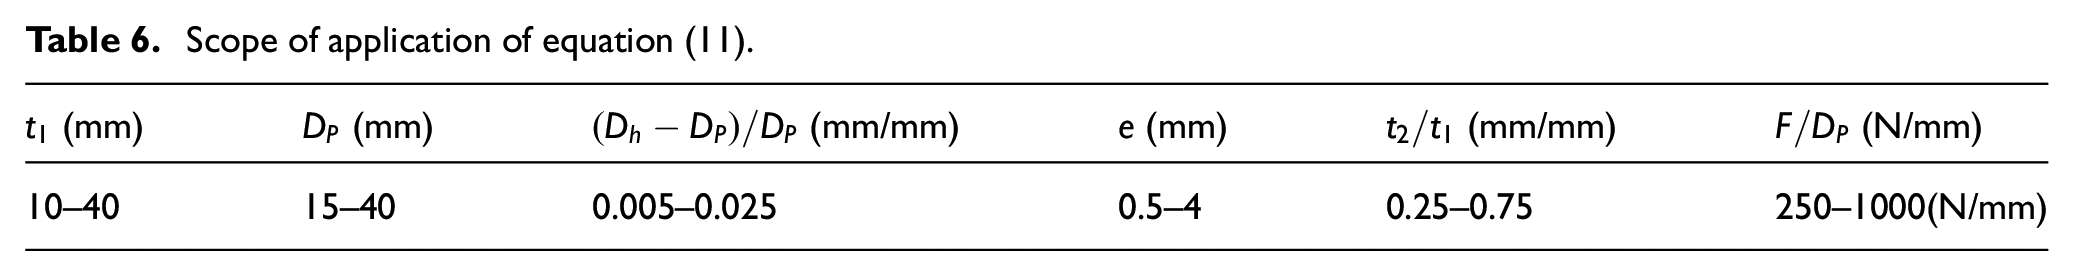
It can be seen from Figure 18 that the predicted value of the modified Hertz stress distribution model formula given in this paper for the maximum contact pressure of pin-loaded lug has a high fitting with the finite element solution. Except for individual sample points, the errors of most sample points are within ±15%, which can meet the accuracy required for engineering application. The recommended application scope of equation (11) is shown in Table 6.
Scope of application of equation (11).
Conclusions
Through the theoretical analysis of the contact pressure distribution on the contact surfaces of pin-loaded lug with clearance between the pin hole and the lugs, it is found that there is a difference between the distribution law and the existing calculation model.
Pressure measurement film is used to measure the contact pressure of pin-loaded lug joint in a skeleton membrane structure of a project, the measured data were compared with the finite element results to verify the applicability of the finite element model.
Based on the finite element software ANSYS, the two types of factors affecting the contact pressure distribution on the contact surfaces of the pin-loaded lug were studied, and a formula for calculating the maximum contact pressure of the pin-loaded lug based on the Hertz stress distribution model was obtained after regression fitting.
The finite element simulation of a large number of sample points verifies that the predicted value of the maximum contact pressure of the pin-loaded lug introduced in this paper agrees well with the finite element solution in the range of the pin-loaded lug design scales commonly used in engineering practice, and meets the required accuracy for engineering applications, and can be used for engineering design reference.
Footnotes
Handling Editor: Chenhui Liang
Declaration of conflicting interests
The author(s) declared no potential conflicts of interest with respect to the research, authorship, and/or publication of this article.
Funding
The author(s) disclosed receipt of the following financial support for the research, authorship, and/or publication of this article: This work was supported by the Science and Technology Planning Project of Zhejiang Province (No. 2019C05008).