
Abstract
The cement sheath-formation interface is a weak link in wellbore isolation systems, which is prone to the failure of sealing integrity during fracturing, affecting the fracturing effect, and wellbore safety. In this study, we establish a new model to evaluate the failure mode and crack propagation of cement sheath-formation interface. Using the proposed model, we predicted the propagation direction and length of the interface and zigzag cracks caused by the interface stress, fracturing load, and stress intensity factor (SIF) under temperature and pressure in the shale oil well X in the eastern China oil field. The prediction results were consistent with the distribution law of measured microseismic events. In addition, we analyzed the influence of the internal casing pressure, mechanical properties of cement sheath, and formation on the sealing integrity failure and cracks. At the same time, we discussed the influence of these mechanical properties on the propagation length of interface and zigzag cracks and the propagation direction of the zigzag crack in detail, and proposed the optimal mechanical properties design to avoid the crack propagating to the cement sheath and causing its failure. The results can provide effective guidance for sealing integrity prediction and cement sheath mechanical performance design.
Introduction
In recent years, shale oil has become an essential source of energy. 1 Owing to their low porosity, compactness, and no natural productivity, 2 shale reservoirs are developed and increased production using technologies like horizontal wells and multi-stage fracturing. Currently, an oil field in eastern China is vigorously developing shale oil 3 and increasing well productivity through fracturing. However, owing to the high pressure during fracturing the cement sheath sealing integrity could fail, 4 which would reduce the fracturing effects leading to potential safety hazards. Therefore, it is of utmost importance to identify the main factors that affect the hydraulic isolation of shale reservoirs to maintain the cement sheath sealing integrity.
Cement sheath is an important part of the wellbore barrier. Predecessors have conducted many theoretical and experimental studies concerning the failure of the cement sheath. In the wellbore, if the cement sheath strength is insufficient under high temperature and high pressure (HTHP) conditions, it could lead to shear failure 5 and radial cracking.6,7 Furthermore, if the deformation ability of the cement sheath is insufficient when the temperature and pressure change, it can lead to inconsistent deformation of the casing and cement sheath, thereby causing the interface to debond and form micro-annulus.8–11 Mechanical failure and micro-annulus can significantly reduce the sealing ability of the cement sheath toward wellbore fluids,10,12,13 resulting in failure of the hydraulic sealing.14–16 In addition, a weak bonding strength at the interface and poor cementing quality can cause the cement sheath to lose its barrier function.17,18
In recent years, some scholars further discovered that even if the cement sheath has good strength and deformation ability, the sealing failure of the cement sheath will also occur.19,20 And this type of failure generally occurred during the fracturing and was called the cement sheath seal integrity failure. 21 Yong et al. 22 studied the sealing failure and propagation of interface cracks under fluid pressure and found that the interface crack length can be reduced by decreasing the wellhead pressure and construction time and increasing the Young’s modulus of the cement sheath. Hu et al. 23 established a failure length model of the cement sheath-formation interface. The analysis showed that during the process of injecting CO2 into the wellbore, the coal seam expanded easily and generated shear stress at the interface, thereby causing interface debonding. Lecampion et al. 24 designed a reduced hydraulic packer evaluation device to evaluate the failure of sealing integrity and expansion of interface cracks. Feng et al.25,26 used numerical methods to restore these processes in their study. Fan et al. 27 researched on the cementing unit of the cement sheath-formation interface and analyzed the sealing integrity and crack length of the interface under fracturing conditions using numerical simulation methods. Yan et al. 28 analyzed the interface crack propagation during the fracturing through numerical methods. The study found that the sealing ability of the cement sheath-formation interface was weaker than that of the casing-cement sheath interface. Deceased the viscosity of the fracturing fluid and wellhead pressure was beneficial to shorten the length of the interface crack. Wang and Taleghani 29 also analyzed the propagation of interface cracks by establishing a numerical model, and found that increasing the stiffness and bonding strength of the cement sheath was conducive to reducing the sealing failure risk. Wang et al. 30 used the stress intensity factor (SIF) method to study the influence of fracturing on the crack length and width under the assumption of an infinite plane.
It can be found that scholars had been carried out extensive research on interface sealing. However, it is affected by the stress distributed on the interface, the stress field at the crack tip, and the mechanical properties of the materials, the crack not only expands along with the interface but also deflects into a particular side of the material. 31 This can cause zigzag cracks and aggravate the degree of wellbore sealing failure. Simultaneously, those study ignores the influence of the cooling effect on stress distribution at the interface during fracturing.
In this study, we established a new model based on the influence of temperature and pressure to analyze the propagation of hydraulic cracks along the interface and tortuosity into a particular side of the cement sheath/formation. And then we analyzed the cement sheath sealing integrity, the length and direction of interface and zigzag cracks of a shale oil well in eastern China. Finally, the influence of internal casing pressure, cement sheath, and formation mechanical properties was also discussed. In order to avoid the damage caused by the zigzag crack entering the cement sheath, the mechanical performance design requirements of the cement sheath were put forward, which provided a theoretical basis for reducing the influence of fracturing on the sealing integrity of the cement sheath.
Model establishment and solution
Analysis of cement sheath hydraulic sealing failure mode
During fracturing, the cement sheath bears both the internal casing and the formation pressures, which can cause the cement sheath to crack or produce micro-annular (mechanical integrity failure). In addition, the end face of the cement sheath is subjected to fracturing loads, which results in interface and zigzag cracks (sealing integrity failure), as shown in Figure 1.

Failure of the mechanical and sealing integrity of the cement sheath during fracturing.
Although extensive research has been conducted on the interface crack propagation during fracturing, owing to the difference in the mechanical properties of the casing, cement sheath, and formation and the fracturing fluid load, the cracks could deflect into a particular side of the material. 32 This is called the zigzag propagation of the crack. In this study, it was believed that if the critical SIF of the interface or material on one side of the interface was lower than the SIF at the crack tip, it would result in crack propagation and failure of sealing integrity. Therefore, as shown in Figure 2, the main failure mode of cement sheath hydraulic sealing was divided into four types. Each color in the figure represents a failure mode; 1 and 2 represent the order of failure of the interface or a unilateral material in a certain mode.

Failure modes of the cement sheath hydraulic sealing.
The first is failure along the interface, which can be attributed to the failure of the cement sheath-formation interface (or casing-cement sheath interface) bonding, and results in cracks in the interface and continues to propagation.
The second type is failure along the interface first, followed by failure of the one-sided material of the interface. This was attributed to the fact that since the beginning of fracturing, the interface developed cracks, which propagated along the interface. Furthermore, when the SIF at the crack tip reached the critical SIF of material on one side, the crack began to branch and the material on one side formed a crack, which continued to extend.
The third type is failure along the material on one side of the interface first, followed by the interface producing a crack. This was attributed to the fact that when the fracturing pressure increased, the material on a certain side of the interface fractured first. As fracturing continued, the interface SIF reached the critical value and produced a crack, which extended forward and eventually formed a bifurcated crack.
The fourth type extended directly from the interface to a certain side of the material without damaging the interface.
The first and fourth types of failure modes were called interface failure and zigzag failure, respectively. The second and third failure modes were called compound failure, owing to the involvement of both the interface crack and zigzag crack.
Stress on the interface
As shown in Figure 3, the initial crack tip at the interface was considered as the origin coordinate, whereas the direction of crack propagation and the wellbore center were considered in the positive direction of the X-axis and Y-axis, respectively. The cement sheath bears the load from the casing and formation in the wellbore, with σ r , referred to as the stress caused by temperature difference and pressure, parallel to the Y-axis and the bonding strength σ b between the cement sheath and formation. During fracturing, the end face of the cement sheath bears the construction pressure load p, which can be decomposed into stresses σ x and σ y along the interface and perpendicular to the interface at the crack tip, respectively. Furthermore, it was found that under fracturing conditions, the cement sheath-formation interface simultaneously bore the load p that caused the crack to expand forward and stress σ c that prevented the crack from extending.

Cementing interface load analysis.
Crack propagation model
Bogy 33 proposed equation (1) to characterize the stress distribution at the crack tip for the fracture of the interface crack:
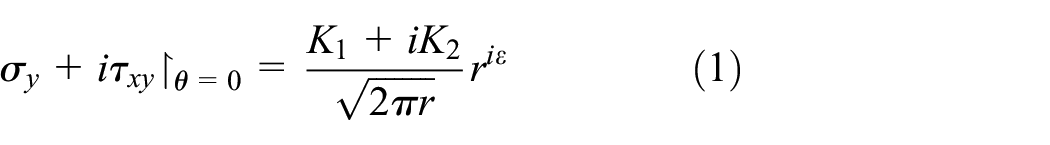
where, σy: stress perpendicular to the crack (MPa); τxy: stress parallel to the direction of crack propagation (MPa); r: length of the crack from any position to the crack tip (m); K1, K2: SIF of the crack (related to the stress at the crack tip and independent of fracture modes I and II in fracture mechanics) (MPa·m1/2); ε: bi-material constant, used to characterize the difference in material properties on both sides of the interface, expressed as:
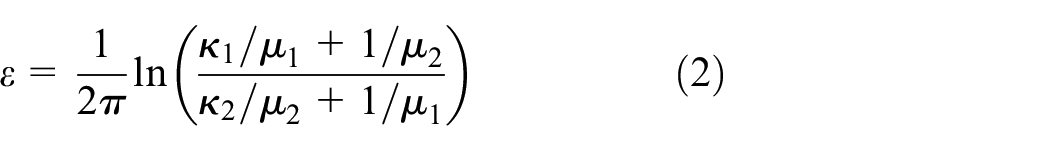
where,
After obtaining the SIF of the interface crack, it was necessary to use the corresponding failure criterion to determine the crack propagation mode. Ryoji et al.34–36 proposed a method of modal ratio based on the failure of a crack extended along the interface to determine whether the interface between two materials would fracture or not. Furthermore, Dong et al. 37 used this principle to establish an interface crack propagation criterion, as defined in equation (3).

where
A maximum circumferential stress criterion was used to evaluate the failure mode of a zigzag crack, 38 given as:

where

where
To determine the cement sheath-formation interface failure mode, it is necessary to comprehensively consider the occurrence of the above interface and zigzag failure criteria at the critical condition. In addition, when the zigzag crack propagated into a single-side material, its propagation was seen as a composite type I and II crack propagation of a single material, 39 as shown in equation (6).

where

Model solution
As discussed in Section 2.3, the calculation results of
As shown in Figure 4(a) and (b), the load distributed at the interface was decomposed into stress σ c , which prevented crack propagation, and fracturing load p, which drove the crack propagation, respectively. According to the decomposed interface load, equation (1) can be rewritten as:


Decomposition model of the cement sheath-formation interface: (a) Cement sheath-formation interface load affected by the internal casing pressure, formation pressure, and bonding strength and (b) Cement sheath-formation interface load affected by the fracturing load.
where L = 2a, the aim was to make the physical meaning of SIF at the cement sheath-formation interface more explicit. 40
a: crack propagation length (m).
According to equation (8), there is a stress oscillation region at the tip of the interface crack (r→0), which makes it difficult to obtain an analytical solution for SIF. Therefore, the stress decomposition method (equation (9)) was used to solve the SIF of the interface crack.
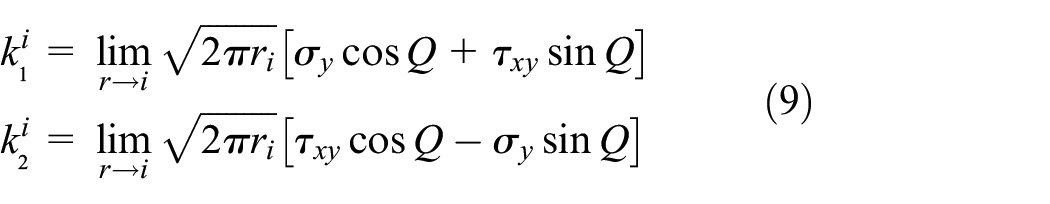
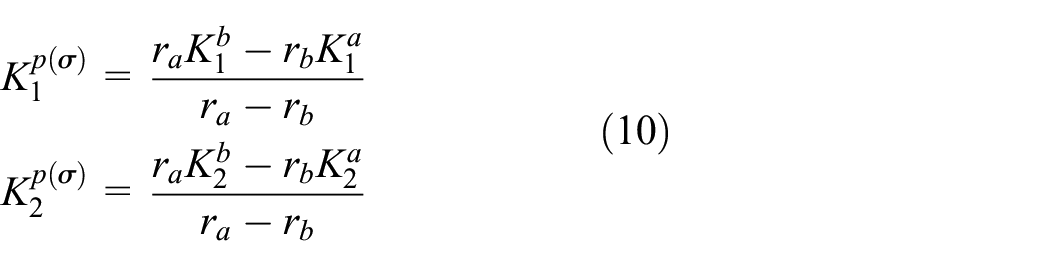
We assumed there was an initial crack of length a0 at the cement sheath-formation interface. Considered two nodes near the initial crack (1/4 and 1/2 positions) and used the equation (9) to calculate the SIF at each node. Additionally, adopted the linear interpolation method (equation (10)) to determine the SIF at the crack tip.
where
σy: σy = 0 (MPa) in the decomposition model in Figure 4(a); and σy = σy or -σy (MPa) in the decomposition model in Figure 4(b); τxy: τxy =σc (MPa) in the decomposition model in Figure 4(a); and τxy = σx (MPa) in the decomposition model in Figure 4(b);
K1 a, K2a, K1b, K2: SIF at (1/4)r and (1/2)r, respectively, MPa·m1/2.
Based on the above denotations, K1 p and K2 p , and K1σand K2σ can be obtained under the influence of load p and stress σc, respectively. Simultaneously, according to the linear superposition method, K1 and K2 in equations (3) and (4), respectively, can be rewritten as:

By substituting equation (9), that is, the wellbore pressure conditions and the cement sheath and formation physical properties into equations (3) and (4), the SIF
From the above method, we could observe whether or not the hydraulic sealing failure and failure mode had occurred under fracturing conditions. However, crack propagation was a dynamic process during fracturing. The analysis of the failure time and mode could not restore the interface crack length completely. Therefore, it was necessary to calculate the SIF stepwise: during the interface crack (or the zigzag crack) propagation, the model needs to go through a “deletion-rebuild” process every time the crack propagation forward by a tiny increment Δa0; at the same time, in the next “rebuild” model, it is necessary to consider the interface stress field and other parameters of the previous calculation step, and judge again whether the crack will continue to propagate along with the interface or zigzag propagation under the current calculation step.
Specifically, assuming that a certain fracturing load is the initial wellbore pressure, the SIF was calculated using the above calculation method and compared with the critical SIF for interface crack and zigzag crack. If the SIF is lower than the critical value, it means that the sealing ability is good and the crack will not propagate; if the SIF is equal to the critical value, it means that the sealing ability has just failed, and the crack is about to propagate; if the SIF is greater than the critical value, it means that crack propagation occurs. At this time, it is considered that the crack propagates forward by a distance of the initial crack length and is recorded as a calculation step, and then the calculation is performed again, and the above evaluation process is repeated. Affected by the resistance in the crack and the construction time, the crack will eventually stop propagating. The final length of the crack length is the product of the number of calculation steps (n) and the initial crack length (a0), which is recorded as crack propagation length = n × a0.
The calculation process is shown in Figure 5.
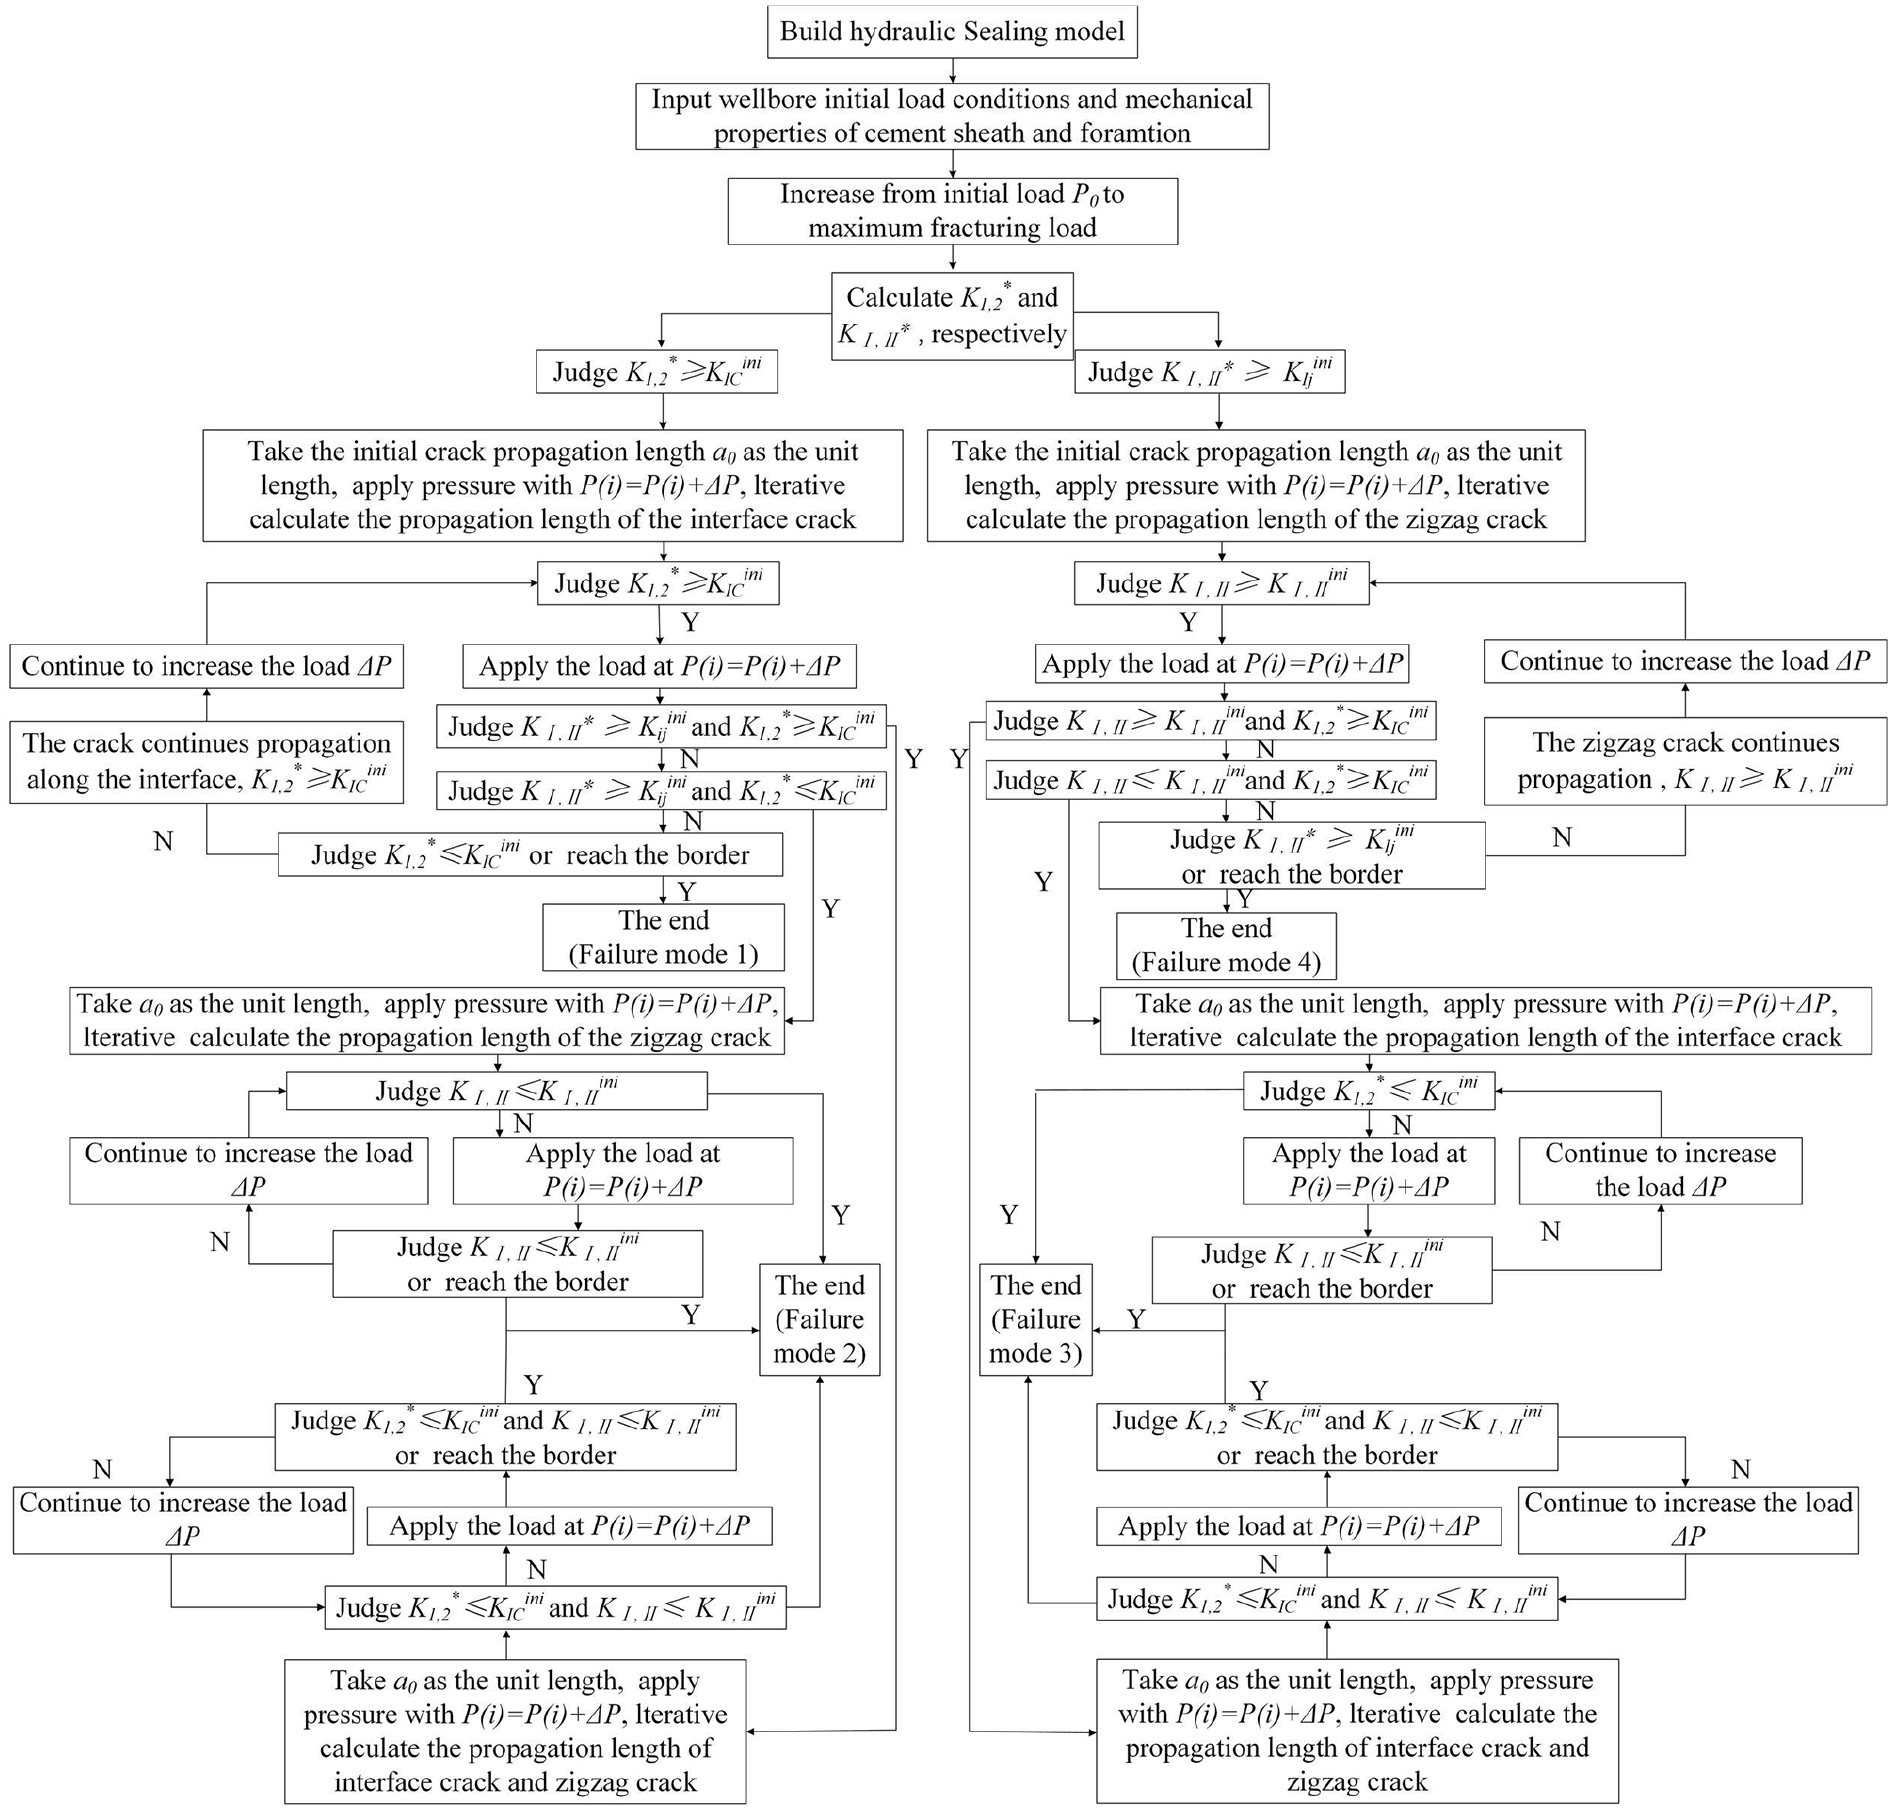
Calculation flowchart of the interface and zigzag cracks of the cement sheath-formation.
where, P0: the internal casing pressure at the beginning of fracturing (MPa); P(i): the internal casing pressure at each iterative step (MPa); and ΔP: the increased internal casing pressure at each iterative step (MPa).
The stress σ r and fracturing load P were solved using the model established in Appendices A, B, and C.
Example calculation
For the trial calculation, we used the shale oil well X in the eastern China oilfield as an example. Analyzed and calculated the cement sheath sealing integrity and crack length by substituting the actual working parameters of the well into the model from the previous section. Furthermore, the accuracy of the model was verified by comparing the theoretical calculation results to the actual logging microseismic events.
Microseismic analysis
Well X was the first horizontal shale oil well in the eastern oilfields of China, and used multi-stage fracturing to increase its production. As shown in Figure 6(a), in the eighth fracturing section during the fracturing microseismic interpretation, a dense area of microseismic events was observed near the perforation point and the wellbore approximately 100 m from the fracturing section. Simultaneously, slight fluctuations of the cementing quality in the cement sheath-formation interface were observed near the eighth fracturing section (4809–4837.6 m well section), as shown in Figure 6(b). It is speculated that during the fracturing, the sealing integrity of the cement sheath-formation interface fails, resulting in the transfer of microseismic events. Therefore, follow-up research and analysis have been carried out on the sealing integrity and crack propagation of the cement sheath-formation interface.

(a) Top view of the microseismic events in the eighth fracturing section. (b) Cementing quality at 4809–4837.6 min Well X.
Well conditions and fracturing parameters
The vertical and measured depths of Well X were 3851.38 and 5465 m, respectively. The drill bit size was 215.9 mm, the casing size was 139.7 mm, and the casing thickness was 9.65 mm. The formation pore pressure was 45 MPa and the internal casing pressure during curing was 58 MPa. The mechanical properties of casing, cement sheath, and formation are summarized in Table 1.
Mechanical properties of the casing-cement sheath-formation.

Before fracturing, the liquid column pressure in the wellbore was 40 MPa, and the fracturing adopted the casing fracturing method. The maximum internal casing pressure was 77 MPa for a construction time of 170 min. The construction comprised 16 fracturing sections at a distance of approximately 110 m. The polymer slick water fracturing fluid system was used. Table 2 summarizes the engineering performance of the fracturing fluid.
Engineering performance of the fracturing fluid.

Analysis of the sealing integrity
Based on the above model, we evaluated the failure mode of the hydraulic sealing and calculated the crack length. Table 3 summarizes the required parameters of the model. It should be noted that because the initial crack was located at the cement sheath-formation interface, which was weaker than the cement sheath and the formation, the critical SIF of the zigzag propagation was slightly higher than that of the interface. Simultaneously, owing to the plastic brittleness of the cement sheath and oil shale, once the crack twists and turns into a certain side material, the overall fracture toughness of the material decreases. Therefore, the critical SIF after the crack entered a certain side material was slightly lower than that when the zigzag crack occurred.
Calculation parameters for the model.

Assuming the internal casing pressure increases at a rate of 1 MPa/s and remains constant after 77 MPa, we calculated the SIF of the interface and zigzag cracks. The results were shown in Figure 7. The black line represents the change law of internal casing pressure over time. Each point on the blue and red lines indicated the difference between the SIF and critical SIF of the interface crack and zigzag crack, respectively, for each propagation step. Simultaneously, under the constant critical SIF condition, as the internal casing pressure increased, the SIF in each propagation step increased owing to its influence, thereby increasing the difference in SIF. Furthermore, at constant pressure, the crack tip stress field is influenced by the resistance in the crack owing to its continuous propagation, thereby showing a decreased SIF. At the constant critical SIF condition, the difference gradually decreased. In addition, although the calculation of the propagation step at each moment was independent (in the current propagation step, the SIF of the next propagation step was remodeled after the crack had propagated), owing to the continuous change in the internal casing pressure, each propagation step was sequential. Therefore, we obtained the rule shown in Figure 7 by connecting the SIF difference of each crack propagation step from the fracturing start to the time when the crack stopped propagating.

(a) Relationship between the SIF difference and the internal casing pressure during the pressurization stage. (b) SIF curve during the constant pressure stage.
As shown in Figure 7(a), as fracturing proceeded, the SIF of the interface crack reached critical condition (SIF difference ≥0), indicating that the crack underwent its first propagation along the interface. Further, the SIF difference of the zigzag crack reached critical condition and began spreading to the formation. The failure mode of the cement sheath-formation hydraulic sealing of Well X was the compound failure. In addition, the SIF difference of the interface crack changed continuously as the internal casing pressure changed, but the SIF of the zigzag crack changed un-continuous, this is because the SIF of the zigzag crack was first affected by the zigzag propagation SIF (
Figure 8 shows the propagation length of the crack along the interface and the formation. Under the working conditions, the interface and zigzag cracks eventually propagated by 94.83 and 96.41 m, respectively. Simultaneously, the fracture angle of the formation crack first decreased and then increased. The angle between the end point and wellbore direction was −82°.

Calculation results of the crack propagation length.
For SY/T 7070-2016 (Technical specification for downhole microseismic monitoring), the location error of microseismic events needed to be less than 10 m. On comparing the above calculation results with the microseismic event test results, we found that the interface crack length (94.83 m) was similar to the transfer distance of the microseismic event (approximately 100 m). Meanwhile, it can also be found that the fracture angle and length of the formation crack were similar to those of the dense area of microseismic events on the right side (for the large dense area of microseismic events on the left side of the fracturing interval, it was presumed that this was caused by the fracturing fluid channeled along the interface and connected to the larger natural cracks in the formation). In summary, it can be considered that the theoretical calculation results of the interface crack and zigzag crack based on the aforementioned model were within the allowable error range, and the model calculation results were in good agreement with the measured data, which proves that the model was accurate.
Analysis of influencing factors of crack propagation
The failure of the sealing integrity and the propagation of the crack were affected by multiple factors. Therefore, to ascertain the influential rules of the various influencing factors, research and analysis were conducted based on the above models and shale oil well conditions.
Influence of fracturing parameter and mechanical properties
Internal casing pressure
The internal casing pressure during fracturing is usually between 60 and 90 MPa. Herein, we analyzed the influence of pressure change on the crack length by changing the internal casing pressure.
Since the other parameters remain unchanged during the analysis, as the internal casing pressure increased, the interface still failed first, followed by the crack zigzag propagation, indicating that the sealing integrity failure mode was the second compound failure.
The propagation length and direction of the zigzag crack were analyzed by the method in Section 2, as shown in Figure 9. First, equation (4) was used to judge whether the zigzag crack propagation behavior will occur under the calculated pressure. If the propagation conditions of the zigzag crack were satisfied, equation (6) was used to calculate the propagation length and direction of the zigzag crack in the single-sided material. Then, calculate the SIF of the zigzag crack in each calculation step by the method in Section 2.4 (for the fracture angle of the zigzag crack in each calculation step, it can be calculated by equation (7)), until the zigzag crack stops propagating. Finally, the number of calculation steps (n) was multiplied by the initial crack length (a0) to obtain the results shown in the figure.

Relationship between the zigzag crack of formation and pressure.
It can be seen that in Figure 9, the zigzag crack length increased as the internal casing pressure increased, and the propagation of the crack perpendicular to the wellbore direction was greater than in the wellbore direction. In addition, it was also found that the propagation direction of the zigzag crack did not change with the internal casing pressure. The specific influencing factors of the zigzag propagation direction will be analyzed in Section 4.2.
The calculation method of the interface crack propagation length under different internal casing pressures was the same as that of the zigzag crack. First, used equation (3) to judge whether the interface crack propagates; then, used the iterative calculation method in Section 2.4 to calculate the number of steps (n) for the interface crack to propagate forward; finally, the interface crack propagation length was n × a0. The propagation lengths of the interface crack and zigzag crack under different internal casing pressure were shown in Figure 10. It was seen that the propagation length of the interface and zigzag cracks were proportional to the internal casing pressure. Additionally, under lower internal casing pressure, the zigzag crack in the formation eventually propagated longer than the interface crack; as the pressure increased, the interface crack length became larger than the zigzag crack.

Influence of the internal casing pressure on the interface crack and zigzag crack.
Therefore, given that the relatively low internal casing pressure effectively controls the crack length, it is necessary to design the internal casing pressure during fracturing, especially for the interface crack, to shorten the crack propagation length.
Young’s modulus
The Young’s modulus of the materials (cement sheath, formation) on both sides of the interface crack was one of the main factors affecting the stress field of the crack tip. The Young’s modulus of shale reservoirs ranged between 20 and 50 GPa, Simultaneously, shale oil wells require the cement sheath to exhibit high strength and low elasticity to prevent mechanical integrity failure 41 or uncoordinated deformation, which in turn could result in interface microannular gaps. 9 However, only a few studies have involved the Young’s modulus and interface hydraulic sealing integrity.23,27 Therefore, we conducted the analysis and calculation of the influence law of Young’s modulus on the failure mode and crack propagation. Only the Young’s modulus of the cement sheath and the formation were changed during the analysis, while the other parameters remained unchanged.
Figure 11 shows the effect of changing the Young’s modulus on the SIF difference. It was seen that during pressurization, the cracks propagated in both the interface and one-sided material. When the Young’s modulus of the cement sheath was 5 GPa, the zigzag crack propagated first, and the SIF of the interface crack reached the critical condition of fracture. At this point, the sealing integrity failure mode was the third mode. When the Young’s modulus of the cement sheath increased to over 10 GPa, the interface fractured and failed firstly, and the crack twisted into the single-sided material. Herein, the sealing integrity failure mode changed to the second mode. Conversely, the Young’s modulus of the formation showed an opposite effect on the failure mode. Under low Young’s modulus, the interface crack was more likely to propagate. However, as the Young’s modulus of the formation increased, the crack underwent zigzag propagation. Therefore, as the Young’s modulus of the formation increased, the failure mode of the hydraulic sealing integrity gradually changed from the second mode to the third mode. The above phenomenon was due to Young’s modulus significantly influenced the failure mode of the hydraulic sealing considering the changes in Young’s modulus changed the radial stress at the cement sheath-formation interface, which in turn affected the SIF of the crack tip stress field, resulting in changes in the failure mode of the seal integrity.

During pressurization, the Young’s modulus affects the change of SIF difference: (a) influence of the cement sheath Young’s modulus and (b) influence of the formation Young’s modulus.
By calculating the propagation direction and length of the zigzag crack under different Young’s modulus (Figure 12), it was observed that the fracture angle of the zigzag crack was distributed between −60° and −80°, indicating that the zigzag crack propagated in the direction of the formation. Simultaneously, as the Young’s modulus of the cement sheath increased, the fracture angle of cracks first decreased and then increased. Furthermore, as the Young’s modulus of the formation increased, the crack propagation length in the formation also increased along the vertical and horizontal directions of the wellbore.

Influence of Young’s modulus on the propagation direction and length of the zigzag cracks: (a) influence of the cement sheath Young’s modulus and (b) influence of the formation Young’s modulus.
Figures 13 and 14 show the influence of Young’s modulus on the propagation length of interface and zigzag cracks, respectively. The cool and warm colored areas represent the shorter and longer crack propagation lengths, respectively. In addition, as shown in Figure 14, the shaded part represents the propagation of the zigzag crack into the cement sheath. The influencing factors and propagation law will be studied in detail in the later section.

Influence of Young’s modulus on the interface crack propagation length.

Influence of Young’s modulus on the zigzag crack propagation length.
As shown in Figure 13, as the Young’s modulus of the cement sheath increased, the interface crack propagation length first increased and then decreased. Meanwhile, the high points of the crack length were all located in the interval where the Young’s modulus ratio of the cement sheath to the formation was between 0.28 and 0.32. On the left of the interval, as the Young’s modulus of the formation increased, the crack propagation length decreased, whereas, on the right of the interval, the crack propagation length gradually increased.
The main reason for the above-mentioned nonlinear law is that as the Young’s modulus of the cement sheath became closer to the formation, their performance became similar to the same material, making it difficult for the interface crack to propagate. Therefore, under constant Young’s modulus of the formation, as the Young’s modulus of the cement sheath increased, the crack length decreased. Conversely, as the Young’s modulus of the cement sheath decreased, the difference between the mechanical properties of the formation and the cement sheath increased. Furthermore, the bi-material constant ε changed owing to its influence, thereby increasing the interface crack SIF and resulting in an increase in the interface crack propagation length. However, the SIF was not only affected by the material properties but also by the crack tip stress field. When the Young’s modulus of the cement sheath decreased, the normal stress distributed on both sides of the interface decreased, resulting in a decrease in the SIF. During modeling and calculation, only a few “modeling-deleting-remodeling” were needed to reach the boundary conditions, and reducing the number of iterative calculations indicated that the length of crack propagation decreased. Under the working conditions considered in this study, the crack propagation length was significantly affected by the difference in the mechanical properties of the cement sheath and the formation to the right of the interval. Conversely, the crack length was significantly affected by the stress at the crack tip to the left of the interval. Under this dual influence, the interface crack propagation length first increased and then decreased, before finally forming the change rule shown in Figure 13.
As shown in Figure 14, as the cement sheath Young’s modulus increased, the length of the zigzag crack decreased. However, under a low Young’s modulus of the formation, a high Young’s modulus of the cement sheath may lead to changes in the propagation direction of the zigzag crack.
Therefore, under the conditions of this study, when the formation exhibits a low Young’s modulus (<30 GPa), the Young’s modulus of the cement sheath should be appropriately increased to over 10 GPa to decrease the interface crack propagation length. If the Young’s modulus of the shale oil well formation is over 30 GPa, the mechanical properties of the existing cement sheath (≤8 GPa) can be maintained considering the interface crack length is significantly affected by the crack tip stress field. At this point, the crack length can be decreased by using the pressure in the casing rather than the material properties. For zigzag cracks, it is necessary to understand that the fractures are not turned to the cement sheath considering it could be regarded as beneficial for the reconstruction effect of the reservoir during fracturing.
Poisson’s ratio
Poisson’s ratio was also one of the important mechanical parameters. Herein, we analyzed the influence of the Poisson’s ratio on the sealing integrity failure mode and crack propagation length by changing the Poisson’s ratio of the cement sheath and the formation while keeping the other parameters of the model unchanged.
As shown in Figure 15(a), as the cement sheath Poisson’s ratio increased, the failure mode of the sealing integrity changed from the third mode to the second mode. For the influence of the formation Poisson’s ratio (Figure 15(b)), the failure mode was always the composite failure of the second mode.
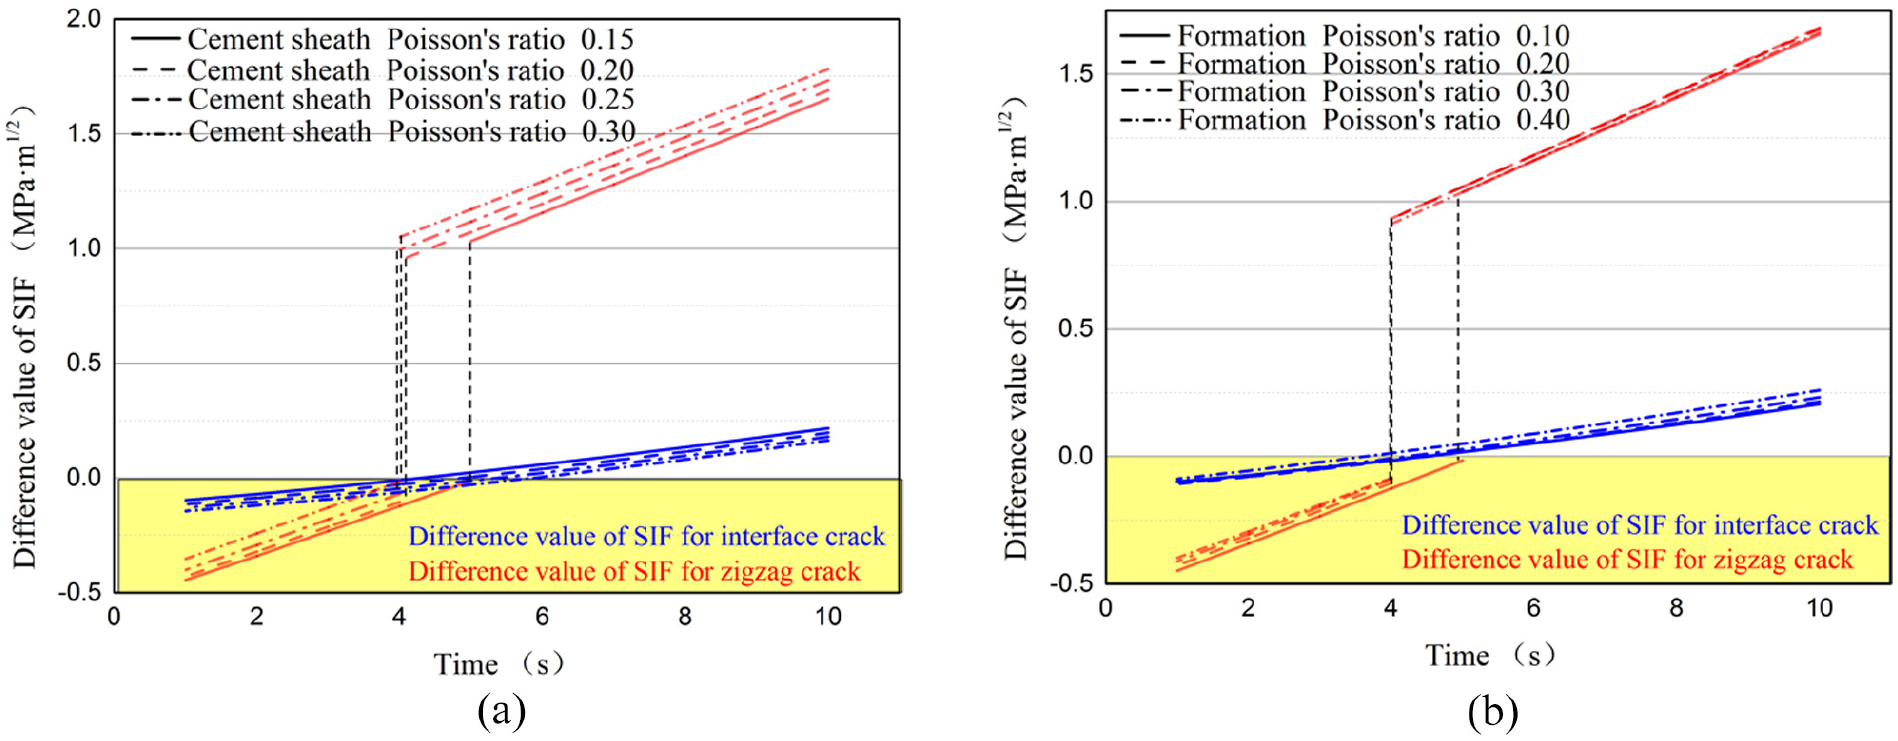
During pressurization, the Poisson’s ratio affects the changes in the SIF difference: (a) influence of the cement sheath Poisson’s ratio and (b) influence of the formation Poisson’s ratio.
As shown in Figure 16, the calculated fracture angle of the zigzag crack was always negative, indicating that under different Poisson’s ratios, the crack extended only along the formation. As the Poisson’s ratio of the cement sheath increased, both the formation crack length perpendicular to and along the wellbore increased. Furthermore, the formation Poisson’s ratio had little effect on the fracture angle and propagation length in different directions.

Influence of Poisson’s ratio on the propagation direction and length of zigzag cracks: (a) influence of the cement sheath Poisson’s ratio and (b) influence of the formation Poisson’s ratio.
We further analyzed the influence of Poisson’s ratio on the crack propagation length. As shown in Figures 17 and 18, the interface crack decreased as the cement sheath Poisson’s ratio increased. However, under constant cement sheath Poisson’s ratio, the interface crack first decreased and then increased as the formation Poisson’s ratio increased. We observed that the change of Poisson’s ratio simultaneously affected the normal stress at the interface and the bi-material constant ε, which ultimately affected the interface crack SIF resulting in the above changes. As the Poisson’s ratios of the formation and cement sheath decreased and increased, respectively, the length of the zigzag crack increased. However, this was beneficial to the effect of fracturing considering the zigzag crack propagated along the formation direction. Therefore, in an actual well, a cement sheath with a higher Poisson’s ratio can be used to limit the interface crack length.

Influence of Poisson’s ratio on the interface crack propagation length.

Influence of Poisson’s ratio on the zigzag crack propagation length.
Discussion on the direction of zigzag crack
By calculating the sealing integrity failure mode and crack propagation length of the shale oil X well and analyzing their influencing factors, we found that the crack mainly propagated along the formation direction. However, there was still a possibility occurred that the zigzag crack entered the cement sheath, resulting in damage and failure of the mechanical integrity of the cement sheath.
After further analysis of the above calculation process and results, we found that the bi-material constants ε calculated by the mechanical properties of the cement sheath and the formation were all positive under the condition that the model assumed the cement sheath and the formation to be materials 1 and 2, provided the bi-material constant ε was positive (ε was a constant between 0 and 1 42 ). However, for some special values, the bi-material constant ε may be negative even under the original assumptions. Herein, it was necessary to assume that the formation and cement sheath were materials 1 and 2, respectively. We recalculated the bi-material constant ε, where ε was a positive value, and continued using this method to calculate the fracture angle. If the obtained fracture angle was negative, it would indicate that the zigzag crack would propagate in the direction of the cement sheath. For the above-mentioned problems, the following calculation and analysis work were carried out in this section.
Influence of the mechanical properties of the materials on ε
While keeping the Poisson’s ratio and Young’s modulus of the cement sheath unchanged, as shown in Table 1, we calculated the bi-material constant ε as the different formation Young’s modulus and Poisson’s ratio. Figure 19 shows the result. Under the above conditions, the bi-material constant ε of any change in the mechanical properties of the formation were all positive (the colored part in Figure 19). Simultaneously, the bi-material ε constant increased as the Young’s modulus and Poisson’s ratio of the formation increased.

Influence of the formation Young’s modulus and Poisson’s ratio on the bi-material constant ε.
Keeping the Young’s modulus and Poisson’s ratio of the formation unchanged, we calculated the effect of the cement sheath Young’s modulus and Poisson’s ratio on the bi-material constant ε. Figure 20 shows the results. Under the constant Poisson’s ratio, the bi-material constant ε decreased as the Young’s modulus of the cement sheath increased. Furthermore, under constant Young’s modulus, the bi-material constant ε increased as the Poisson’s ratio of the cement sheath decreased. The dotted line in Figure 20 (E − 57v + 30.57 = 0) indicates that the bi-material constant ε was zero, where v and E were the Poisson’s ratio and Young’s modulus (GPa) of the cement sheath, respectively. However, the bi-material constant ε was negative in the upper part of the dotted line. At this point, it was necessary to redefine materials 1 and 2 based on the assumed conditions considering the zigzag crack could propagate along the cement sheath.

Influence of Young’s modulus and Poisson’s ratio of the cement sheath on the bi-material constant ε.
Calculation of the cement sheath zigzag crack
Herein, we consider the Poisson’s ratio and the Young’s modulus of the cement sheath when the bi-material constant ε is negative and keep the mechanical properties of the formation unchanged. Table 4 summarizes the specific parameters. At this point, the bi-material constant was −0.0025.
Mechanical properties of cement sheath and formation.
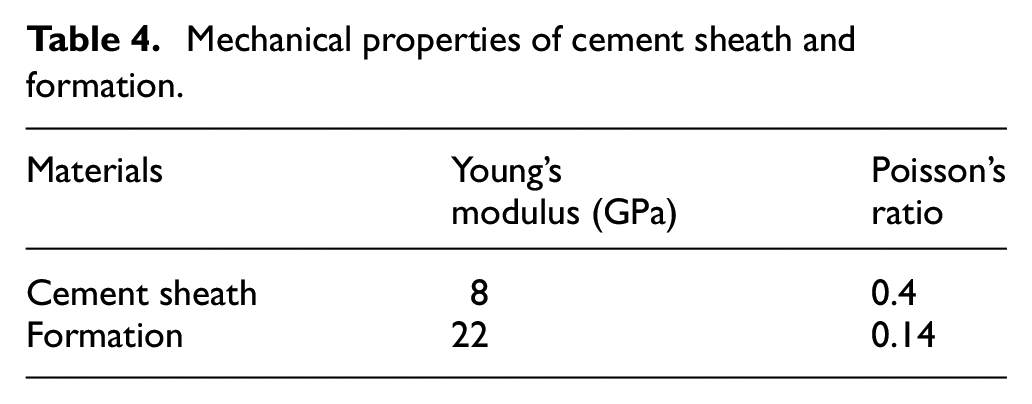
We put forward a new hypothesis, referring to the formation as material 1 and the cement sheath as material 2, while the other assumptions remain unchanged. According to equation (2), the bi-material constant ε was positive. Figure 21 shows the crack propagation length. The fracture angle of the zigzag crack was negative, indicating that the crack propagated in the direction of the cement sheath. The crack eventually propagated to the inner wall of the cement sheath and stopped. At this point, the mechanical integrity of the cement sheath had failed. In addition, the interface crack propagated along the horizontal direction of the wellbore, reaching a final propagated length of 90 m.

(a) Zigzag crack propagation direction. (b) Interface crack propagation length.
The analysis in Section 4.1 showed that a higher Young’s modulus and Poisson’s ratio of the cement sheath can decrease the interface crack length. However, the calculations in Section 4.2.1 demonstrate that a high Poisson’s ratio and Young’s modulus of the cement sheath can significantly decrease the bi-material constant ε. Furthermore, it can cause the bi-material constant ε to be negative and the zigzag crack to propagate to the cement sheath, resulting in the failure of the mechanical integrity of the cement sheath. Therefore, when designing the mechanical performance parameters of the cement sheath, it is essential to consider its impact on the interface crack and ensure that the bi-material constant between the cement sheath and the formation is always positive. Based on the initial assumptions, the propagation of the zigzag crack along the cement sheath can be avoided if the Young’s modulus and Poisson’s ratio of the cement sheath satisfy E − 57v + 30.57 ≤ 0. In addition, as shown in Figure 20, if the Poisson of the cement sheath is relatively high, its Young’s modulus should be reduced to prevent the propagation of the zigzag crack to the cement sheath.
Conclusion
In this study, we developed an analysis method of hydraulic seal failure of cement sheath interface under temperature and pressure conditions. Based on the above research, we analyzed the failure modes of sealing integrity and explored the propagation law and factors influencing the interface and zigzag cracks. The following conclusions were drawn:
Based on the hydraulic sealing model, the calculation results showed that the failure mode of the Well X interface is a compound failure; the interface crack is the main reason for the transfer of microseismic events; the zigzag crack generated during fracturing will propagate toward the formation; the calculated results are similar to the measured microseismic transfer distance, which proves the accuracy of the model;
Under the constant formation Young’s modulus, with the increase of the Young’s modulus of cement sheath, the interface crack length first increases and then decreases; in the interval of 0.28–0.32 where the ratio of Young’s modulus of the cement sheath to the formation, the interface crack length is the longest. If the formation has a higher Young’s modulus, the interface and zigzag cracks length tend to be longer;
The interface crack decreases with the increase of the Poisson’s ratio of the cement sheath, and the influence of the formation Poisson’s ratio on the interface crack is opposite it; as the Poisson’s ratio of the formation increases and the Poisson’s ratio of the cement sheath decreases, the length of the zigzag crack decreases. Reducing the internal casing pressure is also beneficial to shortening the interface and zigzag cracks length;
The mechanical properties of the cement sheath can affect the direction of the zigzag crack, whereas the influence of the formation properties on the crack direction is negligible. When designing the Young’s modulus and Poisson’s ratio of the cement sheath, satisfying E − 57v + 30.57 ≤ 0 can avoid propagation of the zigzag crack along the cement sheath.
Footnotes
Appendix A
Appendix A shows the expression of the fracturing load P in Figure 4(b).
The fracturing load at the interface crack comprises pump pressure, liquid column pressure, streamwise fiction, and friction in the crack, and is expressed as:
where
Appendix B
Appendix B demonstrates the establishment and solution process of the wellbore temperature model during fracturing.
We assume the micro-unit length of the fracturing fluid in the wellbore to be dz. According to the law of conservation of energy, the thermal energy, kinetic energy, pressure energy, potential energy, and internal energy of micro-unit per unit time can be expressed as:
where
The pressure energy of the fracturing fluid during the pumping process from the wellhead to the well bottom can be decomposed into gravity and friction pressures, expressed as:
where
where
According to Blasius formula, the relationship between Reynolds number and dimensionless friction coefficient is given as:
where
The drag reduction ratio coefficient is a function of the thickening agent and propping agent volume fractions:
where
The thermal energy transfer in the wellbore is considered as steady-state heat transfer, and heat exchange in the formation. According to the law of conservation of radial heat flux, the following expression can be obtained:
where,
where
The dimensionless formation temperature is expressed as:
where
From equations (B6), (B7), and (B8), the radial heat flux expression can be obtained as:
During calculation, the wellhead fracturing fluid temperature is assumed to be known, and we can obtain the fracturing fluid temperature expression at any position in the tubing can as:
where A is a parameter,
where
According to factors such as well structure and return height of cement slurry, the wellbore is segmented from the wellhead to the well bottom, and based on the continuity conditions, the fracturing fluid temperature at the outlet of the previous section is considered equal to the inlet temperature of the next section. Through iterative calculation, we can obtain the temperature of the fracturing fluid when pumped to the bottom of the well.
The temperature distribution of the cement sheath can be obtained as:
where
Appendix C
Appendix C demonstrates the expression of stress σ r shown in Figure 4(a).
The stress distributed at the interface comprises
where
The radial temperature difference stress and displacement affected by the temperature difference is expressed as:
where α: linear expansion coefficient (1/°C); t: temperature difference (°C);
Under wellbore conditions, the casing, cement sheath, and the formation are in close contact, indicating that the radial thermal stress and displacement are continuous. Meanwhile, the inner wall of the casing and the outer wall of the formation are free to deform, and the radial temperature difference stress becomes 0. Therefore, the continuity condition can be characterized as:
where
By solving
Based on elastic mechanics, radial stress and displacement of the cylinder affected by the internal and external pressures can be expressed as:
where
Similarly, under wellbore conditions, the casing, cement sheath, and the formation are close. The continuity condition can be expressed as:
where
By solving the above expression, we obtain the radial stress
Handling Editor: Chenhui Liang
Declaration of conflicting interests
The author(s) declared no potential conflicts of interest with respect to the research, authorship, and/or publication of this article.
Funding
The author(s) disclosed receipt of the following financial support for the research, authorship, and/or publication of this article: The authors gratefully acknowledge the financial support provide by the Research Project of Dagang Oilfield (DGYT-2018-JS-244), the National Natural Science Foundation of China (5157041530), and the China Postdoctoral Science Foundation (2020M673575XB).