
Abstract
To reveal the error generation, transmission, and accumulation process, a comprehensive error analysis model is proposed in this paper; furthermore, the model is used to determine the influence on the transmission error and the error sensitivity of a planetary roller screw mechanism (PRSM). After error source analysis, the differential error vector and matrix are used to express the small errors because the magnitude of all errors in the PRSM is relatively small. To comprehensively consider the error coupling relationship between thread structure errors and gear structure errors, error flow models of the PRSM components are established. On this foundation, transmission error characterization model and error sensitivity evaluation model are also established. Finally, error values and transmission error are measured, and the sensitivity of each error to the transmission error is calculated. The results show that the transmission error is periodic and fluctuate with screw rotation. The component eccentric errors, pitch errors, and thread clearance have obvious influence on the transmission error, so they should be limited emphatically.
Keywords
Introduction
A planetary roller screw mechanism (PRSM) is a type of precision mechanical transmission mechanism. Its main function is to realize the mutual conversion of rotary motion and linear motion. The PRSM has two kinds of transmission pairs named the thread pair and the gear pair, so the error sources are complex and will have a great influence on the transmission accuracy of the PRSM. Therefore, it is important to establish a comprehensive error analysis model to reveal the error generation, transmission and accumulation process, and this model is the basis for further analyses, such as the dynamics, wear and operation life. Furthermore, improving the transmission accuracy of the PRSM is of important engineering significance. The research object of this paper is a standard PRSM, as shown in Figure 1.
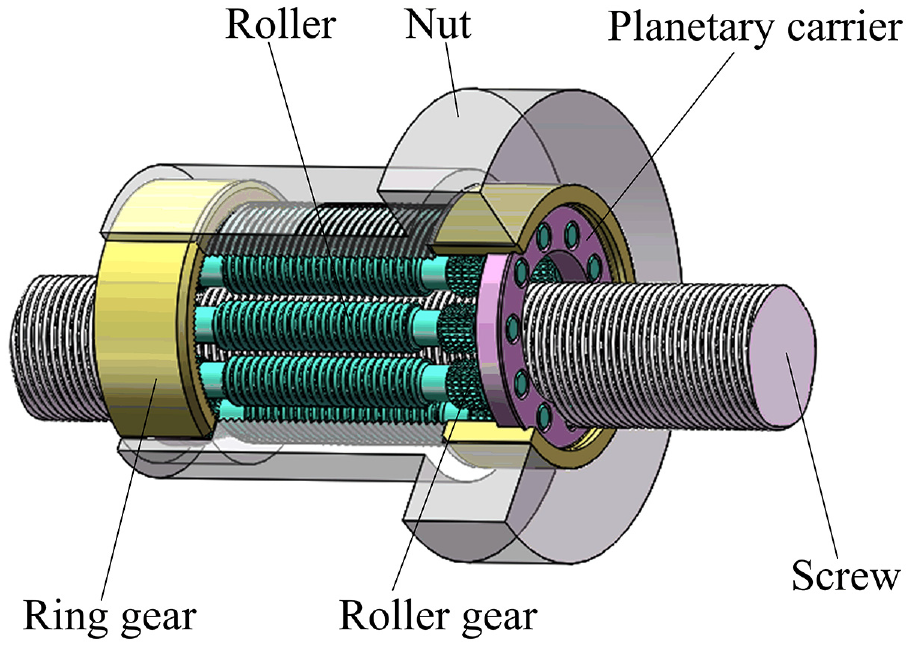
The schematic diagram of PRSM structure.
In recent years, the research on the PRSM has been further deepened. Some progress has been made in contact characteristics,1–3 friction and lubrication,4,5 dynamics 6 and so on. In addition, transmission error of the PRSM also needs to be researched.
In the study of error, Mamaev et al. 7 examined the effects of kinematic errors on the displacement of the PRSM. Their results showed that the PRSM kinematic errors are mainly due to geometric errors during the manufacturing of the contacting surfaces of the gear and the threaded surfaces. Fu et al. 8 developed a kinematics model with a component deviation error, and the results showed that the deviation error and the meshing clearance cannot be ignored when studying the transmission error. Ma et al. 9 established a PRSM transmission model considering the errors and elastic deformation. The results showed that the transmission error fluctuates with the rotation period of the screw and decreases with an increase of the working load. Du et al. 10 established mechanical models that incorporate radial load and machining error. The results show that the load distribution and fatigue life dramatically change with the variation in the machining errors. Zhang et al. 11 proposed a model to calculate the load distribution over the PRSM threads with pitch deviation. The experimental results showed that load distributions over the threads will fluctuate due to pitch deviations. When studying the differential error vector and error flow modeling, Hu and Koren 12 proposed the concept of “error flow.” Zhou et al. 13 used differential error vectors to characterize small errors in multi-process machining and proposed a modeling method for multi-process error flow models based on differential error vectors. When studying the characteristic model and evaluating sensitivity, Huang et al. 14 analyzed the error sources of the three-degree-of-freedom parallel mechanical structure and established a complete model of the final position space error using the space vector chain method. Wang et al. 15 used the Monte Carlo method to analyze the distribution characteristics and influence rules of the factors that affect an airborne optoelectronic system and calculated the sensitivity of each factor. The existing studies on error analysis provide effective references for PRSM error. However, the coupling relationship of the errors between the gear pair and the thread pair has not been studied, and the error evaluation needs to be further investigated.
To solve the problems mentioned above, a PRSM error source analysis and error representation method is proposed in Section 2. Section 3 uses the error flow model to couple the gear and the thread structure errors. In Section 4, the error sources and the transmission error are measured. In Section 5, the transmission error is calculated and the sensitivities of each error are analyzed.
Analysis of error source
The coordinate system and error source
Definition of the coordinate system
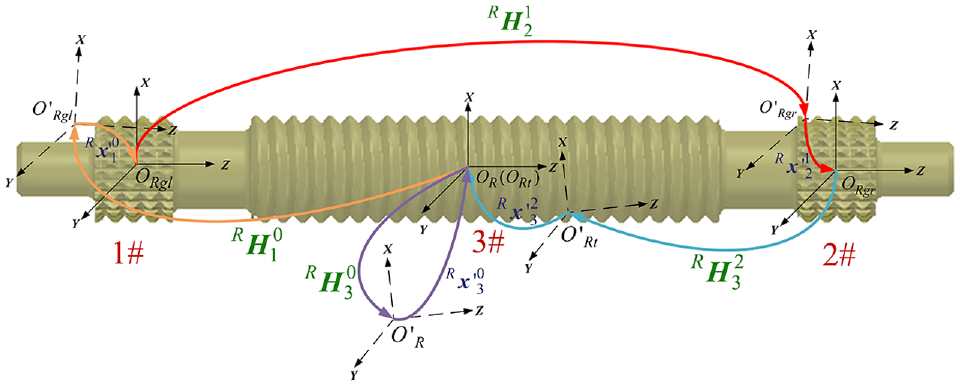
The position of the PRSM structures can be expressed using component coordinate systems and structure coordinate systems, as shown in Figure 2.

Definition of components and structures coordinate system: (a) screw, (b) roller, and (c) nut.
As shown in Figure 2(a), 1# represents the screw thread structure. As shown in Figure 2(b) and (c), 1# and 2# represent the gear structures, and 3# represents the thread structures of roller and nut thread structures.
The definitions of coordinate systems are as follows:
Component coordinate system. This system represents the position and direction of the nut, screw and roller, such as OS, OR and ON in Figure 2.
Structure coordinate system. This system represents the position and direction of the thread or gear structure on the component, such as ORt, ORgl, and ORgr in Figure 2. In particular, the thread coordinate system coincides with the component coordinate system.
Analysis of error source
The PRSM errors are caused by machining, assembling, wear, deformation, clearance and so on. Thread errors and gear errors have a great influence on the transmission error of the PRSM. The errors considered in this paper are shown in Table 1. In particular, the deviation and eccentric errors of components are defined as the thread segment errors relative to the shaft segment.
PRSM error source.

Some errors in the PRSM are shown in Figure 3.

Some errors in the PRSM: (a) Flank angle error (b) Thread pitch deviation and clearance (c) Gear phase error and meshing clearance (d) Deviation error and eccentric error.
Representation of small errors
The rotation of a rigid body around the X, Y, and Z axes can be represented by a rotation matrix. If the coordinate of a point on this rigid body is

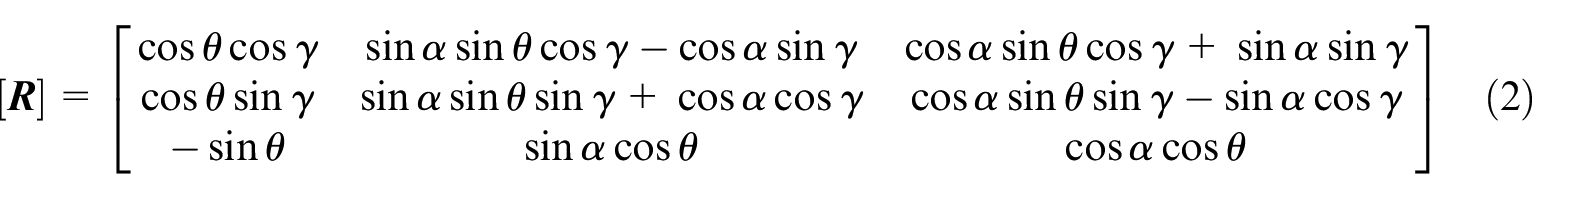
Because the magnitudes of all PRSM errors are relatively small, the elements in the matrix can be approximated.16,17 The matrix can be transformed into:

Using the concept of homogeneous transformation matrix, 16 small displacements in three directions are add, the matrix can be transformed into:
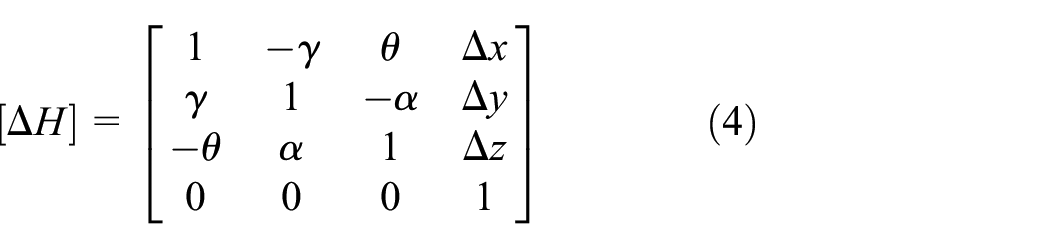
The meaning of Δx, Δy, Δz, α, θ, and γ is shown in Figure 4. In addition, this article only considers one roller, and assumes that it is installed in the positive X-direction of the screw coordinate system.

The meaning of Δx, Δy, Δz, α, θ, and γ.
The transmission of the PRSM mainly relies on thread meshing, but the errors of the gear structures will affect the thread meshing state, which will also cause the transmission error of the PRSM. As is shown in Figure 5, whether it is a screw, roller, or nut thread, when the eccentricity error Δx occurs, an axial displacement Δxtan(β + Δβ) of meshed component will appear in order to avoid interference. Because of the existence of helix angle, the eccentricity error Δy will also produce an axial displacement −Δytan(λ), and the axial displacements will be reflected in the transmission error. In addition, element


Axial movement caused by eccentric error: (a) Axial movement caused by X-direction eccentric error (b) Axial movement caused by Y-direction eccentric error.
where λ is the helix angle, n is the number of starts, β is the flank angle, and P is the pitch of components.
When the component is screw or nut, k = 1. When the component is roller, k is the ratio of screw revolution speed to roller revolution speed. In addition, the small errors of a component can also be expressed as the differential error vector Δ

Modeling of the error coupling
Screw error coupling analysis
As shown in Figure 6, only screw thread errors are involved in this analysis, and the component coordinate system of screw is OS. The differential error vector and matrix of screw thread structure 1# relative to the screw component coordinate system OS can be represented as


Error flow model of the screw.
where eS is the screw eccentric error and ΩS1 is its initial phase, φS is the screw deviation error and ΩS2 is its initial phase, ωS is the screw angular velocity, t is the running time, ΔPS is the screw pitch error, βS is the screw flank angle, and ΔβS is its error.
Roller error coupling analysis
There are both thread and gears on the roller. This section uses error flow model to explore the relationship that couples thread errors with gear errors. The roller has three structures, structures 1# and 2# are the gear structures, and structure 3# is the roller thread. The component coordinate system of the roller is OR. The relationship between the differential error matrix and the coordinate homogeneous transformation matrix can be seen in Figure 7.
(1) The conversion of the roller component coordinate system to the roller gear coordinate system 1# can be expressed as the following:

Error flow model of the roller.
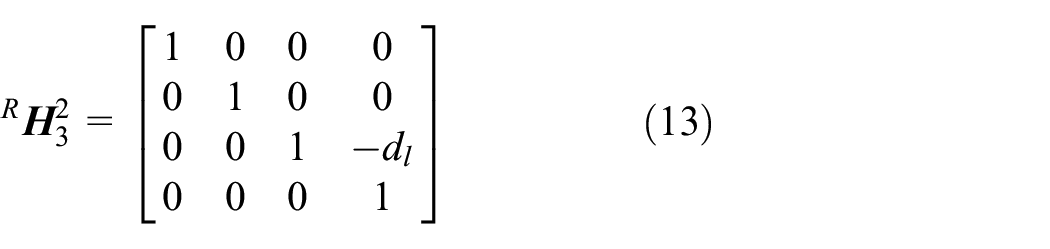
where dl is the linear distance from the roller component coordinate system to roller gear coordinate system 1# along the Z-direction.
Because roller gear 1# and roller gear 2# are processed through one clamping, the relative deviation and eccentric errors are extremely small and can be neglected. Therefore, we only consider the gear structure phase error around the Z-direction and its value is very small. However, the two ring gears are assembled separately with nut, so the value of phase error of them is relatively large. The differential error vector of roller gear coordinate system 1# relative to the roller component coordinate system can be expressed as the following:
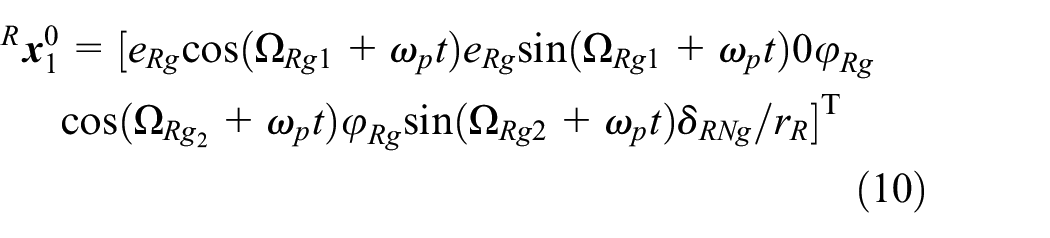
where eRg is the roller gear 1# eccentric error and ΩRg1 is its initial phase, φRg is the roller gear 1# deviation error and ΩRg2 is its initial phase, ωp is the roller angular velocity and δRNg is the meshing clearance between roller gear 1# and ring gear 1#, rR is the nominal radius of the roller.
(2) The conversion of roller gear coordinate system 2# to roller gear coordinate system 1# can be expressed as the following:

The differential error vector of roller gear coordinate system 2# relative to roller gear coordinate system 1# can be expressed as the following:

where Ω Rg is the phase error of roller gear 2# relative to roller gear 1#.
(3) The conversion of roller thread coordinate system 3# to gear coordinate system 2# can be expressed as the following:
The measurement of roller deviation and eccentric error is based on the component coordinate system, so the deviation and eccentric error of the roller gear need to be subtracted. The differential error vector of thread coordinate system 3# relative to roller gear coordinate system 2# can be expressed as the following:

where eR is the roller eccentric error and ΩR1 is its initial phase, φR is the roller deviation error and ΩR2 is its initial phase, ΔPR is the pitch error of the roller thread.
(4) The roller thread coordinate system coincides with the roller coordinate system, so the conversion of them can be expressed as the following:

The conversion of roller gear coordinate system 2# to roller gear coordinate system 1# can also be expressed as the following:

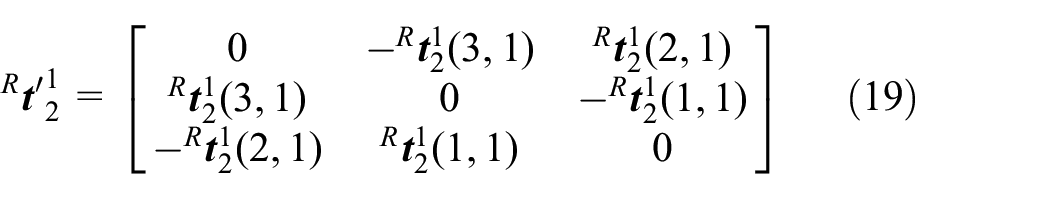
where
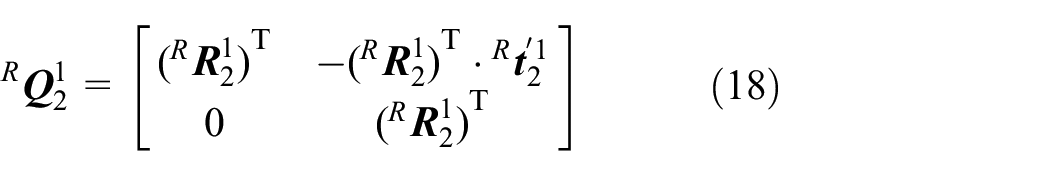
To couple the errors of structure 2# and structure 1#, we use kinematic analysis from robot kinematics.13,16 Therefore, we can obtain the coordinates of the error

In the equation above:
Similarly,

So the differential error matrix of roller can be obtained:

Therefore, the transformation matrix from the roller component coordinate system to the roller thread actual position coordinate system, which includes roller gear errors and thread errors, can be written as:

Nut error coupling analysis
As shown in Figure 8, the nut error coupling analysis is similar to the roller error coupling analysis, and the analysis process will not be repeated. It is worth mentioning that the deviation and eccentric errors of the nut and ring gears are not periodic. The error coupling matrix of nut thread errors and ring gear errors can be expressed as the following:


Error flow model of the nut.
Transmission error and error sensitivity analysis
The working load has an axial displacement relative to the screw coordinate system, and the theoretical axial displacement is nPωSt/2π. So we take the vector:

The working load has no axial displacement relative to the roller or nut coordinate system, so we take the vector:

The meshing clearance of the PRSM is also need to be considered, so we take the vector:

Comprehensively consider the influence of the screw, roller, and nut errors, the working load displacement vector contains each error source can be expressed as:

The axial displacement is the only thing we consider, so the transmission error can be expressed as:

Differentiate each error in ΔT, and then we can get the differential coefficients of each error to the transmission error at a certain time. We can also integrate the time variable in ΔT first, thus we can get the error differential coefficients in a period of time.

Finally, through the equation (30), we can obtain the error sensitivity coefficient μj. It reflects the contribution degree of each error to the transmission error.
Measurement and experiment of the errors
Measuring instrument
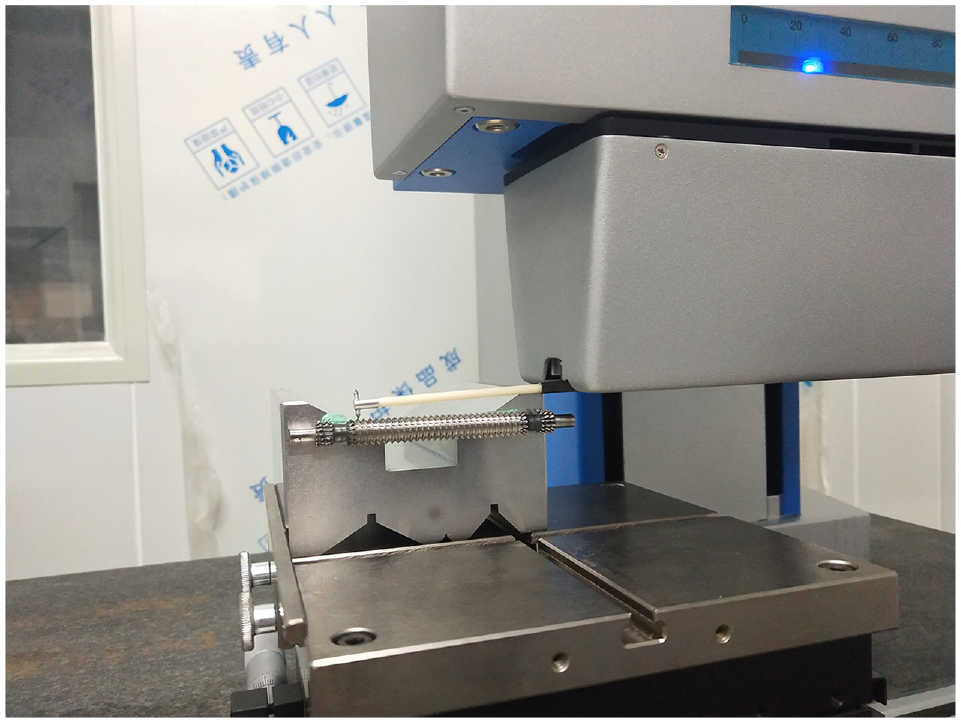
The PRSM errors are statically measured with a contact profiler. The profile is measured by the slip between the probe and the measured surface. The measurement accuracy of the contact profiler used in this study is less than 1 μm, as shown in Figure 9.

Profilometer measurement setup.
The transmission error of the PRSM is measured with a test rig, as shown in Figure 10. The transmission error is based on the counting method and measured by using the principle of the absolute value comparison of synchronous displacement. The screw is driven by a motor, the angular displacement of the screw is measured by a circular grating and the axial displacement of the nut is measured by a linear grating ruler.

Test rig of transmission error.
Error source
The theoretical design parameters of the tested components are shown in Table 2.
PRSM parameters.

The roller measurement process, as an example, is shown in Figure 11. The upper and lower profiles of the roller thread structure and shaft segment are measured, and subsequently, the profile lines are obtained. The required parameters are marked, and the required error values are obtained.
Roller profile measurement.
Flank angle error and pitch error
Figure 12 shows the measurement result of flank angles and pitches. Theoretically, the thread at the maximum pitch contacts first, so flank angle error is calculated by the average flank angle and pitch error is calculated by the maximum pitch.
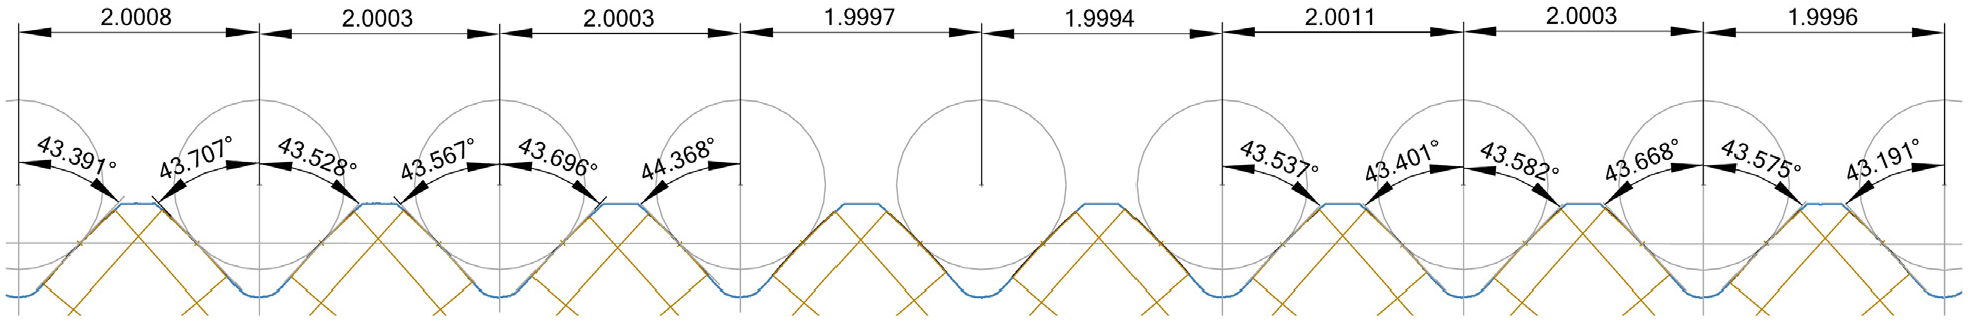
Measurement result of roller flank angles and pitches.
Component deviation and eccentric error
Because the deviation and eccentric errors of components are directional, it is necessary to measure errors in different directions and select the maximum value. Figure 13 shows one of the measurement results.

Measurement results of the roller deviation.
As shown in Figure 13, theoretical axis is the axis of the shaft segment and actual axis is the axis of the thread segment. Roller deviation error is the angle between the actual axis and the theoretical axis, and roller eccentric error is the radial distance between the actual axle center and the theoretical axle center.
Other errors
Gear error measurement is difficult, and there is a lack of relevant test instruments. However, some studies have considered some gear errors,18–20 so this work directly sets the error values and uses them in the model for calculation. The relevant error data are shown in Table 3.
Summary of error values.

The function of thread clearance and gear structure meshing clearance are similar. They are reserved to prevent the structure from being stuck due to thermal expansion and leave space for grease. The thread clearance and gear structure meshing clearance can be found in design drawings.
All the error values considered in the article are arranged in Table 3.
Transmission error
As shown in Figure 10, the angular displacement of the screw can be collected by the circular grating, and the axial displacement of the nut can be collected by the linear grating ruler. Through the measured angular displacement, the nut theoretical axial displacement can be calculated, and the differential value between the actual axial displacement and the theoretical axial displacement is defined as the transmission error. The angular displacement and axial displacement can be obtained through the real-time measurement, so the transmission error can be obtained through the real-time calculation. The calculation of the real-time transmission error can be expressed as:
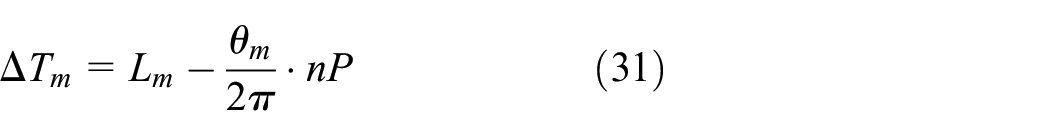
where ΔTm is the real-time transmission error, Lm is the real-time axial displacement, and θm is the real-time angular displacement.
The experiment result of the transmission error is shown in Figure 14. It can be seen from the experiment result that the transmission error is obviously periodic, and the period is the same as the screw rotating period. The amplitude is about 0.12 mm, and the fluctuation range is about −0.06 to 0.06 mm. The experiment result provides a comparative reference for the theoretical transmission error, and it is an important basis for verifying the rationality of the theoretical model.

The experiment result of the transmission error.
Calculation results of the error model
Transmission error
The screw rotating speed ωS set in the experiment is 48 rpm. Substituting the error values in Table 3 into equation (28), then the theoretical transmission error curve can be obtained. The curve of the transmission error is shown in the Figure 15.

Theoretical transmission error.
Comparing the theoretical curve in Figure 15 and the experimental curve in Figure 14, it can be seen that the theoretical transmission error and the experimental transmission error have a good coincidence, so the transmission error model established in this paper is reasonable. The transmission error is obviously periodic and similar to the sine function, and the period is the same as the screw rotating period. The amplitude is about 0.12 mm, and the fluctuation range is about −0.05 to 0.07 mm.
Figure 16 shows the transmission error influenced by component errors. It can be seen that the transmission error influenced by the screw errors is periodic, and the period is the same as the screw rotating period. The transmission error influenced by the roller errors is periodic, and the period is the same as the roller rotating period. The transmission error influenced by the nut errors is not fluctuant, because the nut only has translational movement. The transmission error of the PRSM can be seen as the superposition of the influence caused by the screw, the roller, and the nut errors.
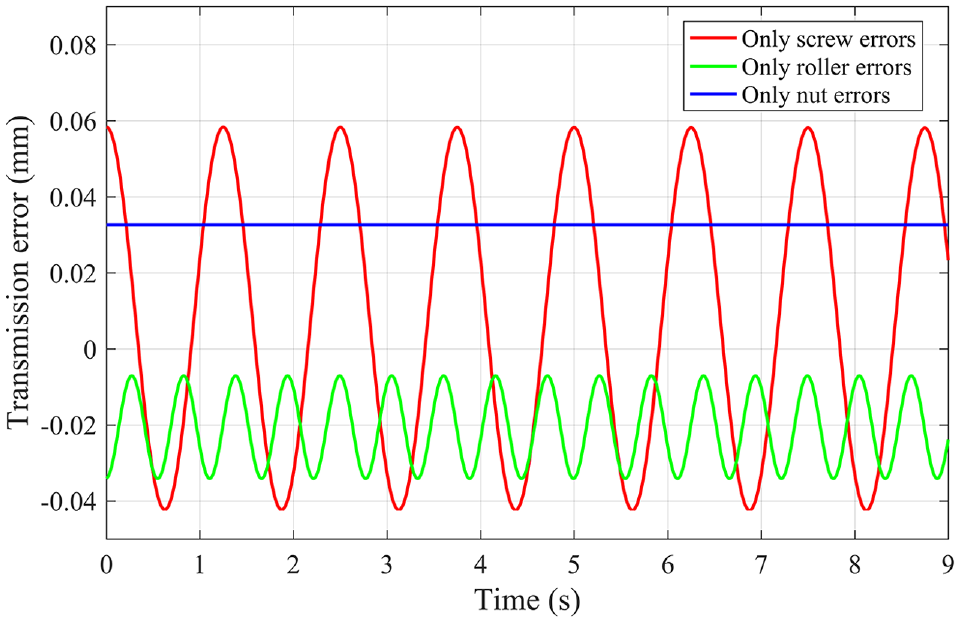
Transmission error influenced by component errors.
Figure 17 shows the transmission error influenced by component eccentric errors. It can be seen that the error curves is similar to Figure 16, so we can make a conclusion that the fluctuation of the transmission error is mainly from component eccentric errors. The eccentric errors of components have great influence on the transmission error, and it’s necessary to limit the eccentric errors of components to reduce the transmission error.

Transmission error influenced by component eccentric errors.
Figure 18 shows the transmission error influenced by component deviation errors. It can be seen that the roller deviation error and the nut deviation error have no influence to the transmission error, because the load has no axial displacement relative to the roller or nut. The screw deviation error has a little influence on transmission, and the influence is linear. With the load moves away from the screw coordinate system, the transmission error becomes greater and greater, and the actual displacement becomes smaller than the theoretical displacement.

Transmission error influenced by component deviation errors.
Figure 19 shows the transmission error influenced by gear structure errors. It can be seen that the curves are similar to Figure 16, because the roller gears follow the roller to rotate, and the ring gears follow the nut to translate. The movement regularities of the gear structures are the same as the components, so the error curves are similar. However, the errors of gear structures are smaller than that of components, so the influence on the transmission error is not obvious.

Transmission error influenced by gear errors.
As shown in Figure 20, take the transmission error influenced by roller errors as an example, different flank angle errors will cause different influence on transmission error. When the flank angle error is negative, the transmission error becomes smaller. Inversely, when the flank angle error is positive, the transmission error becomes bigger.

Roller transmission error influenced by the flank angle error.
In addition to the errors mentioned above, according to Eq. (28), pitch errors and thread clearance will be directly superposed to the transmission error.
Sensitivity analysis
Bring the error values in Table 3 into equation (30), the error sensitivity coefficients at different time points can be obtained. In order to evaluate the sensitivity coefficients of each error during a period of time, we take the least common multiple of the rotation period of the screw and roller to integrate the time variable. The integration interval is 0–5 s and the calculated result is shown in Figure 21.

Error sensitivity coefficient during 0–5 s.
From the calculated result, it can be easily observed that some errors have no influence on the transmission error, such as the screw and roller eccentric errors, gear structures eccentric errors, and roller gears deviation error. After analysis, the errors mentioned above are periodic, so the influence to the transmission error can be counteracted in a complete period. The deviation errors of the roller and nut have no influence on the transmission whether they are periodic or not, as shown in Figure 18. The flank angle errors of the screw and roller also have no influence on the transmission error, because they are related to the eccentric errors which are periodic, as shown in equation (5).
Among the errors which have influence on the transmission error, the ring gear deviation error has the highest sensitivity coefficient and account for 29.5%. However, the values of gear structure deviation errors are very small generally, so the actual influence on the transmission error can be neglected. The deviation error of the screw has low sensitivity coefficient and the value is also small, so it can also be neglected. The phase errors of the ring gear and roller gear account for 15.5% and 6.9%, so the consistency of the ring gear phase need to be noticed during assembly. The pitch errors of components and the thread clearance all account for 9.8%, they directly superposed to the transmission error and the values are relatively bigger, so they should be limited emphatically. The deviation error of the nut accounts for 6.4% and the value is also relatively bigger, so it also should be limited emphatically. The gear structure meshing clearance accounts for 1.7%, so it should be limited to a certain extent. The nut flank angle error accounts for 0.4%, and the negative value can reduce the transmission error, so the manufacturing tolerance is recommended to be set to a negative value.
As shown in Figure 22, the errors which are periodic have different sensitivity coefficients at different time points. The meshing state of threads ultimately determines the accuracy of transmission. The gear structure deviation errors account for the largest proportion, because the deviation errors of gear errors will influence the thread meshing state. However, we can find a phenomenon that the eccentric errors of gear structures have no influence on transmission error. After analysis, the reason is that the meshing state of eccentricity is directly decided by component eccentric errors, and gear structure eccentric errors will not influence the meshing state.
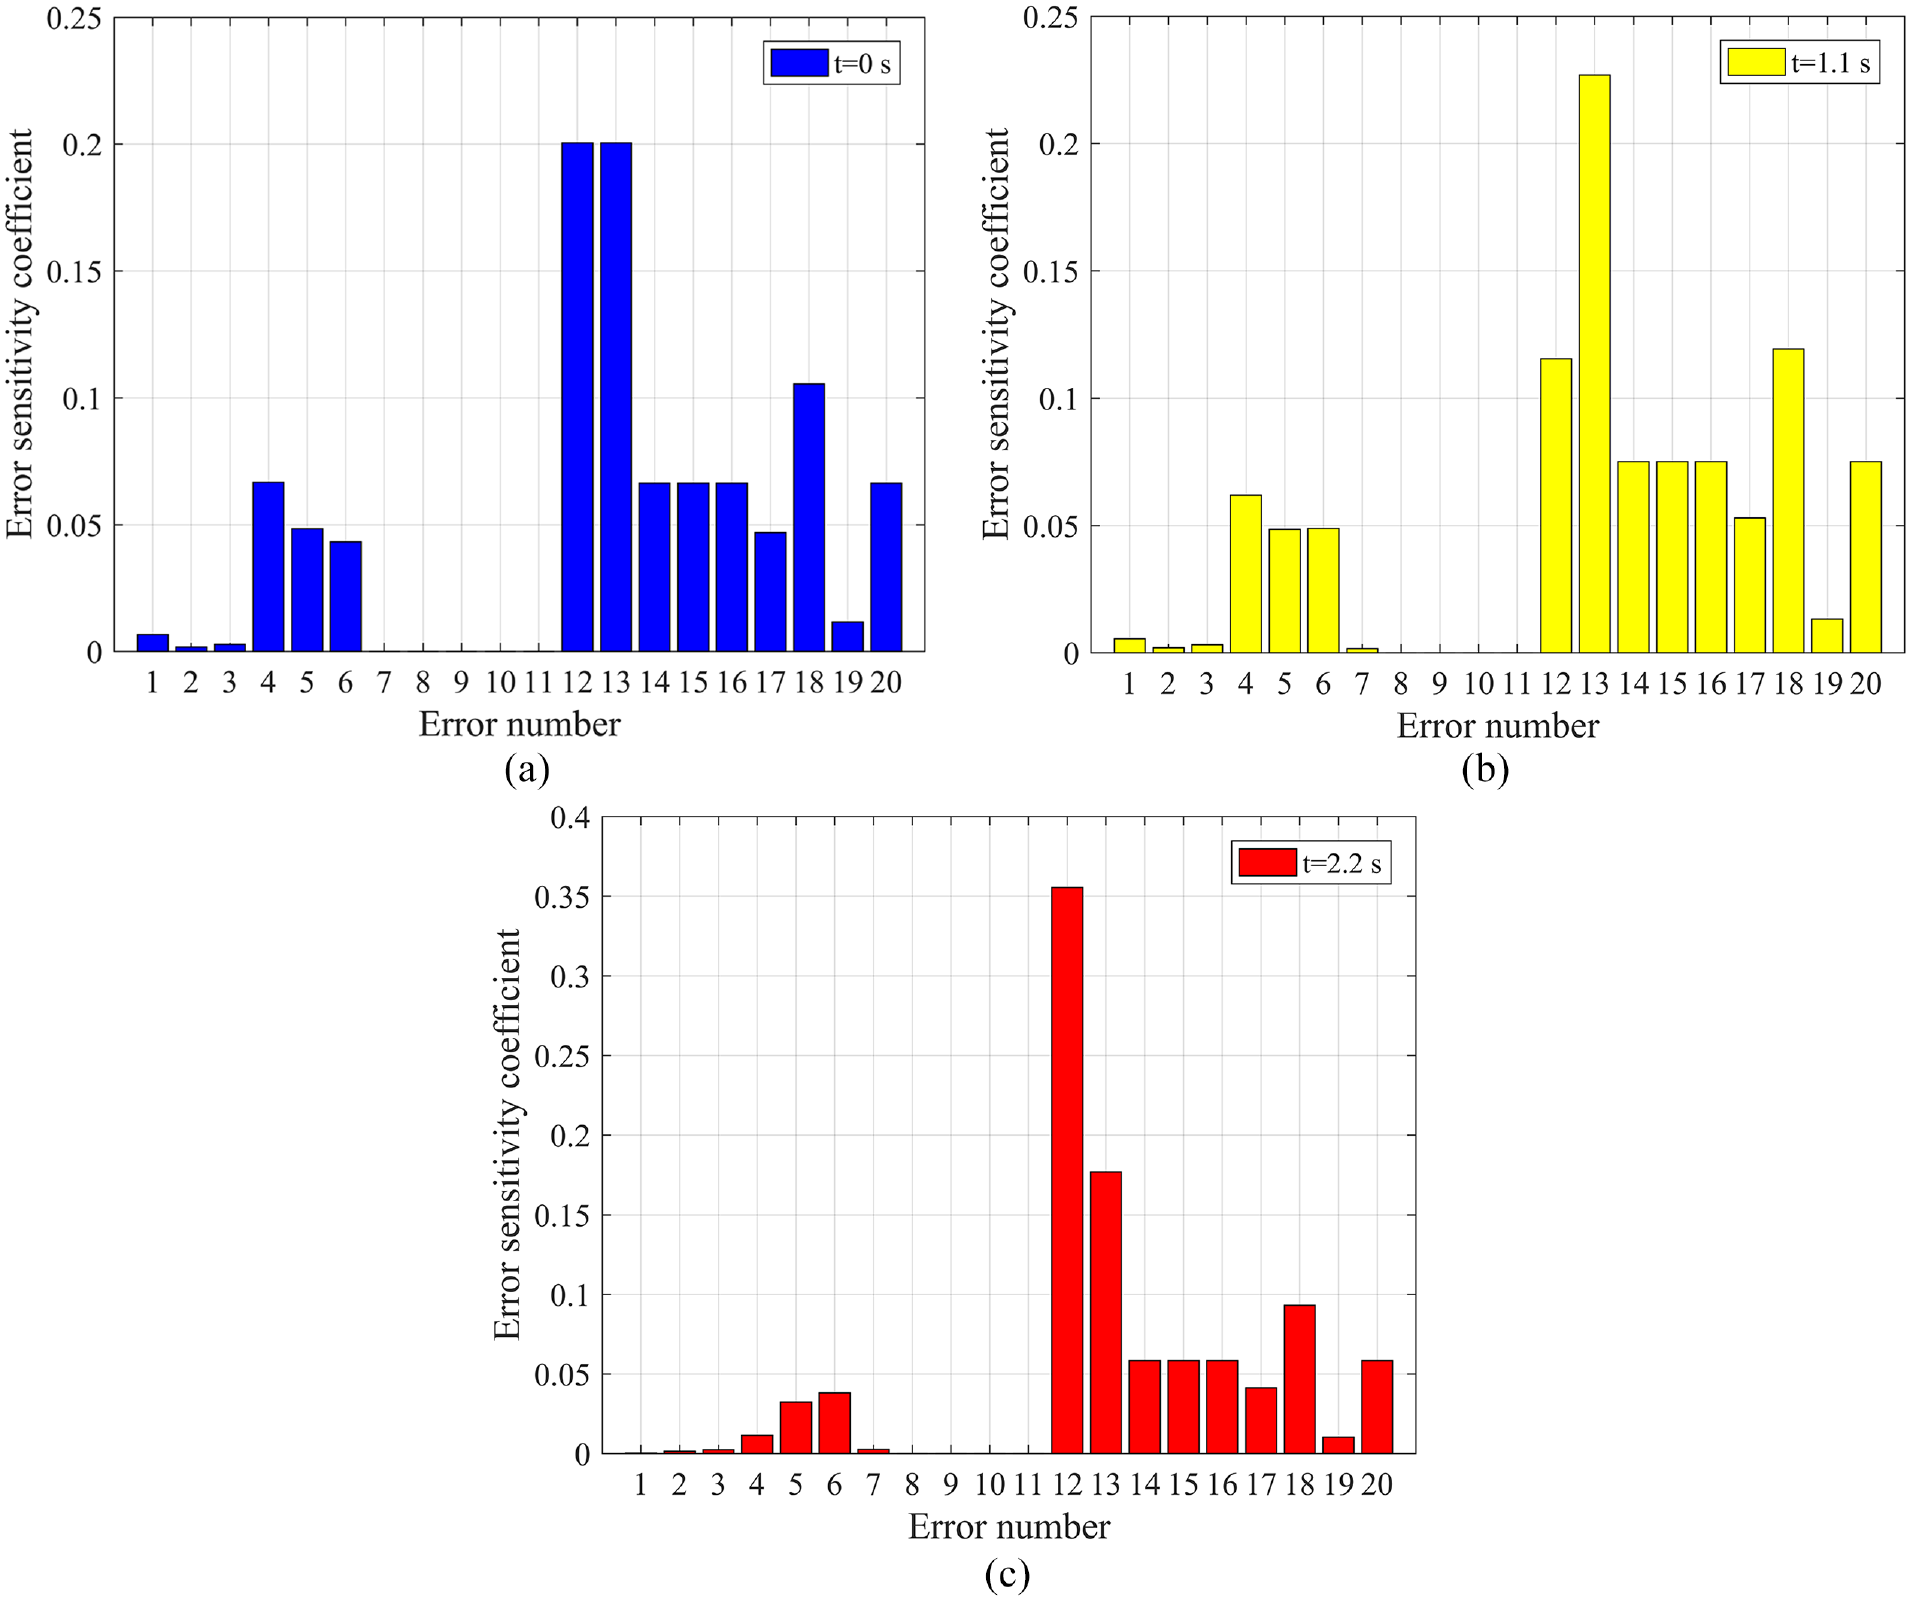
Error sensitivity coefficient at different time points: (a) t = 0 s, (b) t = 1.1 s, and (c) t = 2.2 s.
Conclusions
This study uses the concept of the differential error vector and matrix to characterize the small errors in the PRSM, so various errors in the PRSM are coupled. In this paper, error flow theory is used to describe the dynamic PRSM error generation, transmission and accumulation process, and the PRSM transmission error characterization model is established. The sensitivity coefficients of each error are calculated, and the following conclusions can be drawn:
The transmission error of the PRSM is obviously periodic and similar to the sine function, and the period is the same as the screw rotation. The periodicity of the transmission error is mainly caused by the eccentric errors of the components, which should be limited emphatically. The pitch errors of components and the thread clearance also have obvious influence on the transmission error and need to be limited. The flank angle errors of components can be set to a negative value to reduce the transmission error. In addition to the errors mentioned above, other errors have smaller or no influence on the transmission error.
In further research, the error values influenced by the elastic deformation should be taken into consideration, and the number of rollers should be increased in the calculation model.
Footnotes
Handling Editor: Chenhui Liang
Declaration of conflicting interests
The author(s) declared no potential conflicts of interest with respect to the research, authorship, and/or publication of this article.
Funding
The author(s) disclosed receipt of the following financial support for the research, authorship, and/or publication of this article: The research is supported by National Natural Science Foundation of China (Grant Nos. 51875458, 51905428), the Fundamental Research Funds for the Central Universities (Grant No. 31020200506004), Postdoctoral Science Foundation of China (Grant No. 2020M672318), Natural Science Basic Research Plan in Shaanxi Province of China (Grant No. 2020JQ-178), Key Project of National Natural Science Foundation of China (Grant No. 51535009), and the National Key R&D Program of China (Grant No. 2019YFB2004700).