
Abstract
To study the influence of rotational speed on the performance of hydraulic turbine in turbine mode (T-type turbine), the performance of turbine at different rotational speed was predicted through theoretical analysis, based on the Navier-Stokes equation and standard k-ε turbulence model, numerical simulation was used to study the performance of turbine at different rotational speed. The head loss, pressure distribution, turbulence kinetic energy, and unsteady pressure pulsation were also clarified. The results shows that with the increase of rotational speed, the high efficiency area of turbine gradually becomes wider, and there is little difference of the maximum efficiency at different rotational speeds. Under the optimal working condition, the pressure difference between inlet and outlet increase gradually, and turbulent kinetic energy of runner also increase. The inlet circulation increases with the increase of rotational speed, the outlet circulation increases with the increase of speed under small flow conditions, and decreases with the increase of rotational speed under large flow conditions. The study of pressure pulsation shows that the increase of rotating speed can effectively reduce the pressure pulsation in the runner. When the rotating speed is 2100 r/min, the amplitude of pressure pulsation at P7 is 10.39% lower than that at 900 r/min. Considering the hydraulic characteristics and the pulsation characteristics, it is recommended that the hydraulic turbine operates at or above the rated speed as far as possible.
Introduction
At present, there are more high residual pressure energy in industry, which is usually recovered by hydraulic turbine to reduce energy loss and ensure sustainable utilization of energy. Hydraulic turbine can convert pressure energy of liquid into rotating energy of hydraulic turbine runner, so as to drive pump or generator and realize energy recovery.1–4 Reverse pump as turbine (PAT) is widely used in the field because of its simple structure and low price.5–7 However, due to its own characteristics, PAT is not suitable to be applied to recover energy in the increasingly popular operating conditions of low flow and high head. Some studies have pointed out that the internal flow of PAT is disordered, which reduces the recovery efficiency, and the efficiency decreases sharply at off-design condition, leads to the secondary waste of energy. In addition, due to the low water head of PAT, when it is used for the recovery of high residual pressure liquid, the number of stages needs to be increased, resulting in poor stability and large vibration. Although many scholars have optimized the performance of PAT, the results are not satisfactory.8–12 After compared various energy recovery devices, Sanjay 13 pointed out that due to poor hydraulic flow state, the efficiency of PAT is low. Stan 14 pointed out that PAT will become an energy consuming device when deviates from the design condition.
Hydraulic turbine in turbine mode (T-type turbine) designed by prime mover theory can avoid the shortcoming of PAT. Compared with conventional hydraulic turbine, T-type turbine removes movable guide vane and complex control mechanism, which has simple structure and higher efficiency than PAT.15,16 In addition, the head of low specific T-type turbine is high, can effectively reduce stage and improve the stability. However, in different application scenarios, the structural parameters and specifications of turbines are different. Therefore, each turbine needs to be tested to determine its accurate performance parameters before it is put to use. Through the study of T-type turbine, it is found that the head and power increase with the increase of flow. At the rated speed, the power capacity of laboratory cannot meet the test of high-power turbine. This problem is also faced in the research of pump. However, in the experimental test and production operation of pump, variable speed operation is generally used to solve this problem and the technology is mature.17–23 Therefore, based on the experience of pump, some scholars have studied the effect of rotational speed on performance of turbine. 24 Buono et al. 25 and Yang et al. 26 theoretically deduced the performance of reverse pump turbine at different rotational speeds, and verified the feasibility of the theory by experiment and numerical calculation. Lima et al. 27 pointed out that regulating the operation through variable speed can effectively reduce leakage of PAT. Through CFD, Ismail et al. 28 found that the maximum efficiency point of turbine shifts to small flow condition when the speed is low. Chen et al. 29 pointed out that the speed adjustment should be adjusted according to the changes of environment and seasonal water level.
In summary, the research on the influence of rotational speed on pump and PAT is mature. However, whether the performance variation law of low specific speed T-type turbine is the same needs to be further discussed. Therefore, this paper studies the influence of rotational speed on performance of T-type turbine through theoretical prediction and numerical simulation.
The structure of this paper is as follows: Section 2 introduces a method of predicting the performance of low specific speed T-type turbine at different rotational speeds. Furthermore, the physical model of T-type turbine and numerical simulation scheme are described and verified by test in Section 3. Section 4 analyzes the hydraulic performance of T-type turbine and pressure pulsation characteristics under different rotational speed. Finally, the paper is concluded in Section 5.
Theoretical analysis of hydraulic turbine in low specific speed turbine mode
T-type turbine composes four parts: volute, guide vane, runner, and outlet pipe, the runner is designed according to the theory of hydraulic prime mover, guide vane and volute are designed to meet the runner inlet circulation. The number of runner blades and guide vanes are 13 and 14. The design parameters of the turbine are shown in Table 1.
Main parameters of T-type turbine.

The turbine studied in this paper is a low specific speed turbine, and its inlet and outlet velocity triangles are shown in Figure 1.

Inlet and outlet velocity triangles of T-type turbine.
It can be seen from the inlet velocity triangle of low specific speed T-type turbine:


where, u is circumferential velocity, vm is meridian velocity, vu is circumferential component of velocity, α1 is inlet angle of runner, β is placement angle of runner, Subscripts 1 and 2 represent inlet and outlet.
It can be deduced from equation (2):

among them
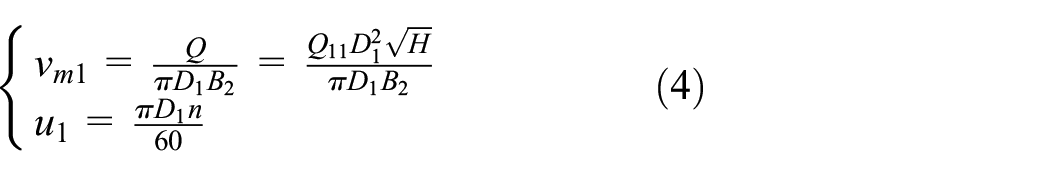
where, Q is flow rate, Q11 is unit flow rate, D1 is inlet diameter of runner, B2 is inlet width of runner, n is rotational speed, H is head of turbine.
Bring equation (4) into (3), the relationship between Q and n, H and n are deducted as follow.


Then, the relationship between Q and n, H and n, P and n can be obtained


according to equations (7)–(9):

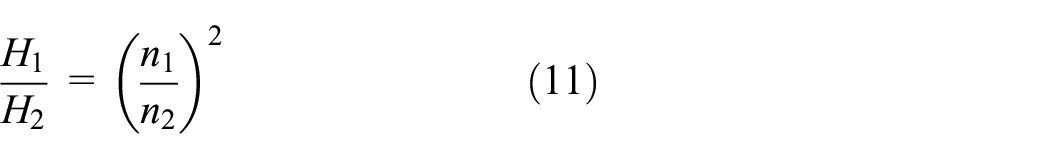

where, n1 and n2 represent different rotational speeds, r/min. Q1 and Q2 are the corresponding flow under similar working conditions at the speed of n1 and n2, m3 /s. H1 and H2 are the corresponding water head under similar working conditions at the speed of n1 and n2, m. P1 and P2 are the corresponding power under similar working conditions at the speed n1 and n2, kW.
Numerical method
Grid generation
According to the research goal of this paper, the performance changes of T-type turbine at different rotational speeds are studied by numerical simulation. Firstly, volute, guide vane, runner, and outlet pipe of T-type turbine are modeled by Pro.E. Then ICEM is used to divide the structured grid of each flow passage component, as shown in Figure 2. In order to eliminate the influence of mesh number on the numerical simulation results, seven mesh schemes ranging from 1.25 to 5.6 million were tested, the number of mesh are shown in Table 2. It can be seen from Figure 3 that with the increase of mesh number, the head gradually decreases and the efficiency gradually increases, keep stability when mesh number reaches 3.1 million. According to the calculation time and calculation stability, 3.1 million was selected for final simulation.

Three dimensional view of turbine: 3D Drawing and mesh.
Mesh number.


Mesh independence test.
Numerical simulation scheme and Test verification
Numerical simulation
The turbulence selected k-ε model, which is widely used in numerical simulation of turbomachine. Some scholars have studied the applicability of various turbulence models to the numerical simulation of turbine,30–32 and the research shows that k-ε model can well simulate the flow field in turbine. When flow is incompressible, express the model as follows:


where,
The fluid selected water liquid. The velocity inlet was used for inlet boundary, and pressure outlet was used for the outlet boundary. The frozen rotor-stator interface was used between runner and guide vane, and between runner and outlet pipe. The solution method selected SIMPLE. The calculation convergence standard is 10−5. The performance curve of T-type turbine was obtained by changing the inlet velocity.
Test verification
High inlet pressure of T-type turbine was supplied by three booster pumps, as shown in Figures 4 and 5. The dynamometer was used to collect the torque and rotational speed of turbine. Pressure sensor was installed at inlet and outlet to collect the inlet and outlet pressure date. T-type turbine was tested at 1500 r/min. By measuring all data, the head, efficiency, and power of turbine were obtained. Then, T-type turbine was simulated at 1500 r/min through Fluent software. Its performance was compared with the test data, as shown in Figure 6.

Experimental test ring.

Schematic diagram of test ring.

Numerical simulation and test results.
It can be seen from Figure 6 that the trend of the performance obtained from test and numerical simulation is consistent. Because the numerical simulation didn’t consider mechanical loss and leakage, the efficiency is higher than test date. At the highest efficiency point, the head error is 2.35%, efficiency error is 3.08%, and shaft power error is 6.8%. The numerical calculation method used in this paper is suitable to predict T-type turbine’s performance.
Result analysis
Hydraulic performance analysis
The predicted performance curves of T-type turbine are drawn in Figure 7 according to the dates of numerical simulation. Compared with the performance curves of T-type turbine under different rotational speeds, the trend of change is consistent. With the increase of flow rate, the head and power curves increase, the efficiency increases first, reaches the maximum under a certain working condition, and then begins to decrease. Rotational speed has a significant impact on performance of T-type turbine. Under the same flow rate, the higher the rotational speed, the higher the head and power. With the increase of rotational speed, the optimal efficiency point of turbine gradually shifts to the large flow condition, and the high efficiency area becomes wider. The optimal efficiency at different rotational speed changes small, reaches the highest at 1500 r/min, up to 85.2%, which is 1.9%, 2.2%, 0.9%, and 0.8% higher than that at 900, 1200, 1800, and 2100 r/min.

Performance curve of T-type turbine at different rotational speeds.
The performance parameters calculated by numerical of the highest efficiency point at different rotational speed are listed in Table 3. The theoretical calculation value of flow, head and power at other speeds is based on the parameters at 1500 r/min, were calculated according to equations (10)–(12). In addition, Table 3 also lists the errors between theoretical and numerical calculations value. It can be seen from Table 3 that there is a certain deviation between numerical simulation and theoretical prediction. The maximum deviation of flow and head occurs at the speed of 0.6nr, which are 2.547% and 3.139% respectively. It can be considered that the head and flow approximately meet the theoretical derivation. The power has a cubic relationship with the rotational speed, was greatly affected by rotational speed. With the increase of rotational speed, the power error between theoretical and numerical simulation gradually increases, and the maximum error occurs at 1.4nr, reaching 9.211%.
High efficiency point performance parameters corresponding to turbine numerical simulation and theoretical calculation at different rotational speeds.

Figure 8 shows the head loss of T-type turbine at different rotational speed. It can be seen that the head loss of volute approximately linear increase with the increase of flow. Under the same flow condition, the head loss of volute changes little with the increase of rotational speed. The head loss of guide vane increases linearly with the increase of flow, and the rise rate increases with the increase of rotational speed. The head loss of runner is different from volute and guide, which is not increase linearly, but first decreases and then increases with the increase of flow, and the head loss reaches the minimum under the flow condition of its optimal efficiency point. Under the small flow condition, the head loss of runner increases gradually with the increase of rotational speed. With the increase of flow, the difference of head loss of runner under different speeds decreases gradually. The head loss of outlet pipe decreases slightly and then increases with the increase of flow. Under small flow condition, the head loss of outlet pipe increases gradually with the increase of rotational speed, but under large flow condition, the head loss of outlet pipe decreases with the increase of speed.

Hydraulic loss of each component.
Pressure distribution on blade to blade surface of the optimal efficiency working condition at different rotational speed are presented in Figure 9. It can be seen that pressure slow down from inlet to outlet of runner, with the increase of rotational speed, inlet pressure of runner gradually increases, and the pressure difference between runner inlet and outlet also gradually increases, which is the main embodiment for the gradual rise of head with the increase of rotational speed.

Pressure distribution at different rotational speed.
Turbulent kinetic energy distribution on blade to blade surface of the optimal efficiency working condition at different rotational speeds are shown in Figure 10. It can be seen that when the rotational speed is low, the turbulent kinetic energy at the blade inlet is greater than that at other positions. With the increase of the rotational speed, the position with high turbulent kinetic energy gradually moves toward the blade outlet along the fluid flow direction. With the increase of rotational speed, the turbulent kinetic energy in the runner increases gradually, which is also the main reason for the gradual increase of the head loss of the runner under their respective optimal conditions.

Turbulent kinetic energy distribution at different rotational speed.
Figure 11 shows the pressure distribution on blade streamline at span 0.25, span 0.5, and span 0.75. It can be seen that the blade load at span 0.25 is higher than that at span 0.5 and 0.75. With the increase of rotational speed, the variation law of blade load at three positions is the same. With the increase of rotational speed, the blade pressure distribution on blade streamline at the inlet becomes larger, and the pressure difference between the working face and back of the blade increases, which is the main embodiment of the enhancement of runner work capacity with the increase of rotational speed.

Pressure distribution on blade streamline at different spans.
Figure 12 shows the runner inlet and outlet circulation distribution,

Runner inlet and outlet circulation at different speeds.
Unsteady result analysis
Unsteady numerical calculation
In order to study the influence of different rotational speed on pressure pulsation, pressure monitor points were positioned at different locations. Figure 13 shows the location information of points in volute, runner, and outlet pipe. The unsteady numerical calculation set the results of steady calculation as the initial condition. The runner rotates 2° in each time step and rotates seven turns in total. At this time, the pressure pulsation is relatively stable. Select the static pressure results of each monitoring point in the last turn for analysis. Table 4 shows the time step and total time. In order to compare the amplitude and frequency of pressure pulsation, the pressure coefficient is defined as
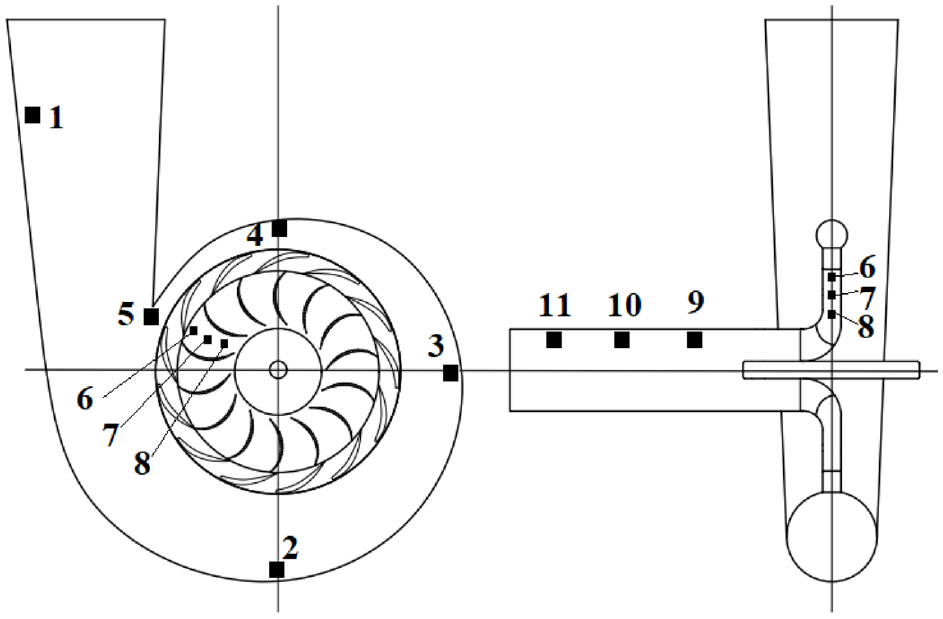
Pressure monitoring points within turbine.
The time step and total time at different rotational speed.

Unsteady result analysis
The pressure pulsation after fast Fourier transform (FFT) of volute at different rotational speed under optimal conditions are plotted in Figure 14. It can be seen that the maximum amplitude of pressure pulsation at each monitoring point occurs at 14 times the blade frequency. Along the fluid flow direction, the amplitude of pressure pulsation at P4 and P5 near the tongue is greater than that at other points. The pressure pulsation amplitude of P4 is the largest, gradually increases with the increase of rotational speed. With the increase of rotational speed, the variation law of pressure fluctuation amplitude at each monitoring point is inconsistent. P1 and P5 decreases slightly, P3 and P4 reach the smallest at 1500 r/min.

Frequency domain of pressure pulsation within volute.
The pressure pulsation after FFT of runner at different rotational speed under optimal conditions are plotted in Figure 15. It can be seen that the pulsation mainly occurs at rotating frequency and multiple rotating frequency. The pressure pulsation amplitude of P6 at the runner inlet is the biggest, which is 35.2% and 54.4% higher than that of P7 and P8 at the rotational speed 1500 r/min respectively. With the increase of rotational speed, the pressure pulsation amplitude of each point decreases. The pressure pulsation amplitude of P7 at 2100, 1800, 1500, and 1200 r/min is 10.39%, 8.3%, 7.2%, and 4.27% lower than that at 900 r/min. It can be deduced that the increase of rotational speed can reduce the pressure pulsation of runner. The pulsation amplitude of runner is much higher than that of other flow passage components. Reducing the pressure pulsation of runner can reduce the pressure pulsation of the whole machine.

Frequency domain of pressure pulsation within runner.
The pressure pulsation after FFT of outlet pipe at different rotational speed under optimal conditions are plotted in Figure 16. It can be seen that the pressure pulsation in outlet pipe is much lower than that of other overflow components, and the main frequency amplitude of pressure pulsation is also different. P9 appears at 14 times the blade frequency, P10 and P11 appear at 1 times the blade frequency. With the increase of rotational speed, the pulsation amplitude in outlet pipe increases slightly at 1500 r/min.
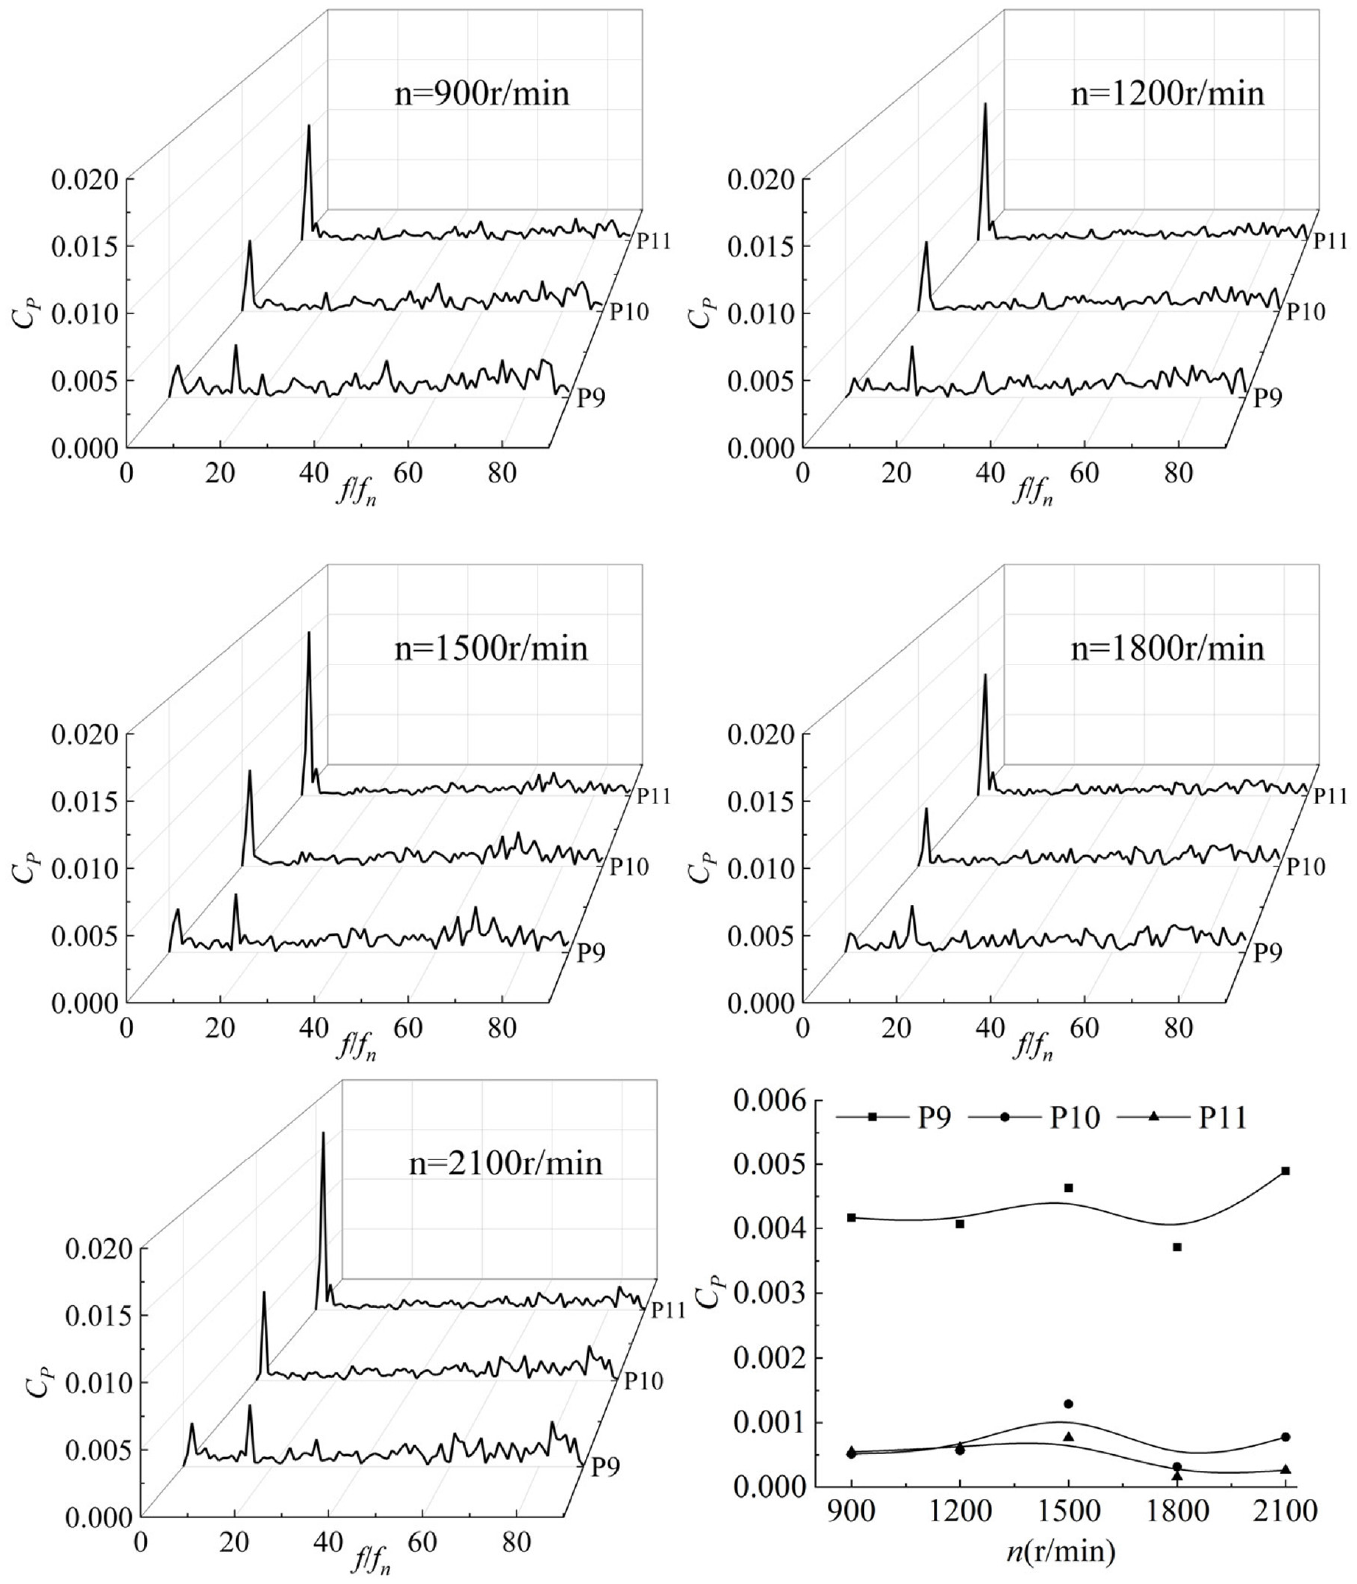
Frequency domain of pressure pulsation within outlet pipe.
Conclusions
When the speed of T-type turbine changes, its performance curves change similar. When the flow increases, the head and power increase, and the efficiency first increases and then decreases. With the increase of rotational speed, the high-efficiency area of T-type turbine becomes wider, the variation range of the maximum efficiency value of each speed is small. There is a certain deviation between the numerical simulation value and the theoretical calculation value. The flow and head basically meet the theoretical prediction. However, the deviation of shaft power is large when n = 1.4nr and up to 9.211%.
The head loss of runner first decreases and then increases with the increase of flow. At the optimal flow rate, with the increase of rotational speed, the turbulent dissipation rate in the runner increases gradually, and the head loss in the runner increases gradually. The head loss of other overflow components varies with the speed, the volute head loss is basically unchanged, the head loss of guide vane increases with the increase of speed, the head loss of outlet pipe increases with the increase of speed under small flow, and decreases with the increase of speed under large flow.
The pressure pulsation of runner is much larger than that of other flow parts, and reaches the highest at the runner inlet. Under the optimal working condition, the pressure pulsation amplitude in runner gradually decreases with the increase of rotational speed. The increase of rotational speed can reduce the pressure pulsation amplitude in turbine runner, and then reduce the whole turbine pulsation.
To sum up, when the turbine operates off-design rate condition, the efficiency of turbine can be improved through reducing speed under small flow condition and increasing speed under large flow condition. For the low specific speed turbine studied in this paper, when the structural strength of turbine meets the requirements, it is recommended to keep the turbine running at or slightly higher than the rated speed.
Footnotes
Appendix
Handling Editor: Chenhui Liang
Declaration of conflicting interests
The author(s) declared no potential conflicts of interest with respect to the research, authorship, and/or publication of this article.
Funding
The author(s) disclosed receipt of the following financial support for the research, authorship, and/or publication of this article: This research was supported by the National Natural Science Foundation of China (51579104, 51909094).