
Abstract
Fatigue reliability assessment of welded joints can consider the uncertainties from various sources and can establish the design criteria and inspection plans. The present paper aims to address the uncertainties explicitly. The notch strain approach that accounts for the effects of the misalignment, local notch, and crack-like imperfection, which is referred to as secondary notch, is employed. Sensitivity analyses indicate that uncertainties in misalignment, flank angle, weld toe radius together with secondary notch are all important sources of the total uncertainty. The practical difficulty in the determination of the uncertainty models of the geometric parameters is discussed, and the acceptance limits for fabrication are used to derive the uncertainty models. And finally, the impacts of acceptance limits on the fatigue reliability of welded joints are assessed. The results indicate that the weld toe radius and secondary notch depth significantly affect the reliability index and the fatigue reliability increases with the weld quality of the welded joint becomes higher.
Introduction
Fatigue is a critical and commonly happened failure mode of engineering equipment including wind turbines1–4 and marine structures.5,6 Fatigue has to be controlled or avoided to exclude costly repairs and catastrophic accidents as fatigue reliability of structures will directly affect the overall performance of engineering equipment such as safety, availability, and reliability.7–10 Considering the significant uncertainties involved in the fatigue process of structural components, the fatigue reliability assessment is required to ensure structural safety.1,11,12 The fatigue reliability assessment can support the establishment of design criteria 1 and inspection plans. 6 The assessment relies on S-N curve approaches and crack propagation approaches. During the last several years, fatigue reliability assessment of welded joints has become an acceptable procedure, however, the reality is that some uncertainties associated with fatigue reliability assessment of real engineering equipment are not explicitly considered.
Weld geometry is a notable factor influencing the fatigue strength of welded joints. Three factors of weld geometry should be accounted for, as recommended by International Institute of Welding (IIW) 13 :
Significant uncertainties are associated with the weld geometry.12,14 The variation in weld geometry is a common feature for welded joints. It occurs along with the weld line of individual joints and from joint to joint. The weld geometry hangs on the welding conditions and manufacturing processes. The welding position, work angle, travel speed, welding current, and voltage vary even adopting the same technique, causing some variation of the weld geometry. It may be the main reason for the significant scatter in fatigue lives of welded joints.
Although the effects of weld geometry, as well as the uncertainties in weld geometry, are significant, the widely used S-N curve approaches and crack propagation approaches can hardly consider most of the effects explicitly. The most approaches used in practical engineering ignore the information of weld geometry. The nominal stress, hot spot stress, and effective notch stress approach can only account for the effect of misalignment. Due to the limitation of the stress intensity factor solutions, 17 the crack propagation approach cannot consider the local notch effect appropriately. Recently, the effects of weld geometry has gained great attention.16–18 Extensive efforts were made to consider these effects explicitly in the frame of S-N curve approaches and crack propagation approaches. For example, Dong et al. 18 proposed an updated notch strain method that accounted for the effects of misalignment, local notch, and crack-like imperfections. Although some approaches can consider the effects of weld geometry, the information of weld geometry for the fatigue strength assessment is also difficult to determine because of the random nature the weld geometry.
This paper assesses the fatigue reliability of a butt-welded joint accounting for the uncertainties in weld geometry. The notch strain approach is applied to address weld geometry’s effects. Sensitivity analyses are then performed to identify the influence of the uncertainty in each random variable on the total uncertainty. The acceptance limits for fabrication are used to derive the uncertainty models of the geometric parameters. And finally, the effects of acceptance limits on the fatigue reliability are assessed.
Notch strain approach
The notch strain approach (local strain approach) 19 is employed in the fatigue reliability assessment due to its capability of dealing with the problem under consideration. The approach was originally proposed for the crack initiation life prediction of notched members. Its application was extended to welded joints. 20 The approach was refined by Dong et al. 18 to consider the secondary notch effect, that is the crack-like imperfection effect. The secondary notch effect was modelled in the low- and high-cycle fatigue regime, respectively. The equivalence between the Coffin-Manson law and a simple Elastic-Plastic Fracture Mechanics crack growth law in the low-cycle fatigue regime was used. The fatigue limit as a function of the crack size was employed to model the secondary notch effect in the high-cycle fatigue regime.
Notch strain estimation
In this study, the misalignment, local notch, and secondary notch for a butt welded joint are shown in Figure 1.
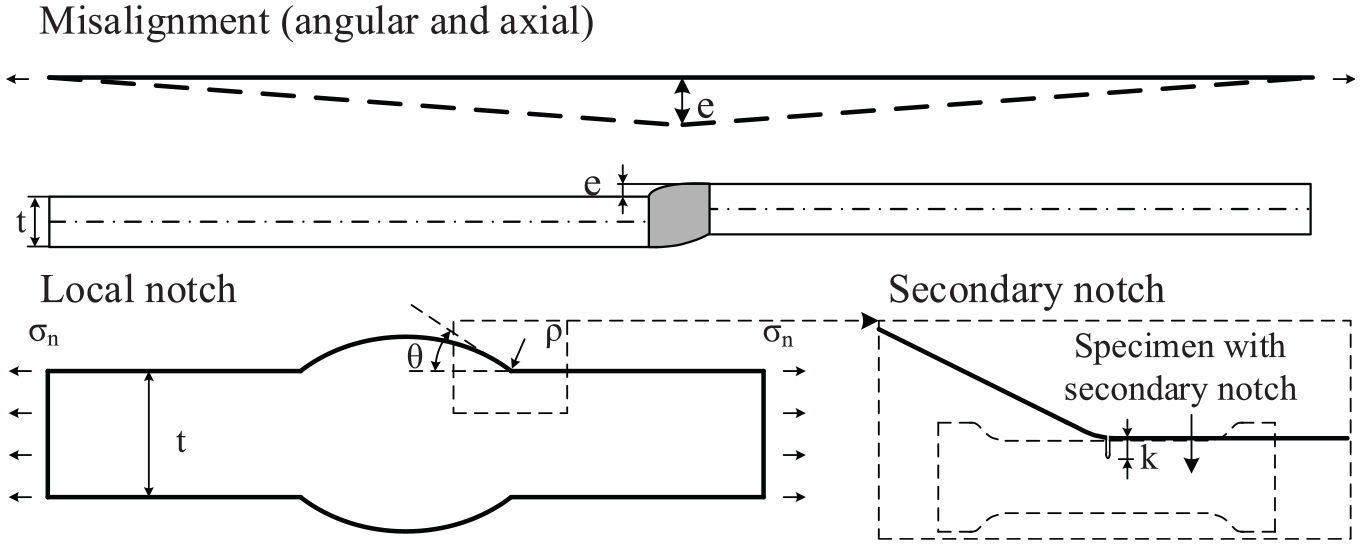
Misalignment, local notch and secondary notch of a butt welded joint. 16
Two types of misalignments usually exist: angular and axial misalignment, as illustrated in Figure 1. The stress raising effect due to misalignments is described by a factor Km imposed on the nominal stress. The expressions of Km for various cases are provided in Hobbacher. 13 For no restraint on the transverse member (excess weld metal in the present case), a simple formula for all cases (including both the axial and angular misalignment) are obtained by assuming symmetric lengths of the base plates and fixed ends without considering the effect of straightening 21 :
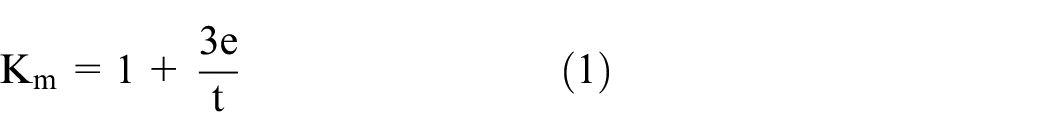
where e and t are the magnitude and the thickness of the plate.
The local notch, that is the weld toe, is usually defined by the weld toe radius ρ and flank angle θ. Hence, the stress concentration factor for membrane and bending stresses can be estimated by 20 :


where ρ is the weld toe radius, θ is the flank angle.
If the butt joint is axially loaded by nominal stress, one can determine the elastic stress response using a stress concentration factor considering both stress raising effects:

Combined with the elastic response, the elastic-plastic material behaviour is normally described by Ramberg–Osgood equation:

where E is the Young’s modulus, εa and σa are the amplitude of the cyclic strain and stress, respectively, and K′ and n′ are the cyclic strain hardening coefficient and exponent, respectively.
Numbers of analytical approaches for notch strain estimation are presented. For welded structures where the weld toe radius is normally smaller than the length of the weld line, it is reasonable based on the assumption of the plane strain state.22,23 It has been shown that the estimations by equivalent strain energy density (ESED) approach are in good agreement with experimental results 24 and elastic-plastic finite element method (FEM) results. 25 It is also employed in the present study.
Secondary notch effect
According to the estimated notch strains, the crack initiation life can be calculated by using the strain-life curve and Miner’s rule. The uniaxial strain-life curve of the material is determined by standard specimens under well-controlled experimental conditions:

where σf′ is the fatigue strength coefficient, b is the fatigue strength exponent, εf′ is the fatigue ductility coefficient, c is the fatigue ductility exponent. Based on the similitude concept, the notched components’ crack initiation life is equivalent to the total fatigue life of standard specimens in the case of the same strain amplitudes.
However, the notch root of welded joints cannot be as smooth as standard specimens. From Figure 1, secondary notches are usually included in welded joints, making the similitude concept questionable. To include the effect of the secondary notch, it is recommended to adopt specimens with a secondary notch when obtaining strain-life curves. These specimens must have a similar surface condition as that of welded joints, as shown in Figure 1. Thus, the similitude can be achieved. However, fatigue tests are laborious and costly. In this analysis, analytical techniques are used to estimate the degradation of the initial strain-life curve from standard specimens.
Based on the secondary notch depth k, Dong et al. 18 proposed a modified strain-life curve. The degradation of the initial strain-life curve was realised by using the k-dependent σf′(k) and εf′(k) rather than σf and εf′:
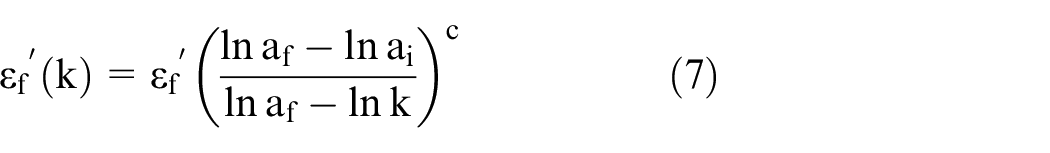
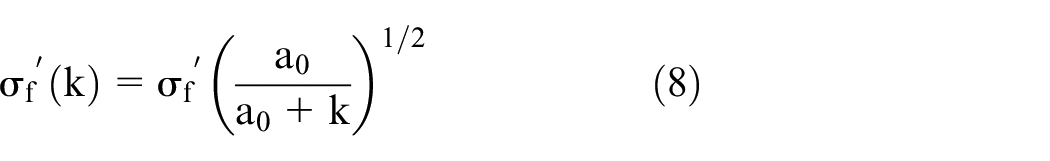
where ai is the half of the mean grain size of the material, af is the minimum radius of the cylindrical specimen, respectively, and a0 is defined by 18 :

where Δσw is the fatigue limit (stress range), ΔKth,LC is the long crack propagation threshold. To ensure consistency, their values corresponding to R-ratio of −1 are used. The crack propagation threshold for any R-ratio can be estimated by ΔKth = (1 − 0.73R)ΔKth0, where ΔKth0 is the crack propagation threshold with R-ratio of 0 . 26
The modified strain-life curve of the plane strain state can be written as 18 :
where ε1a is the amplitude of the first principal strain, ν is the Poisson’s ratio, and μ is the generalised Poisson’s ratio that is gained in the notch strain estimation.
Note that the effect of welding-induced residual stresses 27 is ignored here because the residual stress relaxation occurs due to the application of stress cycles with relatively high ranges. The residual stresses may be relaxed in a relatively short period comparing to the whole service life. Besides, the welding-induced residual stresses may not be as high as expected especially for welded joints with low constraint. 28
Although the life estimated using the strain-life curve corresponds to the initiation of an easily detectable crack whose size ranges from 0.1 to 1 mm, 25 it can be treated as a conservative approximation of the total fatigue life. The treatment is reasonable when the weld quality is large and fatigue loading is at a small level.
Fatigue reliability assessment
The fatigue reliability of the butt welded joint shown Figure 1 is estimated accounting for uncertainties. Since some reliability assessment methods are well-established, for example the first or second order reliability method (FORM/SORM), the Monte Carlo (MC) simulation method, the parameters involved in the section are considered as random variables.
Limit state function
The limit state function (LSF) for fatigue is written as:

where X is the vector of random variables, Δ is the damage at failure, and D is the cumulative damage.
The fatigue failure probability can be estimated as follows:

where Φ(·) is the standard normal cumulative distribution function and β is the reliability index.
The importance of the contribution of each variable to the uncertainty of g(X) can be investigated by the sensitivity factors, which can be calculated by:

In this work, the FORM29–31 is used to evaluate the reliability index and the sensitivity factor.
Random variables
The random variables and deterministic parameters involved in the LSF are listed in Tables 1 and 2.
Statistical characteristics of random variables.

The values are the statistical descriptors of the corresponding normal distribution.
Values of deterministic parameters.

The fatigue failure happens once D is greater than Δ, where Δ is usually set to be 1 in most deterministic studies. In fact, fatigue failure may occur when D is less or larger than 1. The fatigue process can be seriously affected by many factors, like environment conditions, loading sequence, working temperature, and so forth. Note that Miner’s rule fails to present a reasonable elaboration of such a complex process. Thus, to quantify the error caused by the damage rule, Δ is treated as a random variable. As was investigated by Wirsching and Chen, 5 a log-normal distribution (median of 1 and CoV of 0.3) was recommended.
The uncertainties in weld geometry are the main concern of the present study. Statistics provide powerful tools for the explanations of experimental data32–36 such as Statistical descriptors of geometric parameters were offered in many studies based on experimental measurement, and a review of the data from different sources was conducted by Schork et al. 32 Jakubczak et al. 37 performed experimental and statistical assessment of the weld toe radius and flank angle. The distributions fitted by the data from different units in the same factory show significant differences. The uncertainty of the misalignment was considered by Dong et al. 7 in the fatigue reliability assessment. Experimental results have shown that the misalignment follows a normal distribution. 38 The half-normal distribution accounting for the acceptance criteria of fabrication was proposed to represent the uncertainty of the misalignment. The acceptance criterion of 0.1 t is treated as the characteristic value under probability level of 95%. The statistical descriptors of the size of crack-like imperfections are not well documented, because there are different types of crack-like imperfections and the definition of the geometry is usually ambiguous. The roughness-based secondary notch data reported by Schork et al. 32 is used in this study.
Due to more similar specimens and strictly controlled experimental conditions, the uncertainty in the strain-life data is not as significant as that in the S-N data of welded joints. Some studies investigated the uncertainties of the strain-life curve parameters.37,39 The uncertainty of εf′ is ignored because the fatigue loading mainly causes elastic responses. The CoV of σf’ is assumed to be 0.1 according to. 39 Note that the cyclic strain hardening coefficient K′ can be estimated by σf′/εf′b/c. Therefore, the CoV of K′ is equal to that of σf′. Another material property subjected to significant uncertainty is the crack propagation threshold. It has been shown that the R-ratio, material microstructure, and experimental method can affect the experimental results of the crack propagation threshold. 40
Note that engineering structures are generally exposed to environmental loading or operation loading. Due to their random nature, the fatigue loading during a relatively long period is also subjected to significant uncertainties. The fatigue loading specified by design codes deviates from the real ones. In this work, the primary focus is the uncertainties in weld geometry, and thus the modelling error of the fatigue loading is not considered to simplify the analysis. Assuming that the nominal stress range acting on the butt welded joint follows a Weibull distribution:

where h and q are the shape and scale parameters. The shape parameter is set to be 1 and various scale parameters are assumed. The total number of stress cycles is 108.
Results
Sensitivity analyses
The sensitivity factor α is the directional cosine of the design point with respect to the origin in standard normal space. For a random variable, the square of its sensitivity factor is the fraction of the total uncertainty of LSF. It has been shown in the present study that changing the fatigue loading, that is value of q, can only slightly affect the value of α for each random variable. Figure 2 shows the results of α for q = 14.

Sensitivities of random variables (values of α).
It can be seen that the uncertainties of the four parameters defining the weld geometry, are all important sources of uncertainties of the LSF. Even though the uncertainty of the flank angle is the smallest contributor, it is as important as the uncertainty of the fatigue damage at failure. Among the three random variables describing the uncertainty of material properties, that is σf′, K′, and ΔKth0, the influence of K′ on the uncertainty of LSF is negligible. The reason may be that the assumed fatigue loading mainly results in elastic responses at the local notch. The other two random variables have similar importance.
It should be noted that the sensitivities of random variables can be changed if other distribution types and statistical descriptors are employed. In the present study, the statistical descriptors of ρ, θ, and k are adopted from measurements of specimens representing most recent welding quality, 32 while, the statistical descriptors of other random variables are mainly from assumptions or from experiences that may be out of date. Therefore, the comparison between the three random variables is more credible.
Fatigue reliability assessment
It has been shown that the uncertainties of weld geometry play a significant role in the uncertainty of LSF, and thus on the fatigue reliability. A reasonable fatigue reliability assessment requires an accurate description of the uncertainties of weld geometry. In practice, it is difficult to gain such detailed information because of the ambiguous definition of the weld geometry parameter and the difficulty in the measurements. 41 Besides, the statistical descriptors are different from joint to joint hanging on the welding process.32,37
Some studies18,32 suggested that the acceptance limits for fabrication can be used to derive the statistical descriptors. The acceptance limits are usually specified in manufacturing guidelines. For example, the weld toe radius ρ should be larger than 0.25 mm for normal weld quality; misalignment e should be smaller than 0.1 t for normal weld quality. 21 In this study, the acceptance limits are considered as the characteristic values under the 95% or 5% probability level. Assuming that ρ and k obey log-normal distribution with a COV of 0.51 and 0.31, and e follows the half-normal distribution. Various characteristic values are assumed to study the effect of the acceptance limit on the fatigue reliability. The distributions of ρ, k, e for different characteristic values, that is different acceptance limits, are illustrated in Figure 3. The statistical descriptors listed in Table 1 approximately correspond to the characteristic values of ρc = 0.4 mm, k c = 100 µm, and ec = 2.5 mm, which is treated as the reference case.

Probability density functions of the (a) weld toe radius, (b) secondary notch depth, and (c) misalignment for various characteristic values.
The reliability index as a function of the scale parameter of the fatigue loading for various acceptance limits is shown in Figure 4. It can be found from Figure 4(a) that if the acceptance limit of weld toe radius is increased from 0.25 to 0.55 mm, the reliability index is significantly improved by approximately 1 at an arbitrary value of the scale parameter. The variation in reliability index is more important when the acceptance limit of ρ is low. The results indicate that the effect of the acceptance limit of the weld toe radius on the reliability is great. Hence, enlarging ρ can be an efficient method when aiming to enhance the fatigue performance.
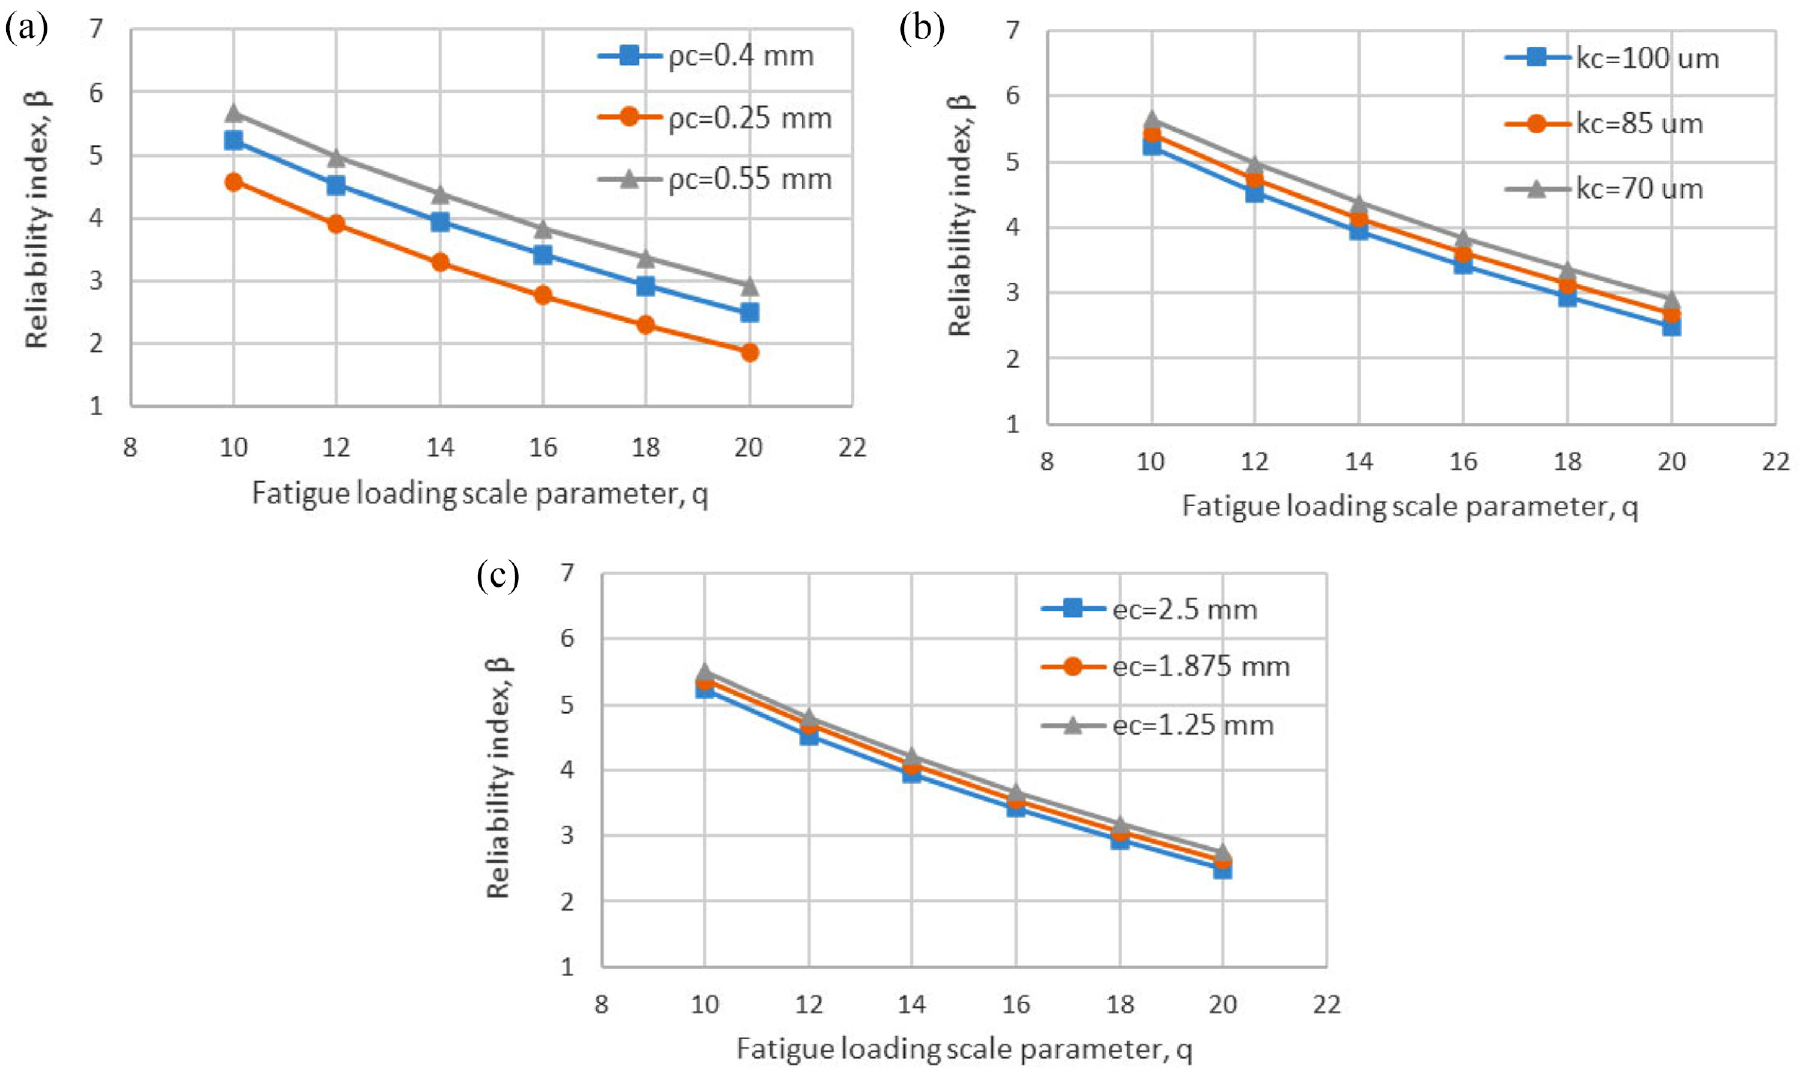
Reliability index as a function of scale parameter with different acceptance limits of (a) weld toe radius, (b) secondary notch depth, and (c) misalignment.
The effect of the acceptance limit of the secondary notch depth on the fatigue reliability is also crucial, as shown in Figure 4(b). The acceptance limit of k by 30 μm decreases with the increasing of reliability index by 0.5. Some post-weld improvement techniques can enlarge the weld toe radius and reduce the secondary notch depth simultaneously. 42 These techniques may be adopted to efficiently improve the fatigue reliability of welded joints.
The decrease of the acceptance limit of the misalignment from 0.1 to 0.05 t can increase the fatigue reliability slightly, as shown in Figure 4(c). It indicates that the three uncertainty models of the misalignment lead to slightly different reliability indices. The results do not imply the effect of misalignment is not important. Two deterministic misalignments, e = 1.25 and 2.5 mm, and two uniformly distributed misalignments, U(0, 1.25 mm) and U(1.25, 2.5 mm), are assumed. The statistical descriptors of other random parameters and values of the deterministic parameters are listed Tables 1 and 2, respectively. The resulting reliability indices are presented in Figure 5.

Reliability index as a function of scale parameter for two deterministic values of misalignment and two uniformly distributed misalignment.
It can be seen that the fatigue reliability index is improved by approximately 0.5 due to the increase of the deterministic misalignment from 1.25 to 2.5 mm. If the misalignment is uniformly distributed, the shift of the distribution from U(0, 1.25) to U(1.25, 2.5) can reduce the fatigue reliability index by approximately 0.5.
Conclusions
A new fatigue reliability analysis methodology of welded joints has been proposed in this paper to reflect the impact of uncertainties in weld geometry. Two A sensitivity analyses in carried out and which indicates that the uncertainties in misalignment, weld toe radius, flank angle, and secondary notch are important sources of the total uncertainty. Moreover, the acceptance limits for fabrication are used to derive the uncertainty model and concluded that the fatigue reliability increases with the weld quality of the welded joint becomes higher.
Footnotes
Handling Editor: Chenhui Liang
Declaration of conflicting interests
The author(s) declared no potential conflicts of interest with respect to the research, authorship, and/or publication of this article.
Funding
The author(s) disclosed receipt of the following financial support for the research, authorship, and/or publication of this article: This research was supported by Sichuan Science and Technology Program (No. 2021YJ0519), the General Program of Civil Aviation Flight University of China (Nos. J2021-032 and J2021-034), and the Doctoral Scientific Research Foundation of Jiangxi University of Science and Technology (No. 205200100566).