
Abstract
Based on the non-solvent-induced phase inversion (NIPS) membrane production process, we developed a model incorporating hydrodynamic effects and phase-field theory to simulate the phase separation process induced by concentration differences in polymer solutions. The influences of the initial polymer concentration and the composition of the coagulation bath on the film structure were studied. We found that the phase separation process starts from the top of the polymer solution layer and proceeds downwards in the layered structure. In the same system, as the initial PVDF concentration increases, the simulated morphology changes from a bi-continuous pattern to isolated droplets, thus determining the membrane morphology. Also, the validity of the model has been verified by corresponding experiments. Therefore, the model can be applied to other PVDF ternary membrane systems by modifying the material and its property parameters.
Introduction
The non-solvent-induced phase inversion (NIPS) method, also known as the immersion precipitation method, is one of the simpler methods commonly used in membrane preparation. When this method is used, the PVDF hydrophobic membranes can be prepared and modified in one step, with high performances such as large flux good hydrophobic properties, as well as high rejection and permeability.1–3
The preparation typically undergoes two processes, namely, the liquid-liquid phase separation of the system and the phase transition. The film preparation is a non-equilibrium process. The thermodynamic properties of the polymer solution and the kinetic process of film formation can affect the structure and performance of the film. The film formation is actually an unsteady kinetic process. The final structure and morphology of the film are affected by both the solvent and non-solvent diffusion processes, and also by the thermodynamic properties of the system.4,5 In order to visualize the evolution of the membrane structure during the film-making process, many works have adopted computer simulation methods to explore the evolution path of the membrane morphology, and have given some important conclusions.
Termonia used the Monte Carlo particle model to calculate and simulate the membrane production process, and obtained different membrane morphological structures by changing the interaction parameters between the solvent and non-solvent.6,7 However, in their simulation system, only the diffusion dynamics are considered and the effects of fluid mechanics were ignored. Lee et al. 8 established a wet casting polymer film model to discuss how the concentrations of casting solutions and the non-solvent bath interface were adjusted from the initial non-equilibrium to the equilibrium value at the double equilibrium point. This new model explained the influence of the casting solution thickness on the occurrence of macropores. Lin et al. 9 established a new dissipative particle dynamics (DPD) simulation method to study the influence of the interphase mass transfer between the casting liquid and the non-solvent bath on the membrane formation process and membrane morphology. They concluded that frequent non-solvent interaction and increased mass transfer strength could lead to strong phase separation. However, this research was based on a hypothetical system composed of parameters such as polymer, solvent, and non-solvent particles, some of which may be idealized to the extent that they reduce the degree of compliance with the actual film production conditions. Tree et al. 10 developed a multi-fluid model for ternary polymer solutions using Doi and Onuki’s Rayleigh form to quantitatively predict the fastest growth model obtained from the simulations, and to analyze the phase separation processes related to microstructural evolution in ternary polymer solutions. However, the model ignores some physical effects such as elastic stress and thermal fluctuations. Using the continuum and phase-field model of the terpolymer solution, Tree et al. 11 studied the mass transfer driving the non-solvent-induced phase separation and found that the time required for the non-solvent to diffuse to the bottom of the film is a pivotal time scale. However, this model does not include heat fluctuations and cannot explain the nucleation phenomenon.
It is worth noting that, during the PVDF membrane formation process, the membrane structure is influenced by many factors, with the skin layer and sub-layers having different phase separation behaviors, which are influenced to varying degrees by thermodynamics and kinetics. Although certain idealized states have been used in existing simulation studies, for example, some of which consider the diffusion dynamics while ignoring the effects of fluid mechanics, and this does not conform to the real situation. In this paper, a model incorporating hydrodynamic effects and phase-field theory is developed to simulate the phase separation process induced by concentration differences in polymer solutions. It is proposed that the velocity field and energy are shared by all phases, and a set of momentum equations were constructed to solve the polymer diffusion during the simulated film formation process. The influences of the initial polymer concentration and the composition of the coagulation bath on the film structure were studied. The effects of different polymer concentrations and solvent systems on the film structure were discussed.
Method
Model
Establishment of the model
The established fluid model simulates two or more fluids by solving a set of momentum equations, and tracks the volume fraction of each fluid throughout the computational domain. The fluid model is constructed to track the free surface according to the function
The parameters involved in the control equations in the model and their meanings are shown in Table 1.
Parameter meaning.

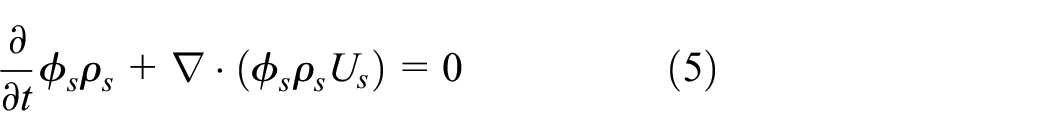
The mass conservation equation is defined as:

The density of the mixed system is defined as:

The volume fraction of each phase is given by:

The equation of the volume fraction for multiple phases is solved to track the phase interface. The volume fraction continuity equation is:

The volume fraction equation can be discretized as follows:

where:
At each current time step, the phase volume fraction is the function of other phase variables. Therefore, it is necessary to iteratively solve the phase volume fraction equation when solving the volume fraction of a phase at any time step.
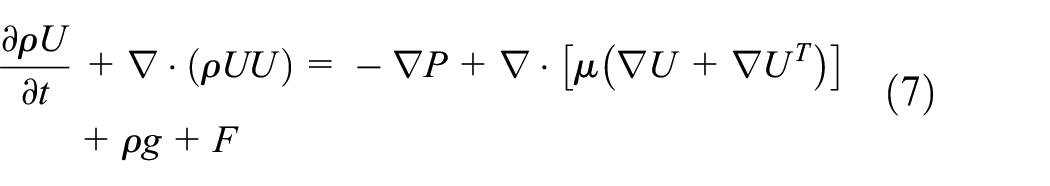
The model obtains the velocity field by solving a set of momentum equations in the entire computational domain, and the velocity field is shared by all phases. The momentum conservation equation is:
In this simulation,

The physical property parameters Density
In this model, the surface tension is used as the source term of momentum equation (7), which is given by:
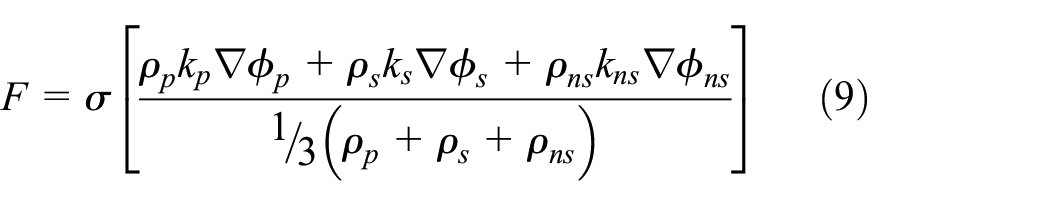
In equation (9),


According to the divergence theorem, the force at the surface can be converted to volume force. This volume force is the source term added in the momentum equation.
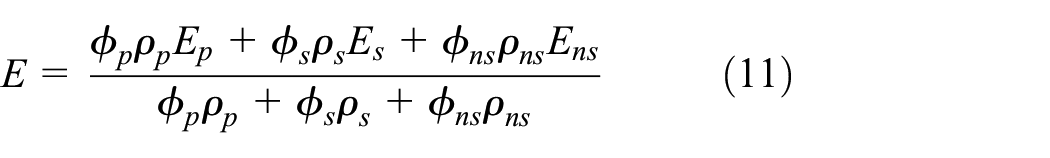
The energy equation is:
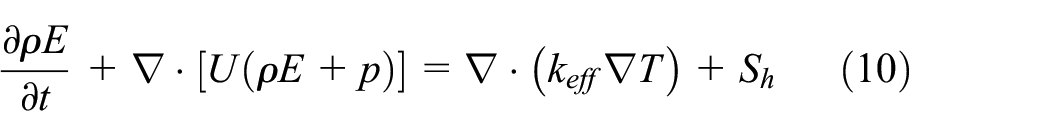
Energy is also shared by all phases, as shown below, where E and T represent energy and temperature, respectively, and they are all variables based on the average of mass,
In the formula, each phase
Model parameters
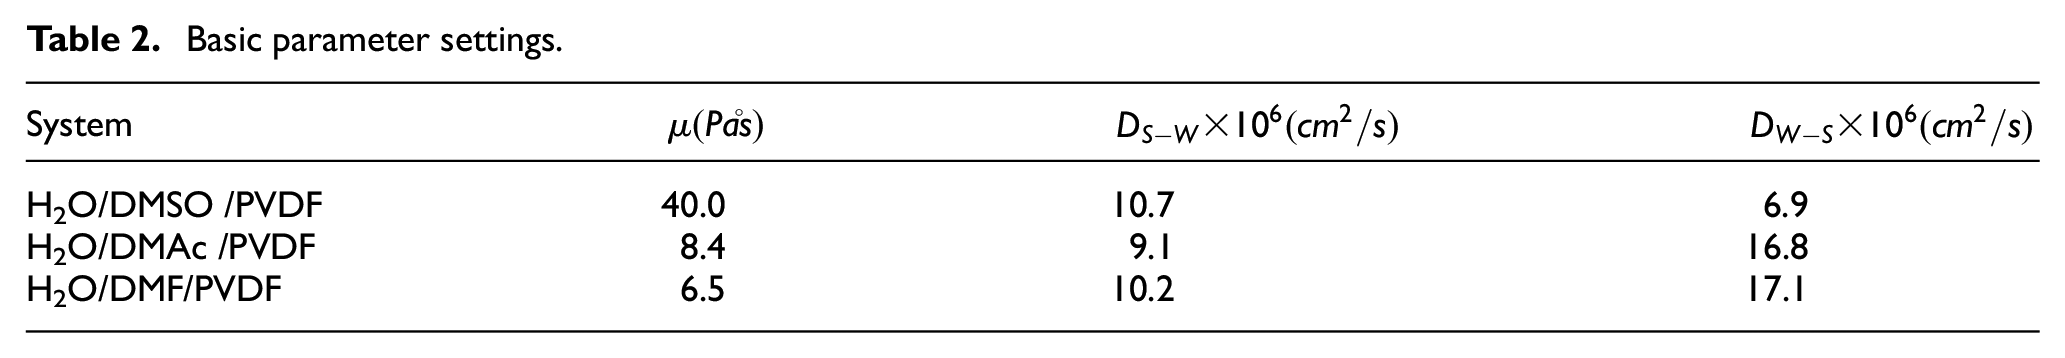
The unknown parameters in the established fluid model are set according to the existing parameters and determined by the built-in algorithm of the fluid software. However, some values cannot be determined accurately, which will be worked on in future research. Among them, the bi-directional diffusion coefficient of solvent-non-solvent is set based on previous research results 14 and are shown in Table 2.
Basic parameter settings.
Experiment
Experimental materials and reagents
PVDF raw materials were purchased from Shanghai Sanaifu New Material Technology Co., Ltd., model FR904. N,N-dimethylformamide (DMF), N,N-dimethylacetamide(DMAc), and dimethyl sulfoxide (DMSO) were purchased from Tianjin Comio Chemical Reagent Company, which were all analytical grade. The non-solvent was deionized water. The parameters of the three solvent systems are shown in Table 2.
We verified the accuracy of the model through experiments. Three groups of PVDF with different volume fractions were selected for experimental verification. The specific compositions are listed in (Table 3).
Components of each component.

Before the experiment, PVDF was dried in an oven at 60°C for 24 h to remove excess water, and an appropriate amount of solvent was measured in an Erlenmeyer flask. A certain amount of pure water was weighed and mixed in the solvent, then dispersed ultrasonically. Then a certain amount of PVDF was weighed and stirred in the mixed solution at a constant temperature in a 60°C-water bath for 10 h until PVDF was completely dissolved. 15 The final solution was ten stood in a 60°C water bath to defoam for 12 h. The casting solution was scraped on the glass plate with a spatula (choose a thickness of 200 µm), and was immersed immediately it in a pure aqueous solution at a room temperature of about 20°C for phase inversion. 16 The water was changed every 8 h for the first 3 days, and once a day for the next 4 days. Seven days after, the membrane was deemed to have completed the phase inversion, and it was stored in pure water for later use.
A field emission scanning electron microscope was adopted to observe the morphology and the structures of the upper and lower surfaces as well as the end surfaces of the film (SEM, DSa100, Hitachi, Japan). A wide-angle X-ray diffractometer was employed to analyze the crystal structure and crystallinity of the film (Rigaku, Dnax-rA). The porosity of the membrane was measured by the dry and wet weight method
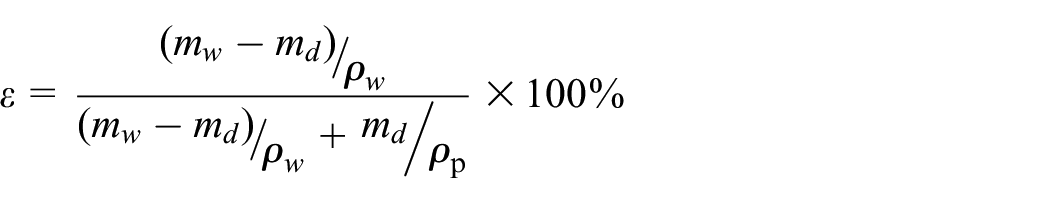
, in which the density of water at 20°C is 0.998 g/cm3, and the density of PVDF is 1.765 g/cm3.
The high-pressure flat membrane test machine was rinsed with pure water to test the membrane’s pure water flux

In the formula,
Results
During simulation, the initial conditions and related parameters need to be modified to adapt to the described immersion precipitation process. The fluid model focuses on the polymer solution part while modeling a small part of the coagulation bath to provide the correct immersion precipitation environment.
In addition, during the phase inversion process of the immersed precipitation membrane, the initial conditions present two layers (coagulation bath and polymer solution), which result in a large gradient difference, so the solvent and non-solvent gradient difference serves as the driving force for diffusion.
Simulation of PVDF membranes with different solvent systems
In the process of preparing membranes by the immersion precipitation phase inversion method, the solution system generally involves three components: polymer, solvent, and non-solvent. In the phase separation process, the solvent-non-solvent diffusion rate significantly affects the membrane structure. The key to the immersion-precipitation phase separation process is the bi-directional diffusion of solvent and non-solvent, 17 which is influenced by many factors, most notably the concentration of the film-forming polymer, the coagulation bath, etc. 18
The size of the simulation area is 125 nm × 250Vnm; the discrete grid points used in the simulation are 150 × 300; and the time step
The two initial conditions for the simulation of the systems A, B, and C are determined as:
(1) Polymer solution layer:
(2) Coagulation bath:
The morphological evolution is shown in Figure 1 (variation of polymer volume fraction (

Volume fraction of polymer (
Figure 1 shows the evolution diagrams of the volume fraction of the polymer PVDF with DMSO, DMAc, and DMF serving as the system solvent over time. For visual comparison, the initial volume fractions of the same polymer and solvent were controlled, and the graph of the change during the same period was intercepted. As can be seen, the changes of the three systems are roughly the same. The mutual diffusion of solvent and non-solvent is fast, but the polymer is almost stationary in the polymer solution area, and the coagulation bath is blue constantly (low polymer volume fraction). The phase separation process starts from the top of the polymer solution layer and proceeds downward in the layered structure, 19 which is resulted from the interactions of uniform energy and gradient energy driven by the planar interface between the polymer solution and the gel bath. It is similar to the “short-wavelength composition wave” described by Allen and Cahn 20 in the iron-aluminum system.
Over time, the spin amount decomposition proceeds in the entire layer, and then the particles are cooled to continuously reduce the total free energy. As the diffusion progresses, we can clearly observe the uneven distribution of the volume fraction of PVDF, which also verifies that the final morphology of the PVDF film is asymmetric 21 with a dense skin layer, which is similar to experimental observations. The simulation results are shown in this figure. At a certain stage of coarsening, the top layer is broken, indicating that the top layer is destroyed during the diffusion process. This is because there is no clear setting for the final equilibrium concentration during the diffusion, which will also be worked on in our next research.
During the film formation process, the polymer solution is divided into two phases, a polymer-rich solid phase and a solvent-rich liquid phase, with the polymer-rich solid phase forming the membrane skeleton and the solvent-rich liquid phase forming the membrane pores. The volume fraction distribution of the polymer in the simulation is used to determine the membrane formation, that is, the grid with the larger polymer volume fraction is considered as the membrane skeleton and the grid with the smaller polymer volume fraction is considered as the membrane pores. The DMSO system has the largest membrane pore size, the DMAc system has the most pores, and the DMF system has the least pores but slightly larger pore size compared to the DMAc system. Therefore, it can be predicted from the simulation graph that among the three systems in terms of pure water flux, the order of solvent influence on membrane performance is: DMSO > DMAc > DMF. The lamellar structure of DMAc and DMF systems is more obvious. At the same time, in the polymer solution layer, the degree of polymer dispersion gradually increases, and the blue part appears gradually, that is, the volume fraction of polymer in the grid is smaller in the time step, and the schematic representation of each color can be seen in Figures 1 to 3. The proportion of the blue part appears in the order: DMSO ≈ DMAc > DMF, which indicates that the diffusion rate of polymer in DMSO and DMAc system is faster than that in DMF system.

SEM photos of membranes prepared by PVDF casting solution with different solvents ((a) DMSO, (b) DMAc, and (c) DMF) ((a) and (c) are 500 times magnification, and (b) is 1300 times magnification).

The effect of changing the initial components in the polymer solution on the morphology of the PVDF membrane. The points in the ternary diagram represent the initial conditions of the corresponding simulation results.
Figure 2 shows the electron micrographs of films formed by three different solvent systems. The system can be ranked as DMAc > DMF > DMSO in terms of the stability. Generally, unstable systems are prone to instantaneous phase separation and form porous membranes, while stable ones tend to delay phase separation and form relatively dense membranes. Therefore, based on the PVDF film formation mechanism studied by Cheng et al.,22,23 the membrane structures change from a porous one with mainly instantaneous phase separation to a dense one with predominantly delayed phase separation in the order of DMSO, DMF, and DMAc systems. For the DMSO and DMAc system sublayers, transient liquid-liquid phase separation occurs, and crystallization has little effect on the kinetic process, resulting in a sublayer with low crystallinity, high connectivity, and mainly large pores. The sublayer of the DMF system has delayed liquid-liquid phase separation, and crystallization has a great influence on the kinetic process, resulting in a honeycomb-like porous structure sublayer with high crystallinity.
The analysis of the membrane structure morphology from the kinetic process shows that the system with fast solvent/non-solvent diffusion is prone to instantaneous phase separation to form a porous membrane. In contrast, the system with slow diffusion is prone to delay phase separation and forms a relatively dense membrane. The structure of the membrane should be changed from a denser membrane based on delayed phase separation to a porous membrane based on liquid-liquid phase separation in the order of DMSO, DMAc, and DMF.
Table 4 shows the measured porosity and water flux of the three different solvent systems after membrane formation. The simulation predictions were verified experimentally, and the order of solvent effects on membrane performance in terms of pure water flux was DMSO > DMAc > DMF.
Properties of membranes prepared by different solvent system.

In this experiment, all three types of membranes were formed with an asymmetric membrane skin prior to the sublayer, which prevents the solvents in the membrane sublayers from exchanging with non-solvents in the coagulation bath, and has a significant impact on the formation of sublayers.
Simulation of initial concentration on PVDF membrane
Next, for the H2O/DMAc/PVDF system, the initial composition of the polymer solution was changed to study its effect on the membrane morphology.
Figure 3 shows the ternary phase diagram and simulation results combining the three systems B, D, and E in Table 3. The black dots represent the different initial conditions simulated in the (Table 3) series. The simulated change diagrams of the three polymer systems with different concentrations of B, D, and E are roughly the same. Among them, the simulation diagram with a diffusion time (
It can be seen that during the diffusion, as the volume fraction of PVDF in the polymer solution increases from a lower level, the top layer of the polymer solution layer does not break during the coarsening process but rather break when the fraction reaches a certain level, and the polymer volume fraction in the coagulation bath increases first then stayed consistent. As the volume fraction of the polymer is increased, the resulting morphology will change from a bi-continuous mode to an isolated droplet, showing that the fraction determines the morphology as it determines the spinodal position of the system and the ratios of the two phases.
From the simulation results in the figure, it can be seen that as the initial polymer concentration increases, breaking the laminar flow structure of the polymer solution layer, the membrane pores become more porous and the pore size becomes larger, and it can be seen that the pure water flux decreases in the order of the three system fluxes.
Figure 4 shows the SEM photograph of the membrane prepared by the three systems in Table 3. As the polymer concentration increases, the dense surface layer of the membrane will thicken and the permeability of the membrane will decrease, thus reducing the porosity, the interconnection between pores, the pore size,24,25 and the formation of macroporous structures. 26 For porous membranes, instantaneous liquid-liquid phase separation occurs at different polymer concentrations, but for high-concentration polymer membrane-forming liquids, the polymer concentration at the film/gel bath interface is higher, which will result in higher porosity. With a low porous surface layer, the water flux of the formed membrane is also small.

SEM photos of membranes prepared with different volume fractions of polymer PVDF ((a) 20%, (b) 15%, and (c) 10%) (both are 1300 times magnified images).
Table 5 shows the porosity and water flux after film formation for three different polymer concentration systems. The simulation predictions were experimentally verified, both water flux and porosity increased sequentially with decreasing polymer concentration.
Properties of membranes prepared with different PVDF concentrations.

Discussion
As shown in Section 3.1, according to the maximum volume fraction of the polymer in the red part of each time step, draw the trend chart (Figure 5). As can be seen from this figure, the increasing trend of curve c is flatter than curves a and b. In the early stage, curve a has greater growth rate than curve b, but as diffusion proceeds, curve b exceeds a until the two curves overlap. Throughout the process, curves b and c show almost linear growth, while curve a shows a shallow s-shaped growth.

The trend graph of the maximum volume fraction of the red part of the polymer in each step ((a) DMSO, (b) DMAc, and (c) DMF).
The situation shown in Figure 5 is analyzed as follows: the viscosity of the solution affects the exchange rate of the solvent–non-solvent pair. Table 1 shows the viscosities of the three systems. When the solvent changes from DMF to DMAc and to DMSO, the viscosity of the casting liquid increases and the delay time is prolonged.
In the DMSO solvent system, the casting liquid has the highest viscosity, so the delay time of the skin liquid and solid phase separation is longer. The formation of the skin layer hinders the mutual mass transfer between the sublayer and the coagulation bath. In addition, in the DMSO solvent system, the diffusion coefficient from solvent to non-solvent
Compared with the DMSO solvent system, the DMAc solvent system has lower viscosity of the casting liquid and shorter phase separation delay time of the skin layer. In addition, opposite to the DMSO system,
The DMF system has the smallest viscosity and its skin layer has the shortest delay time for phase separation. Like the above two systems, its liquid-liquid phase separation occurs in the sublayer. But its diffusion coefficient is the largest, and
The film formation mechanism of PVDF can be discussed in stages. 27 Different film layers have different phase separation behaviors, which are affected differently by thermodynamics and kinetics differently; that is, different membranes have different thermodynamic properties and kinetic processes. There were primary and secondary controls on the membrane structure during the layer formation.
Conclusions
A fluid model was developed to simulate the phase separation process caused by concentration differences in polymer solutions. The effects of the concentration of the film-forming polymer and the composition of the solidification bath on the structure and properties of the films were mainly investigated. The following conclusions were obtained by comparing the graphs of the simulation results with the experimental results and analyzing them.
The phase separation process is observed in the simulated results graph to start from the top of the polymer solution layer and proceed downward in the laminar structure. Also the influence of the solvent on the membrane pure water flux is in the order of DMSO > DMAc > DMF, where the laminar structure is more pronounced in the DMAc and DMF systems.
In the same system, as the initial PVDF concentration increases, the simulated morphology will change from a bicontinuous mode to an isolated droplet, and the higher PVDF concentration will break the laminar structure of the polymer solution layer, the membrane pores become more numerous, the pore size becomes larger, and the pure water flux decreases in the order of the three system fluxes. And the validity of the model was verified by corresponding experiments.
Modification instructions
For the summary was streamlined;
Added the interpretation of symbols in the model control equations in Table 1;
The source of the solvent is noted;
Changed the formula for calculating water flux;
The analysis of simulation plots for different solvent systems was added, and the corresponding experimental section was advanced from the discussion section, and the simulation results were compared with experiments for verification analysis.
Only film pore-related properties can be observed in the simulated plots, so the data for film thickness and film crystallinity in Tables 4 and 5 have been deleted and briefly described in the table.
Figure 3 was revised according to the reviewer’s suggestion, as well as the order of electron microscopy photos in Figure 4;
The discussion of film formation for different solvent systems is streamlined, deleted reference 25 from the original manuscript;
Revamped the conclusion section;
Figure 3 was redrawn, so references20,21 were partially omitted from the description of the figure.
Footnotes
Acknowledgements
The authors would like to acknowledge School of Urban Planning and Municipal Engineering of Xi’an Polytechnic University for providing experimental equipment. The authors would like to acknowledge mentors from the Changqing Oil Field Company and the Xi’an Polytechnic University for their guidance and insight on the direction of the project.
Handling Editor: Chenhui Liang
Author contributions
Conceptualization: Ping Fang; software: Kang Liu and Chaoyu Yang; writing – original draft preparation: Kang Liu; writing – review and editing: Ping Fang; supervision: Ruihua Shao, Yan Li, and Wei Ji. All authors have read and agreed to the published version of the manuscript.
Declaration of conflicting interests
The author(s) declared no potential conflicts of interest with respect to the research, authorship, and/or publication of this article.
Funding
The author(s) disclosed receipt of the following financial support for the research, authorship, and/or publication of this article: This work was supported by the Key R&D Projects in Shaanxi Province (grant number 2021NY-188).
Data availability statement
The data presented in this study are available in the article. The other data of the relevant models used to support the findings of this study are available from the corresponding author upon request.