
Abstract
In the process of high-efficiency milling of titanium alloys, cutting vibration causes the frequent changes in the contact relationship between the flank face of the cutter tooth and the workpiece. The instantaneous friction speed, friction force and energy consumption of the milling cutter thus change continuously, resulting in the difficulty to precisely control the wear and life of milling cutter. This has become a bottleneck of restricting the further improvement of the cutting performance of high energy efficiency milling cutter. In this work, the model of instantaneous friction velocity and friction energy consumption of the flank face of the cutter tooth under vibration are developed. The distribution and evolution of instantaneous friction speed and friction energy consumption are studied. The proposed models are verified by high-efficiency milling experiments. The results show that the average relative error of the proposed model is 10.05%, by using this model, the influences of the cutting vibration on instantaneous friction energy consumption and friction wear boundaries could be effectively unveiled. The proposed model also could accurately describe the distribution and evolution of the above-mentioned parameters.
Introduction
With its excellent cutting performance and lightweight design, high energy efficiency milling cutter is widely used in high-speed and high-efficiency machining of large aircraft parts represented by titanium alloy structural parts. In the process of high energy efficiency milling cutter processing, affected by factors such as cutter tooth error, milling vibration, etc., the instantaneous friction boundary between the milling cutter tooth and the workpiece and the boundary of the wear area show nonlinear changes with contact angle.1–3 The degree of friction and wear of milling cutter and the overall service life are difficult to accurately predict, which has become a bottleneck restricting the further improvement of performance of high energy efficiency milling cutter.4–6
In the process of high-efficiency milling, under the action of cutting force and centrifugal force, high-frequency and small-scale random vibrations are generated between the milling cutter and the workpiece, which makes the contact angle between the flank face of the milling cutter and the workpiece dynamically change, resulting in uncertainty in the relative speed, mechanical state, enclosed boundary and enclosed area of the contact area between the flank face of the tool tooth and the workpiece.7,8 Therefore, it is difficult to accurately predict the instantaneous friction speed, friction force and energy consumption rate of milling cutter tooth. The above results, under the influence of the milling cutter’s long-term cutting, can easily lead to the complexity of the friction boundary, the friction speed evolution and the distribution state of the flank face.
At present, the measurement and characterization of the flank face friction of milling cutter tooth mainly focus on the maximum wear width, ignoring the characteristic information of the entire wear boundary of the flank face. Wang et al. 9 examined the microstructure and compositional characterization of worn tool inserts using SEM and EDS analysis. Oliveira et al. 10 tested different tools wear under finishing, roughing, and moderate machining conditions. Wu et al. 11 studied the effect of aspect ratio on the machining process during milling of titanium alloys. Saketi et al. 12 studied the wear characteristics of the cutting tool in the milling process of two different quenched cold work tool steels, High-resolution field emission gun scanning electron microscope, energy spectrometer, Auger electron spectrometer and optical surface profiler were used to detect worn blades. The results show that due to friction chemical reaction, adhesive wear, slight abrasive wear, tooth face wear and crater wear were controlled by continuous wear. Vipindas and Mathew 13 studied the wear behavior of TiAlN-coated solid tungsten carbide tools in the process of milling Ti-6Al-4V, the tool wear was studied from the aspects of tool face wear, adhesive wear, abrasive wear, blade radius increase, coating layering, etc. The cutting tool wear and face finish were characterized by a three-dimensional optical profiler. Zheng et al. 14 conducted a high-speed turning test under dry conditions. In the turning test, the cutting tooth flank wear width was measured and revealed the anti-friction performance and wear mechanism of TiAlN/TiN coated tools on high-strength steel. With the change of sliding speed and load, the wear amount and wear rate of the coating showed an opposite trend. An et al. 15 studied the changes of Ti6Al4V side milling tool wear, cutting torque and surface topography under four sustainable conditions. A theoretical model of the plane wear width VB was established, and the average prediction error was 15.87%. The above expression method of friction width cannot be used to accurately identify the specific geometric characteristics of the instantaneous friction boundary of the flank face.
At present, in terms of energy consumption model, Liu et al. 16 conducted experiments on the impact of tool wear on milling energy consumption and process sustainability. He pointed out that changes in process parameters and tool wear play a dominant role in energy consumption. He found that the increase in tool wear was the main reason for the increase in energy consumption. Li et al. 17 established an energy-saving optimization model for NC turning batch processing parameters that considers tool wear. This model considers the synergistic effect of tool wear status and process parameters on energy consumption. He pointed out that adjusting the process parameters according to the tool wear status can make the tool more in the low-wear area to process, which effectively reduced the total energy consumption. Lv et al. 18 had established three models for material removal energy consumption in the turning process: specific energy model (SEM), cutting force model (CFM), and exponential function model (EFM). He pointed out that the source of energy consumption model coefficients was the main reason that affects the prediction accuracy. Sealy et al. 19 simulated the energy consumption of precision hard milling, and they found that tool wear had the greatest impact on net cutting energy consumption. However, these studies mainly focus on qualitative analysis. There is still a lack of a clear expression of friction energy consumption changing with friction boundary.
This paper first proposed a method of identifying and characterizing the friction boundary of the flank face of cutter tooth and a method of selecting feature points in the friction area. Then, the dynamic cutting model of the milling cutter under the action of vibration was establish. The thermal-stress couple field simulation was carried out. According to the simulation effective stress distribution, a method to identify the characteristic points of the instantaneous friction boundary of the flank face was proposed. In order to solve the distribution function of friction energy consumption more accurately, a method for calculating the friction speed and friction force at the feature points was proposed. The proposed model is verified by cutting experiments.
Characterization of friction boundary of flank face
In order to characterize the characteristic and the friction boundary of the cutter tooth, the cutter tooth coordinate was established according to the geometric structures of the cutter tooth, and the milling cutter structure coordinate considering the error of the cutter tooth was established, as shown in Figure 1. The parameters explanation are shown in Table 1.

High energy efficiency milling cutter and cutter tooth coordinate.
Parameters explanation of high energy efficiency milling cutter and cutter tooth coordinate.

In Figure 1 o0-x0y0z0 is the milling cutter structure coordinate. The coordinate origin o0 is the intersection point between the center axis of the milling cutter and the plane where the lowest point of the cutter tooth is located. The z0 axis direction is the direction of the center axis of the milling cutter, and the y0 axis is determined according to the principle of the Cartesian coordinate. oi-xiyizi is the cutter tooth coordinate. The xi axis direction of the cutter tooth coordinate is the straight line direction of the two end points of the cutter tooth installation plane. The straight line direction passing through the inner cutter tip point of the cutter tooth and perpendicular to the cutter tooth installation plane is the yi axis direction. The intersection point is the coordinate origin oi. The direction of the zi axis is determined according to the principle of the Cartesian coordinate.
The instantaneous cutting behavior of the milling cutter and its cutter teeth directly affects the contact relationship between the flank face and the workpiece, thereby affecting the friction speed and friction force changes. In order to reveal the dynamic cutting process of the milling cutter under the action of vibration, the instantaneous contact relationship between the milling cutter and the workpiece at different cutting positions was characterized, as shown in Figure 2. The parameters explanation are shown in Table 2.

Dynamic cutting process of high energy efficiency milling cutter under vibration.
Parameters explanation of dynamic cutting process of high energy efficiency milling cutter under vibration.

According to the dynamic cutting process of the milling cutter under the action of vibration, the trajectory of the coordinate origin of the milling cutter coordinate was calculated, as shown in equation (1).

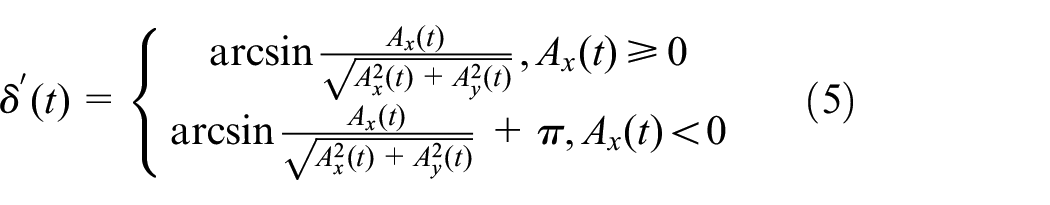
The deflection angle of the milling cutter caused by vibration can be expressed by the attitude angle and the direction angle of the milling cutter. The solution of the attitude angle can be solved by first calculating its two projection angles, such as equations (2) and (3). Then the projection angles were synthesized and solved, as shown in equation (4). The solution of the direction angle is shown in equation (5).


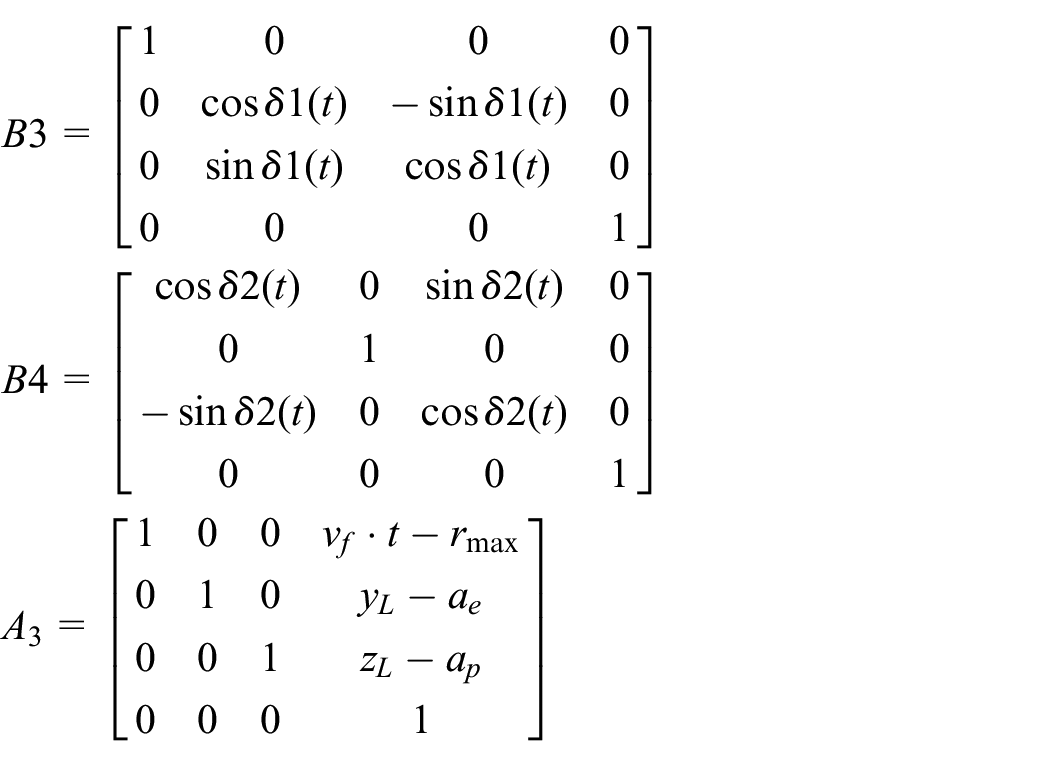
The matrix transformation relationship between the coordinate in Figure 2 can be used to solve the trajectory equation of any point on the cutter tooth, as shown in equation (6).

In the equation, each matrix is specifically expressed as follows:

Equations (1)–(6) can be used to calculate the motion trajectory and attitude angle of the milling cutter and cutter tooth under the action of vibration, which reflects the irregular changes in the position and posture of the cutter tooth during the machining process. This irregular change directly leads to the uncertainty of the contact relationship between the flank face of the cutter tooth and the workpiece, which will cause many inflection points on the boundary of the friction area, and these inflection points constitute the friction boundary.
In order to identify the friction boundary and the inflection points, the basis for identification was proposed. The basis is that there is a clear difference in color between the friction and non-friction areas. The inflection points with obvious color gaps were identified. These points were connected to form the friction boundary, as shown in Figure 3.

Characterization of the friction boundary and selection of its feature points.
The speed and force of points at different positions in the friction area are different. In order to comprehensively evaluate the distribution of speed and force in the entire friction area, a method for selecting feature points in the friction area of the flank face was proposed. The sections parallel to the plane yioizi were taken at equal intervals on the flank face, and the interval size was Δxi. The intersection of any section x = xie and the friction upper boundary is denoted as e1, and the intersection of any section with the friction lower boundary is denoted as e2. e1 and e2 are the feature points of the friction upper boundary and the friction lower boundary. e is the point between points e1 and e2 on the section. The method for selecting feature points is also shown in Figure 3, and the parameters explanation are shown in Table 3.
Parameters explanation of the characterization of the friction boundary and selection of its feature points.

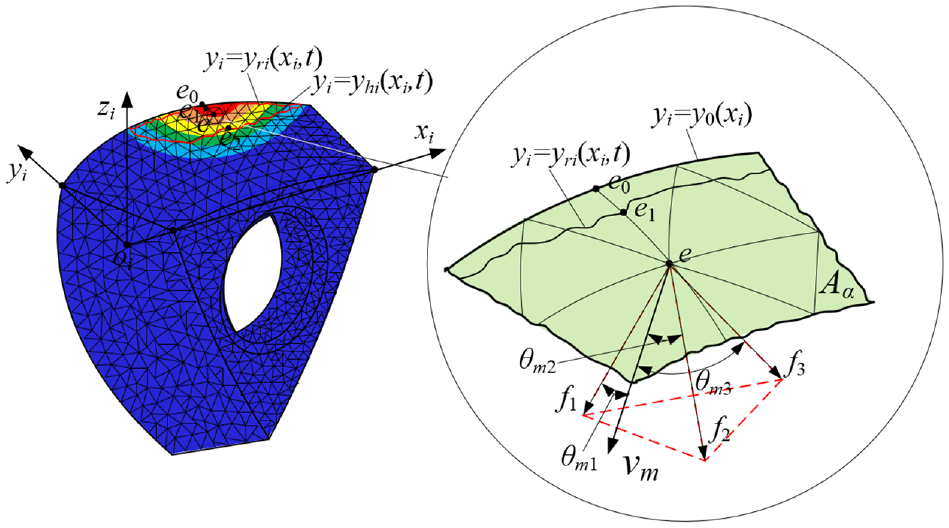
In Figure 3, yi = y0(xi) (i = 1,2,3) is the original boundary of the cutting edge of the cutter tooth i. yi = yri(xi,t) (i = 1,2,3) is the friction upper boundary of the flank face of cutter tooth i when the cutting time of the milling cutter is t. yi = yhi(xi,t) (i = 1,2,3) is the friction lower boundary of the flank face of cutter tooth i when the cutting time of the milling cutter is t.
The characterization method of the friction boundary and the selection method of the feature points provide a basis for the identification of the instantaneous friction boundary, and provide a basis for the construction of the friction energy consumption distribution function.
Identification of instantaneous friction boundary on flank face
The instantaneous friction boundary in the cutting process cannot be measured in real time through experiments. In order to obtain the instantaneous friction boundary at a certain moment, the stress of the cutter tooth during the cutting process was simulated.
The thermal coupling field simulation of the high efficiency milling cutter adopts the finite element simulation software Deform-3D. The milling cutter cutting process is simulated using its Machining [Cutting] module. UG was used to build tool and workpiece models and import them into the simulation module. The Johnson-Cook constitutive parameters of TC4 titanium alloy material are shown in Table 4.
Constitutive parameters of TC4 titanium alloy J-C.

In the Table 4, A, B, n, c, m are yield stress intensity, strain hardening constant, strain hardening exponent, strain rate hardening parameter, and temperature strain rate sensitivity, respectively.
The boundary conditions of the simulation are shown in Table 5.
Boundary conditions of finite element simulation.

The number of meshes divided by the cutter teeth in the simulation process is 500,000. In order to make the simulation results more accurate, when the workpiece is meshed with absolute size, the convergence effect is best when the step distance does not exceed 1/3 of the minimum element size of the workpiece grid element.
The simulated stroke is 5 m. The effective stress distribution cloud diagram obtained by simulation is shown in Figure 4.

Effective stress distribution cloud diagram of the flank face.
According to the distribution of effective stress in Figure 4, a method for judging the instantaneous friction boundary of the flank face was proposed.
The friction upper boundary was formed by the wear of the cutting edge. From the perspective of material mechanics, the wear of the cutting edge of the milling cutter is due to the cutter tooth material reaching its yield strength σs. Therefore, the yield strength can be used as the basis for judging the feature points of the instantaneous friction upper boundary of the flank face of the cutter tooth. If the effective stress of a point reaches the yield strength, this point is the feature point e1 of instantaneous friction upper boundary. In order to find these feature points, the parallel sections were taken on the flank face. The sections x1 = 6.36, x1 = 7.36, and x1 = 8.36 were taken as examples, the effective stress distribution along these sections were constructed, as shown in Figure 5.
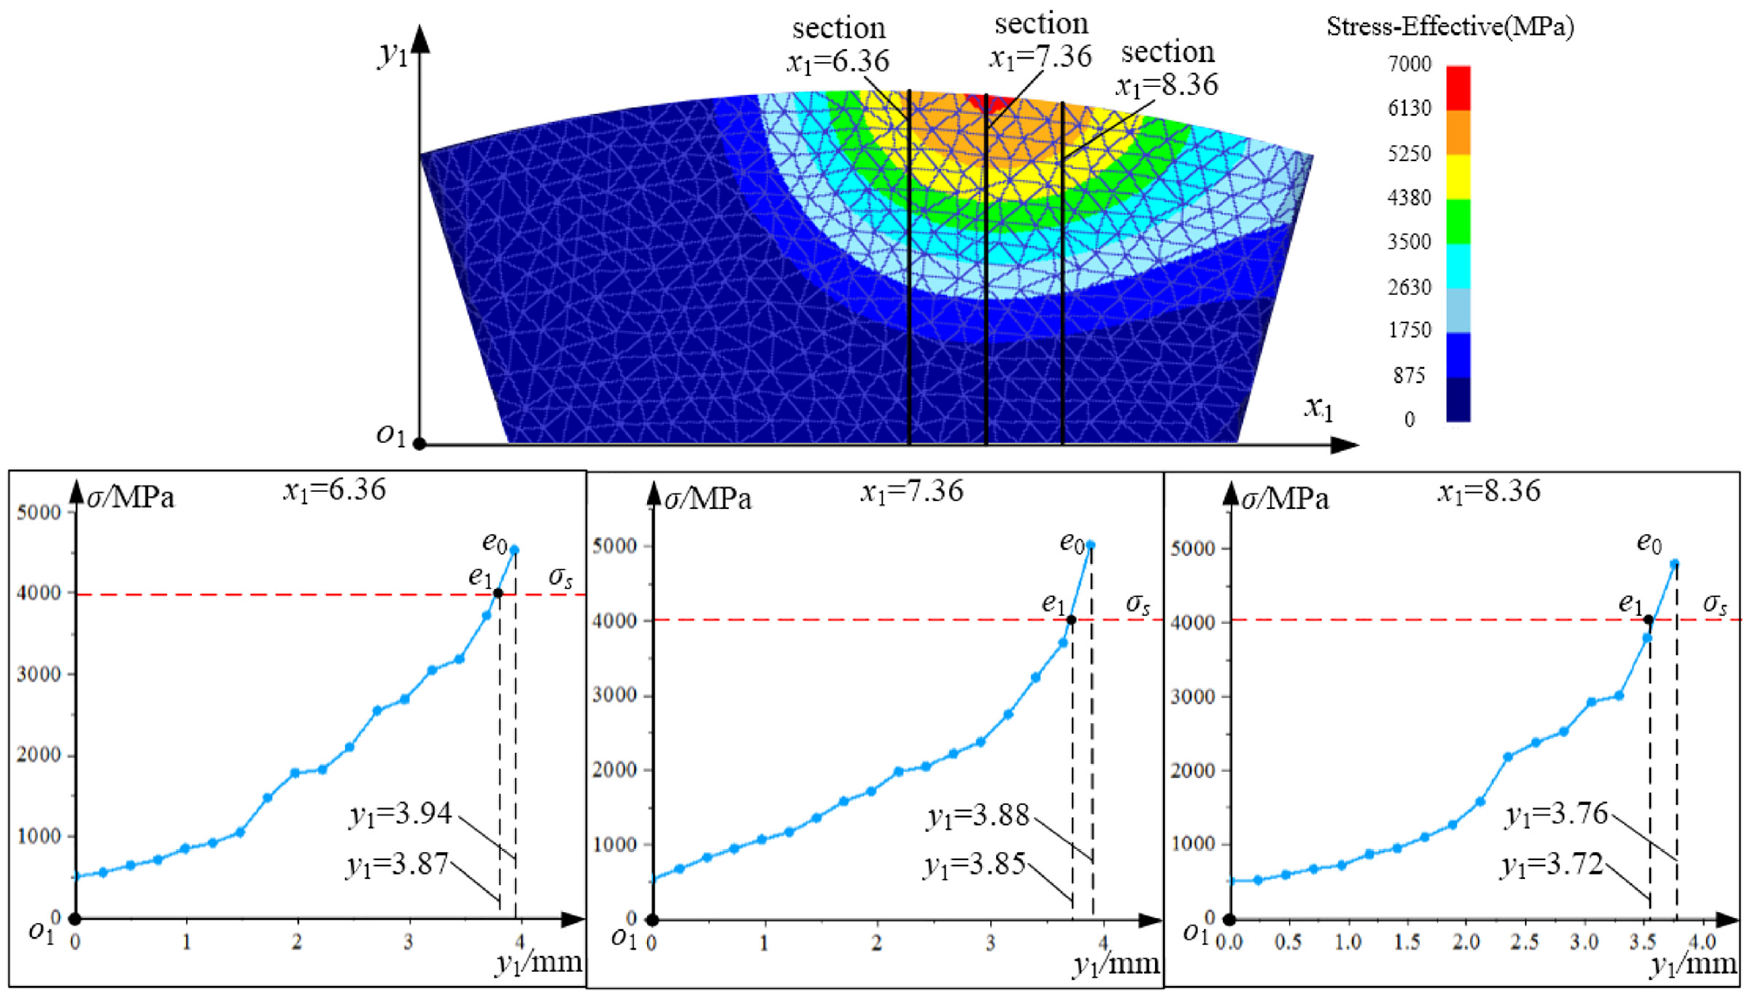
Effective stress distribution of the flank face.
In Figure 5, the coordinates of the feature points e1 on the sections x1 = 6.36, x1 = 7.36, and x1 = 8.36 were identified. More sections were taken, and the feature point e1 on each section was judged by the method in Figure 5. When all the feature points were connected, the instantaneous friction upper boundary of the flank face could be constructed, as shown in Figure 6.

Instantaneous friction upper boundary of flank face.
The instantaneous friction upper boundary in Figure 6 was identified by yield strength σs. Because the instantaneous friction lower boundary may not reach the yield strength, yield strength σs cannot be used to determine the instantaneous friction lower boundary.
Because the instantaneous friction lower boundary is the boundary between the friction area and the non-friction area of the flank face, to identify the feature point e2 of it, it is necessary to analyze the stress of the friction area and the non-friction area. During the cutting process, stress concentration will be formed in the friction area, which leads to a large difference in the effective stress between the friction area and the non-friction area of the flank face. According to this stress distribution, as long as the position where the effective stress on the flank face changes the most, the feature point of the instantaneous friction lower boundary can be found. The position where the effective stress changes the most can be judged by solving the effective stress change rate.
The three sections in Figure 5 were taken as examples. The effective stress change rate at these sections was calculated, as shown in Figure 7.

Effective stress change rate of flank face.
In Figure 7, the coordinates of the feature points e2 on the sections x1 = 6.36, x1 = 7.36, and x1 = 8.36 were identified. More sections were taken, and the feature point e2 on each section was judged by the method in Figure 7. When all the feature points were connected, the instantaneous friction lower boundary of the flank face could be constructed, as shown in Figure 8.

Instantaneous friction lower boundary of flank face.
The instantaneous friction lower boundary in Figure 8 and the instantaneous friction lower boundary in Figure 6 together constitute the boundary of the instantaneous friction area. This boundary defines the range of instantaneous friction energy consumption that needs to be calculated. The identification of the instantaneous friction boundary of the flank face of the cutter tooth is the basis for constructing the distribution function of the instantaneous friction energy consumption.
Instantaneous friction energy consumption distribution function on flank face
Determination of friction speed
In order to solve the distribution function of the instantaneous friction energy consumption of the flank face more accurately, the friction speed and friction force were calculated. The calculation of friction speed can be obtained by partial derivative of the cutter tooth trajectory with respect to the cutting time.
The equation (7) of the cutter tooth trajectory could be calculated by matrix operation on the equation (6).

The equation (8) of the movement speed of any point on the cutter tooth in the directions of the three coordinate axes x, y, and z was calculated:

In Figure 9, G(x(t), y(t), z(t)) is the flank face equation of the cutter tooth. I(x(t), y(t), z(t)) is the transition face equation of the workpiece. Aα is the flank face. θvm(t) is the space angle projected by the flank face movement speed and the movement speed in the common tangent plane when the cutting time is t. vm is the friction speed. −vm and vm are equal in size and opposite in direction.

Method for solving the friction speed of feature points in the friction area.
The direction of the friction speed on the flank face is determined by the contact relationship between the flank face and the workpiece. The direction of the friction speed should be the opposite direction of the projection of the movement speed on the common tangent plane. The common tangent plane could be solved by separately obtaining the partial derivatives of the two contact surfaces and then simultaneously solving the equations, as shown in equation (9).

The unit direction vector projected by the movement speed on the common tangent plane can be expressed as equation (10) in the workpiece coordinate.

Where mx, my, and mz are the unit coordinate values of
The movement speed of the feature point of the flank face was also expressed in the form of a vector in the workpiece coordinate:

Where vx(t), vy(t), and vz(t) are the velocity components of the movement speed vv(t) at the feature points of the flank face in the directions of the x, y, and z axes.
The friction speed vm(t) was calculated by equation (12).

Where θvm(t) can be calculated by equation (13).

The friction speed of the feature point of the flank face was expressed as a vector in the workpiece coordinate:

Where vmx(t), vmy(t), and vmz(t) are the velocity components of the friction speed vm(t) at the feature points of the flank face in the directions of the x, y, and z axes.
In order to calculate the friction energy consumption in the same reference coordinate, the friction speed was transformed into the cutter tooth coordinate through coordinate transformation, as shown in equation (15).

The vector of the friction speed of the feature point in the tooth coordinate was expressed as follows:

Determination of friction force and friction energy consumption
In order to calculate the magnitude of the effective stress component in the friction speed direction, a decomposition model of the effective stress was established, as shown in Figure 10, the parameters explanation are listed in Table 6. The grid divided in the simulation process was a tetrahedron, so the vector sum of the stress along the three edges should be the same as the effective stress of the feature point, which converted the effective stress at the feature point into three directional stresses.
Effective stress decomposition model on the flank face.
Parameters explanations of effective stress decomposition model on the flank face.

According to the effective stress distribution of the flank face, the effective stresses f1, f2, and f3 were expressed in vector in the cutter tooth coordinate, as shown in equation (17).

In the equation, xf1, yf1, and zf1 are the force components of the effective stress f1 in the xi, yi and zi axis directions, xf2, yf2, and zf2 are the force components of the effective stress f2 in the xi, yi and zi axis directions, xf3, yf3 and zf3 are the force component of the effective stress f3 in the xi, yi, and zi axis directions.
The three stresses were projected in the direction of the friction speed, and the calculation method was shown in equation (18).

In the equation, fq(q = 1,2,3) is the effective stress of the three sides of the tetrahedron. fqv(xi,yi,zi,t) is the component stress of fq in the direction of friction speed. θmq(t) is the angle between the three effective stress vectors and the friction speed vector, and its magnitude was calculated by equation (19).

The effective stress vector sum in the direction of the friction speed is the friction force, as shown in equation (20).

According to equations (16) and (20), the instantaneous friction energy consumption distribution function of the flank face was constructed, as shown in equation (21).

The distribution function of instantaneous friction energy consumption on the flank face of the cutter tooth is constructed by equations (7)–(21). It can be used to calculate the instantaneous friction energy consumption at any point in the friction area of the flank face, and obtain the instantaneous friction energy consumption distribution state of the entire flank face.
Distribution and evolution of friction energy consumption on flank face
Distribution of friction energy consumption
Due to the direct contact between the flank face of the milling cutter and the machined surface, the magnitude and distribution of friction energy consumption on the flank face of the milling cutter directly affect the friction and wear state of the flank face and the quality of the machined surface. Therefore, this paper mainly studies the distribution and evolution of friction energy consumption on the flank face of milling cutter teeth.
In order to calculate the distribution and evolution of the friction energy consumption of the flank face, the instantaneous friction energy consumption is calculated according to the proposed distribution function of the instantaneous friction energy of the flank face. The distribution of the instantaneous friction energy consumption of the feature points along the yi axis of the cutter tooth coordinate was constructed. The change of the instantaneous friction energy consumption of the feature points with the contact angle θd was constructed.
Three sections x1 = 4.36, x1 = 5.36, and x1 = 6.36 were taken on cutter tooth 1, and the distribution of friction speed and friction force along the yi axis of the cutter tooth coordinate were drawn, as shown in Figures 11 and 12.

Distribution of instantaneous friction speed on the flank face.

Distribution of instantaneous friction force on the flank face.
Figure 11 shows the distribution of the instantaneous friction speed at the three sections on the flank face of the cutter tooth 1. The shaded area in the figure is the non-friction area on the flank face. In this area, the tooth does not contact the workpiece. So the friction speed in this area is zero. The boundary between the non-friction area and the friction area of the flank face is the friction lower boundary. Due to the influence of vibration during the cutting process, the contact relationship between the flank face of the cutter tooth and the workpiece is constantly changing. Therefore, the friction lower boundary changes irregularly at all times. And the feature point e2 of the friction lower boundary at different sections is not at the same coordinate position. The friction upper boundary is formed by the wear of the original cutting edge. Since the occurrence of wear is also irregular, the feature point e1 of the friction upper boundary at different sections is not at the same coordinate position.
In the friction area, the friction speed on the same section will not change much. The reason is that the friction speed of the feature point is a velocity component of the movement velocity. The changes of movement speed play a decisive role in the friction speed. A major component of the movement speed is the cutting speed produced by the milling cutter speed. The cutting speed is affected by the radius of gyration. The radius of gyration of the feature points on the same section is different, but the difference is very small. Therefore, the friction speed change trend on the same section is not obvious. The friction speed of each section is enlarged and expressed separately, and its changing trend can be clearly seen. The relative positional relationship between the cutter teeth and the cutter body determines that the radius of gyration of the feature points on the section gradually increases along the positive direction of the y1 axis. Therefore, the friction speed on the same section increases along the positive direction of the y1 axis. The friction speed on different sections varies greatly. This is also mainly determined by the radius of gyration. Since the radial position of different sections is very different, the influence of the radius of gyration on its speed is much greater. The section x1 = 4.36 is the closest to the center of rotation, so the friction speed is the smallest. The section x1 = 6.36 is the farthest from the center of rotation, so its friction speed is the largest.
The friction force distribution interval of the three sections in Figure 12 is consistent with the friction speed. The friction force only exists in the friction area. The distribution of friction force in different sections is basically the same. The friction force of different sections increases along the positive direction of the y1 axis. During the cutting process, the friction area of the flank face of the cutter tooth interacts with the workpiece. However, because the area close to the friction upper boundary participates in the material removal of the workpiece, it will withstand greater interaction forces. This leads to greater friction force in the area close to the friction upper boundary. The friction force at the feature point near the friction upper boundary has a larger variation. The reason is that the part close to the friction upper boundary has a large interaction force with the workpiece when it participates in cutting, causing friction and friction changes to increase.
The instantaneous friction energy consumption of the entire friction area was calculated. The flank face was used as a reference surface with zero energy consumption. The instantaneous friction energy consumption surface of the flank face was fitted. The sections were taken on the friction energy consumption surface in the same way. The instantaneous distribution diagram of frictional energy consumption at the section along the y1 axis is obtained, as shown in Figure 13.

Distribution of instantaneous friction energy consumption on the flank face.
It can be seen from the fitted friction energy consumption distribution surface that the friction energy consumption of the friction area increases along the positive direction of the y1 axis. The frictional energy consumption value reaches the maximum at the friction upper boundary. And the frictional energy consumption is the smallest at the friction lower boundary. This distribution of friction energy consumption is the same as the trend of friction force. The reason is that due to the fact that the friction upper boundary participates in the removal of workpiece material and bears greater stress. The friction energy consumption in the friction area is distributed in the direction of the x1 axis with a middle height and a low side. Due to the irregular changes in the curved structure of the flank face and the contact relationship between the milling cutter and the workpiece, which makes the middle part of the friction area more likely to be squeezed. The middle part of the friction area is more stressed than the two sides, and the friction energy consumption is also greater.
Evolution of friction energy consumption
The friction speed, friction force and friction energy consumption of the feature points of the flank face of the cutter tooth 1 were calculated at different contact angles. The method of selecting feature points had been given in Part 1. This part selected three feature points on the same section as an example to calculate. They are the intersection point e1 between the section x1 = 5.36 and the friction upper boundary, the intersection point e2 between the section x1 = 5.36 and the friction lower boundary, and the point e between e1 and e2. The change of friction speed and friction force with contact angle at selected feature points are shown in Figures 14 and 15.
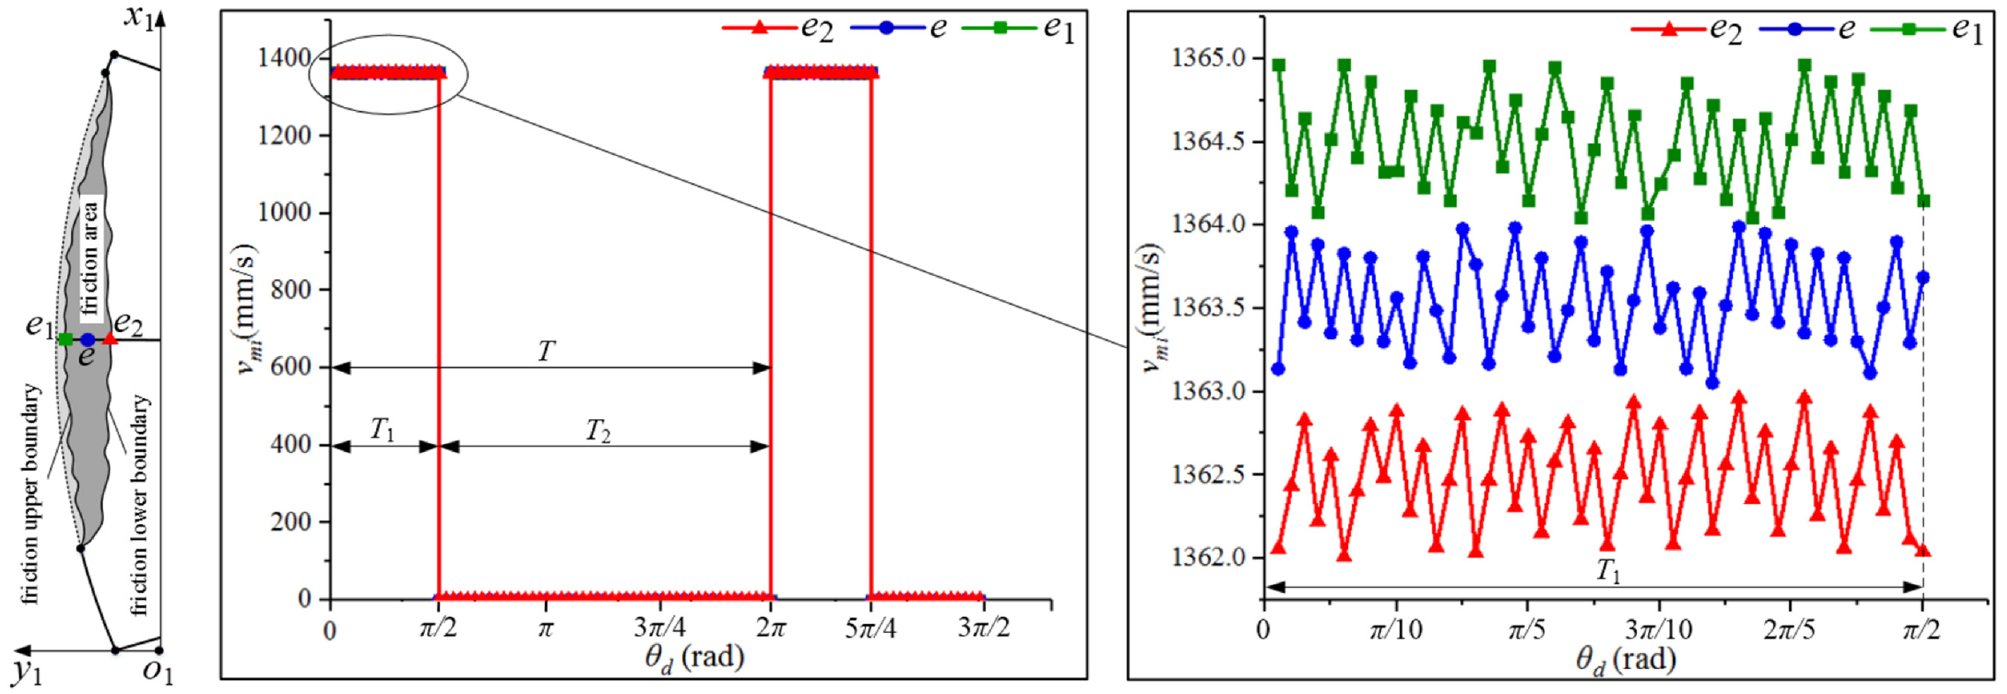
Variation of friction speed of flank face.

Variation of friction force of flank face.
On the whole, the friction speed changes periodically during the cutting process. In Figure 14, one cycle of friction speed is T. One cycle is divided into two parts, T1 and T2, by whether the friction speed is zero. The reason for the periodic change of friction speed is related to the structural parameters of the milling cutter itself and the cutting processing parameters. In the cutting process, each revolution of the milling cutter is a cycle T. Since the cutting width selected in the experiment is the same as the radius of gyration of the milling cutter, in a cycle T, the cutter starts to cut into the workpiece when the contact angle is 0, and cuts out the workpiece when the contact angle is π/2. The cutter tooth has friction speed on the flank face only when it participates in the cutting process. The part T1 in Figure 14 is the friction speed at the feature points of the flank face when the tooth 1 participates in cutting.
It can be seen from the right part of Figure 14 that the friction speed of the feature points fluctuate irregularly with the contact angle. This volatility is mainly affected by two factors. On the one hand, the vibration speed generated by the vibration has an impact on the speed of the cutter tooth movement, which in turn affects the change of the friction speed; on the other hand, the instantaneous friction boundary at different contact angles is different, resulting in the position coordinates of the feature point in the cutter tooth coordinate. When the change occurs, the radius of gyration of the feature point also changes, so the change in the movement speed of the feature point causes the friction speed to eventually change. In general, these two aspects indirectly affect the friction speed by influencing the movement speed.
In Figure 15, the feature point friction also changes periodically with the contact angle. The reason is the same as that of the periodic change of the friction speed in Figure 14, which is determined by the rotation period of the milling cutter and the period of a single tooth participating in the cutting. The friction force of the feature point also fluctuates irregularly with the contact angle. However, the reason for the irregular fluctuation is different from the friction speed. The main reason is that the instantaneous friction boundary change causes the change of the effective stress distribution on the flank face. At the same time, the change of the contact relationship between the milling cutter and the workpiece also affects the effective stress transmission effect on the flank face. Eventually, the friction force produced irregular changes.
The instantaneous friction energy consumption at multiple contact angles was calculated and fitted to the instantaneous friction energy distribution surface. Sections and feature points were taken on the energy consumption surface using the same method. The curves of frictional energy consumption at feature points with contact angle was plotted, as shown in Figure 16.

Variation of friction energy consumption of flank face.
It can be seen from Figure 16 that the areas and positions of friction energy consumption on the flank face at different contact angles are different. This is mainly determined by the change of the instantaneous friction boundary with the contact angle. The position of the maximum friction energy consumption of the entire flank face is also different. This shows that the most severe position of friction and wear at different contact angles has changed. The contact relationship between the flank face and the workpiece is constantly changing, resulting in uneven force distribution on the flank face, which changes the distribution of friction energy consumption on the entire flank face. The law of friction energy consumption at the feature point with the contact angle is similar to the law of friction in Figure 15. From Figure 14, it can be seen that the friction speed fluctuates only in a small range with the change of the contact angle, so the change law of friction energy consumption is more affected by the friction force. The change process of friction energy consumption is more susceptible to friction force.
Experimental verification
In order to verify the instantaneous friction energy consumption model, the cutting experiments of the high energy efficiency milling cutter were carried out. The cutting experiments were carried out on a three-axis milling machining center (VDL-1000E).
The energy efficient milling cutter used in the experiment is an indexable three-tooth equal-pitch milling cutter with a diameter of 32 mm produced by Walter, as shown in Figure 17. The titanium alloy material of model TC4 is used. The length, width and height of the titanium alloy workpiece are 250 × 100 × 20 mm.

Energy efficient milling cutter.
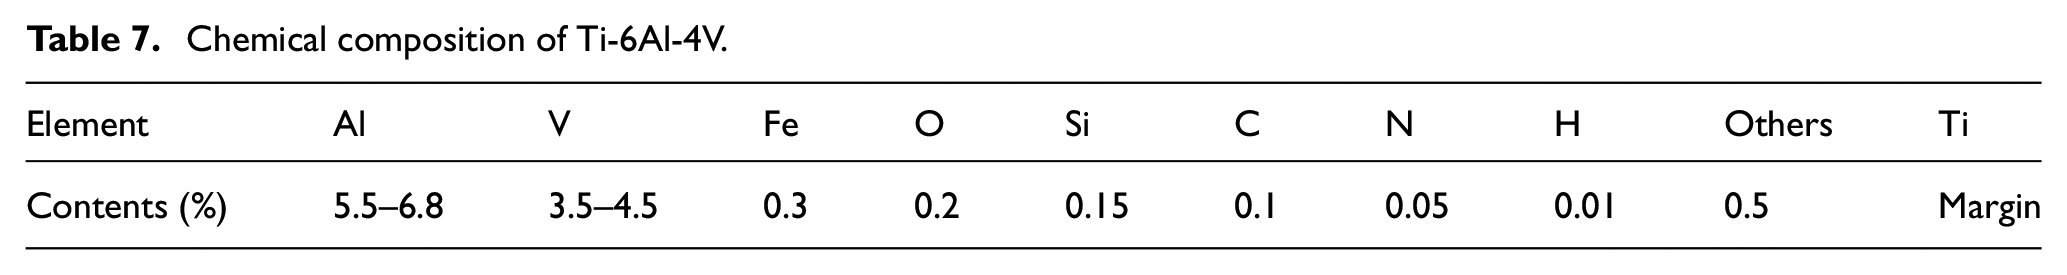
The grade of titanium alloy used in this study is TC4, and its chemical composition is shown in Table 7.
Chemical composition of Ti-6Al-4V.
During the experiments, the charge output PCB three-axis high-frequency acceleration sensor was used to collect the vibration acceleration signal at the workpiece surface to be processed. After the experiments, the DH5922 transient signal test and analysis system was used to process the vibration signal. The experiment setup is shown in Figure 18, and the specific experimental parameters are shown in Table 8.

Experiment setup.
Experiment parameters.

After the experiments, the friction boundary of the flank face of the milling cutter tooth was identified, and the boundary of the friction boundary were obtained, as shown in Figure 19.
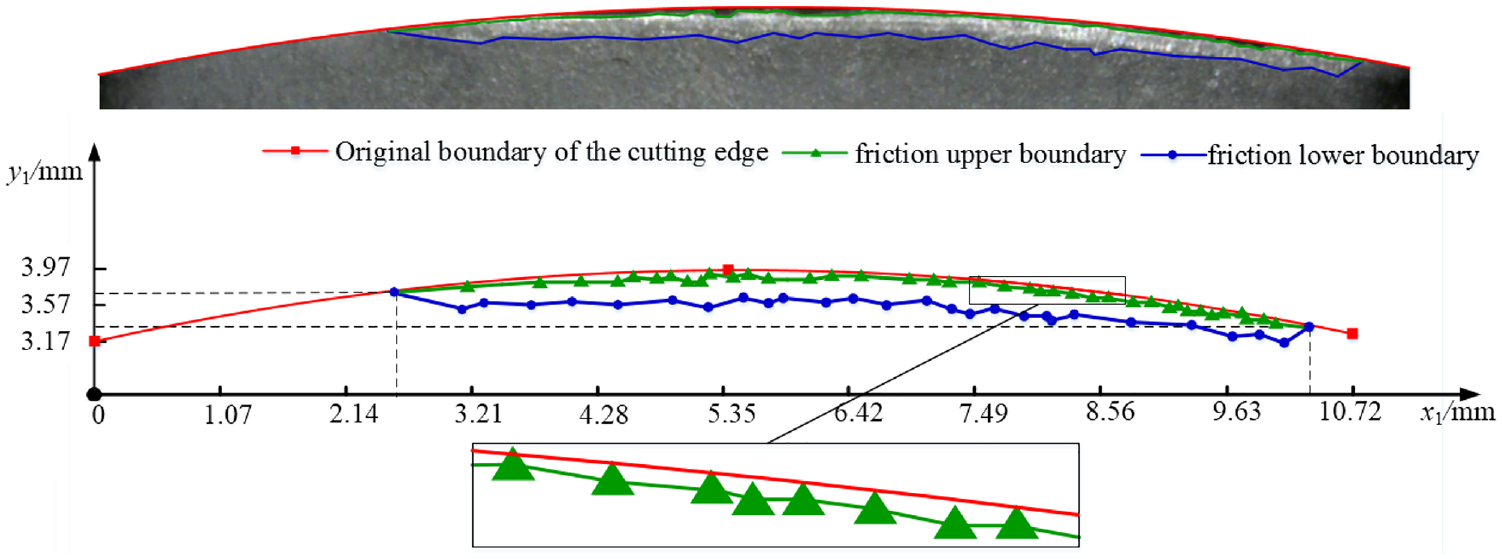
Experimental friction boundary.
Since the friction boundary measured by the experiments is the cumulative result of all instantaneous friction boundaries in the entire cutting stroke, when calculating the friction energy consumption boundary, multiple instantaneous friction energy consumption boundaries in the same cutting stroke should be calculated. These instantaneous friction energy consumption boundaries were accumulated, and the maximum outer contour of the boundaries were taken as the final friction energy consumption boundary. The final cumulative friction energy consumption boundary is comparable to the experimentally measured boundary. The instantaneous friction energy consumption surface at multiple moments were accumulated. The cumulative friction energy consumption boundary was identified, as shown in Figure 20.

The calculated boundary of friction energy consumption.
In order to compare the calculated and experimental friction boundary more intuitively, the boundary and inflection points were reconstructed in the cutter tooth coordinate, as shown in Figure 21.

Friction energy consumption boundary and friction boundary.
It can be seen from Figure 21 that the friction upper boundary obtained by calculating the friction energy consumption is more similar to the measured boundary, and the calculated friction lower boundary was also relatively similar to the measured boundary, but the boundary had a higher degree of similarity. The reason for the deviation of the inflection point between the calculated and measured friction boundary mainly comes from two aspects. On the one hand, it was the influence of the simulation error on the solution result. On the other hand, the inflection points of the friction boundary were affected by the unstable vibration during the experiment.
The curves alone cannot quantitatively characterize the degree of similarity between the solution and the change characteristics of the measured boundary. The method of relative error calculation needed to be used to further verify the effectiveness of the model and method.
The relative error is defined as:

Where W is the relative error, yp is the coordinate value of the calculated energy consumption boundary, and y1 is the coordinate value of the measured friction boundary.
By equation (22), the maximum relative error and the minimum relative error of the calculated and measured boundary coordinate values were calculated, and the calculation results are shown in Table 9.
The calculation results of the relative error.

From the results in Table 9, it can be seen that the maximum relative error between the calculated friction boundary and the actual measurement is 15.85%, the minimum relative error is 5.71%, and the average relative error is 10.05%. It shows that the calculation results of the friction energy consumption calculation model are in good agreement with the experimental results. The proposed model can reveal the evolution characteristics of the instantaneous friction energy consumption of the flank. It can realize the correct calculation of the instantaneous friction energy consumption of the flank face of the milling cutter tooth.
Conclusions
The dynamic cutting process model of the milling cutter under vibration was established. The motion trajectory and attitude angle of the milling cutter and cutter tooth were calculated in detail. The identification and characterization method of the friction boundary of the flank face were proposed. The selection method of the characteristic points in the friction area of the flank face was given.
The thermal-stress couple field simulation of the cutting process was carried out. And based on the simulated effective stress, a method to identify the feature points of the instantaneous friction boundary was proposed. The results show that the geometry and position of the friction boundary under the action of vibration are constantly changing, and the time-varying characteristics of the friction and wear behavior of the tool-workpiece interface are revealed.
A method for solving the friction speed of feature points in the friction area was proposed. The decomposition model of effective stress was established. The calculation method of friction force was given based on the decomposition model. The distribution function of instantaneous friction energy consumption on the flank face was established. The results show that the friction speed and force in the friction area of the flank face have volatility, and the value and direction of them are different with the change of position, which leads to that the distribution function of friction energy consumption is a multidimensional nonlinear function.
The identification methods of instantaneous friction speed, friction force and friction energy consumption distribution were proposed. A method to identify the evolution of friction speed, friction force and friction energy consumption was proposed. The high-efficiency milling machining experiments were carried out to verify the accuracy of the proposed model. The results show that the distribution of instantaneous friction energy consumption on the flank is high in the middle and low on both sides, and the friction energy consumption is the largest near the upper boundary. The frictional energy consumption varies with the contact angle in the same way as the frictional force. The average relative error between the calculated friction boundary and the actual measurement is 10.05%. It shows that the proposed calculation model of friction energy consumption is accurate.
Footnotes
Handling Editor: Chenhui Liang
Declaration of conflicting interests
The author(s) declared no potential conflicts of interest with respect to the research, authorship, and/or publication of this article.
Funding
The author(s) disclosed receipt of the following financial support for the research, authorship, and/or publication of this article: This work are supported by National Natural Science Foundation of China (51875145) and Natural Science Foundation of Heilongjiang Province of China (ZD2020E008).