
Abstract
The evacuated tube solar collector is a proper choice for converting solar energy into heat since it is efficient, practical, and cost-effective. In the current study, the role of nanofluid in porous medium was numerically investigated to improve the performance of a solar collector model and the potential to store energy. The governing equations for the suggested model were solved analytically in the fully developed region using the Forchheimer model. The investigation of the impact on temperature fluctuation in the solar collector was done by considering several factors such as medium porosity, pore diameter, nanoparticles with respect to the solid volume ratio, system pressure, and conduit radius. The governing equations for the entrance region were expressed in a non-dimensional form and solved using the finite difference method (FDM), with the resulting non-dimensional differential equation solved using MATLAB software. Various parameters, such as Prantel number (Pr) and fluid velocity, were examined, and the findings were shown in various diagrams. For the fully developed region, an analytical solution was obtained, and the findings were presented using the Mathematica® software. The results demonstrate that utilizing nanofluid and porous media improves the performance of the evacuated tube when compared to sole use of water. It was found that the temperature difference across the solar tube was enhanced by 10%–20%. In addition to that, the performance of the evacuated tube solar collector showed around 10% enhancement in the obtained temperature difference in cold months, when nanofluids were added. Also, the comparison between nanofluids using Forchheimer model shows that the best nanofluid was AL2O3. The best results had a significant effect on the solid volume fraction rate of nanoparticles in nanofluids obtained at low Reynolds and Prandtl numbers. Where the higher the fraction, the higher the heat transfer, the higher the resulted temperature.
Introduction
The increase in world population and therefore the daily life requirements, leads to high increase in the required burning of fossil fuels. Over 80% of worldwide energy production is based on fossil fuels, 1 resulting in a rise in atmospheric carbon oxides concentration. Which, in its role, leads to increase the climate change and global warming issues. Using energy from renewable sources is a perfect way to reduce the warming of the planet and the concerns of having carbon oxides in the atmosphere. Renewable energy is derived from unrestricted natural resources which can be replenished in a matter of seconds. 2
In solar thermal applications, a solar collector (SC) turns solar radiation into thermal energy, whereas in photovoltaic applications, it converts solar radiation into direct electrical energy. Solar systems catch incident solar radiation energy on their surface, convert it to heat, and transfer the heat to the operational fluid running through them in thermal applications. 3 The evacuated tube solar collector is a practical, cost-effective, and efficient technique to achieve this goal.
The employment of proper heat transfer improvement strategies is critical to optimizing energy devices, and nanofluid use is one of the relatively new options to this end. Because nanofluids have a higher thermal conductivity than the base fluids previously utilized, they can improve heat transfer rates in solar thermal collectors. Since Nanofluids are an innovative and promising way for increasing the heat transfer rate in solar thermal collectors, it is very important to investigate their impact on the performance of solar collectors and to see if they are feasible to be used in the future or not. 4
Heat transmission in porous media has gotten a lot of attention in recent decades since it has many applications in various industrial and technical fields. Thermal insulation, 5 packed bed heat exchangers, 6 catalytic reactors, 7 drying technologies, 8 electronic cooling, 9 and geothermal systems 10 are all examples of such fields. For example, using metal-based porous materials like copper foams in channels and heat exchangers, is considered an appealing strategy for improving the heat transfer rate in those application. In solar collectors, using porous metals like Al foam allow less energy consumption and impacts due to their high specific stiffness. Porous materials are made up of a solid matrix with pores (voids) that are usually filled with liquid. Porous materials are stiff, open-cell, and saturated, meaning that the pores are linked and entirely filled with fluid, allowing the fluid to flow through the voids.
Graphite has the significant advantage of not reacting with any organic material, as a result, it was thought to have chemically inert properties at ambient temperature. Graphite is utilized in devices that used for electrical and thermal transfer as well as in electrochemical super capacitors. Graphite is well-known for having high heat conductivity. As a result, it is considered as a good choice to be in the form of porous media. 11
In early 1901, Philippe Forchheimer, an Austrian scientist, discovered in his work “Wasserbewegungdurch Boden” that the relationship between fluid flow rate and the potential gradient is nonlinear at sufficiently high velocities. This nonlinearity increases with flow rate where when flow velocity increases, the inertial effects begin to dominate the flow. Forchheimer proposed that an inertial component representing the fluid’s kinetic energy be added to the Darcy equation to account for these high-velocity inertial effects. The contact surface area between the fluid and the solid surface can be increased by using porous media. Nanoparticles distributed in nanofluid improve the effective heat conductivity. As a result, it appears that combining porous medium with nanofluid can significantly improve the efficiency of typical thermal systems. 4 An experimental and numerical modeling of evacuated tube collector with phase change material integration was completed (PCM) by Pawar and Sobhansarbandi. 12 During the night time peak hours, the PCM system had a maximum temperature differential of 30°C which leads to proper reduction in the heat loss. On the other hand, the impact of several parameters on the thermal conductivity of nanofluids was studied by Yang et al. 13 Nanoparticle size, volume fraction, temperature, aspect ratio, base-fluid, Nano-inclusions, additives, and the pH number all had been shown with significant impact on nanofluid thermal conductivity. The hybrid nanofluid is a nanofluid made up of many nanoparticle materials, and it has been discovered that hybrid nanofluids have greater thermal conductivity than basic liquids. The numerical optimization and thermal performance of evacuated tube solar collectors with various nanofluids were studied using the FDM by Yurddaş. 14 TiO2, SiO2, MWCNT, and Cu nanoparticles were utilized in a water-based nanofluid. The best findings were obtained with the Cu-water nanofluid, with higher heat transfer at higher nanoparticle volume percentage. In another stud, Kaya et al. 15 used a 50% EG-PW based ZnO nanofluid to evaluate the thermal performance of an evacuated solar collector with U-tube shape (EUSC) using ZnO/Ethylene glycol-pure water (ZnO/EG-PW) as a working fluid at different volume concentrations and mass flow rates. The greatest collector efficiency was found to be 62.87% for 3.0% volume percent and 0.045 kg/s fluid mass flow rate. This value was 26.42% greater than EG-PW with base fluid alone. AlMasa’deh and Duwairi 16 analytically and numerically studied the fluid flow and heat transfer inside a porous conduit with heat flux. Through the completely formed and entry regions, the energy, momentum, and continuity equations were solved using a theoretical model with constant heat flux boundary conditions. The findings indicated that porous medium has a high potential for improving heat transfer rates. Hemmat Esfe et al. 17 examined the heat transfer of nanofluids in porous media in forced, natural, and mixed convection systems for various nanofluids and porous media. Using porous media has been shown to increase notably the overall performance and the heat transfer rate as the thermal conductivity of the working fluid was greatly improved by the implementing nanofluids. A Study by Alihosseini and Jafari 18 used a computational fluid dynamics model to investigate the influence of porous media configuration on nanofluid heat transfer. The working heat transfer fluid was Al2O3 water-based nanofluid, with aluminum foam as the porous medium. In terms of the enhancement parameter and the Nusselt number, several configurations were utilized and compared to one another. Among the other designs, the totally saturated porous cylinder produced the best results. Liu et al. 19 used the finite volume technique to study the copper water-based nanofluid laminar forced convection heat transfer between two horizontal concentric cylinders in the presence of a porous material. The influence of different factors such as Reynolds number, porous medium porosity, and nanoparticle volume fraction on heat transmission was investigated. The rise in the solid volume fraction of nanoparticles resulted in an increase in surface temperature, as well as an increase in the Nusselt number and heat transfer rate.
Based on the previous literature review, the use of nanofluids in solar thermal applications was found to be promising and need more attention by the researchers. In this study, the authors investigate the effect of using nanofluids, basically Al2O3, TiO2, CuO, and SiO2, in combination with Graphite as porous media on the performance of evacuated tubes solar collector performance. Up to the authors knowledge, this kind of combination is not introduced in the literature, especially in solar collector’s area. Also, the study presents a comprehensive comparison between using different kinds of nanofluids under different conditions which allow higher range of evaluation for the system.
Mathematical modeling
The Forchheimer model is used in this work to solve the forced convection problem within a saturated porous media with a constant surface heat flow. To show the difference between utilizing water and nanofluid in energy storage, a theoretical model for nanofluid flow in a saturated porous media was built and solved analytically, including the influence of certain variables (porosity, pressure, etc.) on temperature variation. The study focused on energy storage in Amman city in the months of August and January. The nanofluid volume fraction must be defined in order to comprehend the thermo-physical properties of nanofluids. As demonstrated in equation (1), the nanofluid volume fraction (∅) is the constituent volume divided by all constituent volumes of the mixture before mixing. 20

To determine the thermal characteristics of the nanofluid, a weighted average approach using the volume concentration between the nanoparticles and the base fluid is used. A basic mass balance is used to calculate the density value, as indicated in equation (2).

Since using simple weighted average like this in equation (3) will not produce an accurate result for specific heat, it is preferable to employ an analytical model as in equation (4), which assumes thermal equilibrium between nanoparticles and the base fluid.
21
In this study, the Corcione equation will be utilized to simulate dynamic viscosity, where


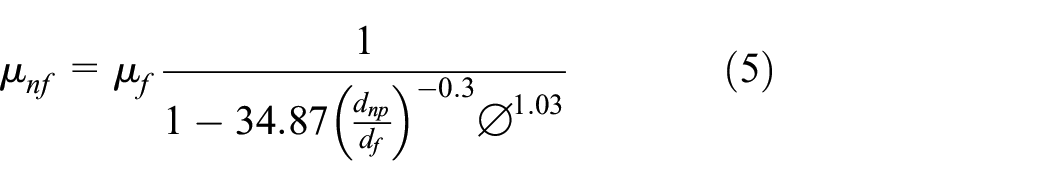

In equation (6), M is the molecular weight of the base fluid, N is the Avogadro number, and
The nanofluids used in the current study are AL2O3, TiO2, CuO, and SiO2. These nanofluids will be studied from the perspective of their characteristics and their effect on the heat transfer within the system. The thermo-physical properties of the mentioned nanofluids in addition to water are given in Table 1. 22
Thermo-physical properties of the water and nanoparticles.

Graphite had been used as the porous medium in the current study. Graphite has the significant advantage of not reacting with any organic material. As a result, it was thought to have chemically inert properties at ambient temperature. Graphite is well-known for having high heat conductivity making it able to be a good porous medium especially with its high thermal conductivity that increase the heat transfer rate. 23 Graphite properties which were used in this study are shown in Table 2. 24
Graphite properties.

The porous media’s permeability is a geometrical property. It’s significant since it has a direct impact on the working fluids’ directional movement and flow rate. The Carman–Kozeny hypothesis can be used to define permeability in particle beds and fibers as shown. 25

Where,

As the flow velocity increases, the inertial effects begin to dominate the fluid flow. To consider this factor, Forchheimer proposed that an inertial component representing the fluid’s kinetic energy must be added to the Darcy equation to account for these high-velocity inertial effects. So, the Forchheimer’s law became as in equation (9). On the other hand, the Einstein’s formula for dilute suspensions is presented in equation (10) 26 :


For nanofluids, the Reynold number may be computed using either the pores diameter or the permeability. Because permeability and inertial resistance are dependent on pore size, researchers discovered that estimating Reynolds number based on pore diameter is more accurate. 20 Reynolds number based on pores diameter and permeability can be found using equations (11) and (12) respectively.


The previous suggested model investigates how nanofluid in saturated porous media might improve the performance of an evacuated tube solar collector. The tube is assumed to be evacuated to limit convective and conductive heat losses to the environment. In a two-dimensional system, the governing equations were written and solved (r, z). To simulate the fluid flow inside the porous media, the Darcy-Brinkman–Forchheimer model was utilized to determine the effect of different system on the temperature gradient and the velocity at the tube wall. The governing system equations are the momentum, energy, and mass conservation equations. The proposed model was assumed as a two-dimensional forced convection incompressible nanofluid flow in a circular tube saturated with porous media, as illustrated in Figure 1. The following assumptions were used in order to construct the mathematical model for this mathematical model 20 :
The nanofluid flow is a two-dimensional forced fluid flow that is steady, incompressible, and laminar.
The fluid’s temperature is always below the boiling point.
The fluid and solid matrix are in thermodynamic equilibrium always.
Fluid physical properties are homogeneous and isotropic.

Physical model.
The pipeline and the flow are assumed to be axisymmetric with no change in Θ direction. This is due to similar boundary condition (slip condition in the momentum equation and constant surface heat flux around all the vacuum tube). This will simplify the problem to obtain an exact solution in the fully developed region. Also, it a usual assumption to neglect any changes in Θ direction for both momentum and energy because of the constraint boundaries around the flow and because of the nature of axis of rotation in this problem. The dimensional governing equations that describe the convection flow can be written as follows:
The continuity equation (the conservation of mass) represented in equation (13) where u and v represent the axial and radial velocities components respectively.

The z-momentum equation (conservation of momentum) represented in equation (14):

The r-momentum equation (conservation of momentum) represented in equation (15):

The energy equation (conservation of energy) represented in equation (16):

Where K, p, μ, T,

Where,
The boundary conditions were applied in solving the model equation include that the velocity in the r-direction is neglected (


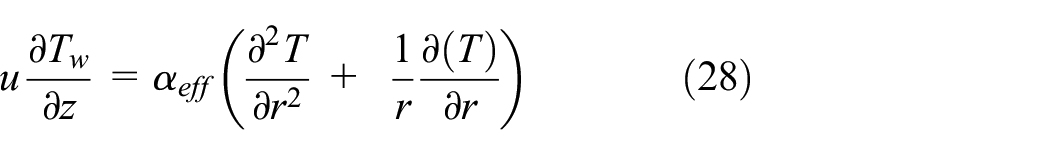
The Forchheimer model is used to investigate the velocity profile, temperature profile, and Nusselt number for constant heat flow at the entry and fully developed regions. Because the velocity field is fully developed, the velocity component in the radial direction v is zero. In comparison to that in the radial direction, heat diffusion in the axial direction will be ignored, that is (∂2T/∂z2 = 0). As a result, the energy equation (equation (16)) can be simplified to:

The governing equations, such as the continuity equation, can be assumed for the constant surface heat flux across fully developed region. The velocity gradient at the fully developed region was assumed to be zero (∂u/∂z = 0) since the mass flow rate is constant in the pipe. The continuity equation (equation (13)) is simplified to equation (20). As a result, the term (v) is a constant represented by C, considering a value of zero for the radial velocity at the wall, the constant C also goes to zero, that is C = 0.

As previously stated, the radial velocity can be ignored and assumed to be zero (


Because it is meaningless, the negative solution of (u) was neglected and therefore, the dimensionless term


The fully developed region shown in Figure 2, the dimensionless temperature remains constant in this region. The term (∂T/∂z) can be replaced using the temperature profile.

Temperature profile in fully developed region inside the conduit.
The temperature profile in the fully developed region can be found by the equation (25) 27 :

Equation (25) was differentiated with respect to z and the following equation (26) is resulted. Because


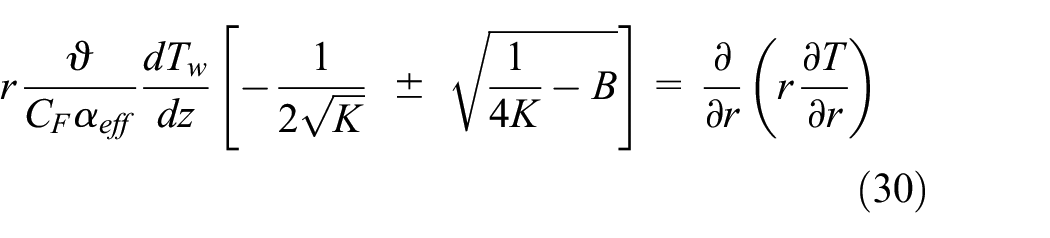

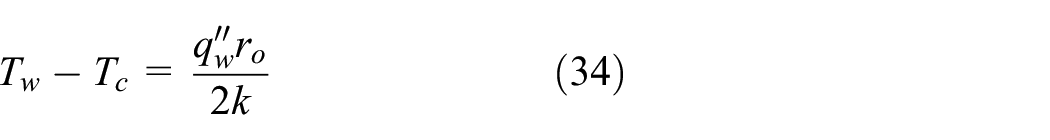
Now, the differentiation of equation (31) with respect r will give equation (32) and when equation (32) is substituted into the conduction heat transfer equation the result is as equation (33). The center line temperature


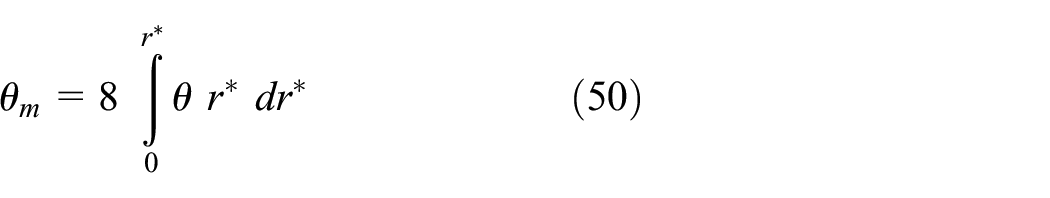
When determining the Nusselt number in the fully developed flow, it is typically more convenient to use the mean fluid temperature,

Substitute equation (31) into equation (35) to get equation (36):

It should be noted that the Nusselt number is the same as:


Note that you can get

The Nusselt number may be determined by substituting the equation (39) into the equation (38). For a heat flux concentrated on a one-half of the tube, the Nusselt number will be the half.
Solutions validation
Figure 3 shows the velocity profile changes before reaching the fully developed state. The porous media maintain the same velocity profile along the along the solar collector tube (z-axis). This means that there is just a thermal entry area. The energy equation is expressed in dimensionless form in the entry region and solved numerically in the situation of constant surface heat flow. The mean Nusselt number at the entrance region can be represented as an exponential distribution. The Nusselt number begins with a high value and then gradually decreases as the flow reaches the fully developed region.

Developing and fully developed region in a conduit.
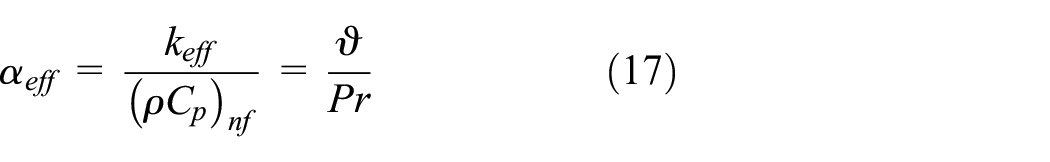
Equation (40) represents the dimensionless variables used to solve the problem when constant heat flux is assumed. Where


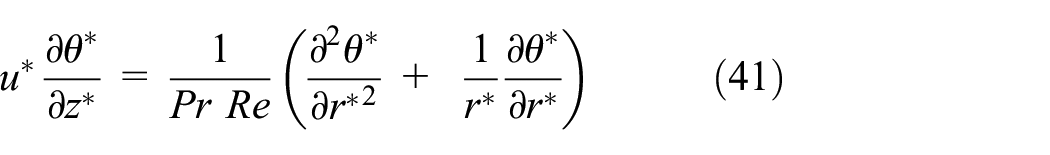
By substituting dimensionless variables in equation (19), the energy equation will be as in equation (41). Where (Re = umD/ϑ) is the Reynolds number, (Pr = ϑ/


The right term in equation (45) represents


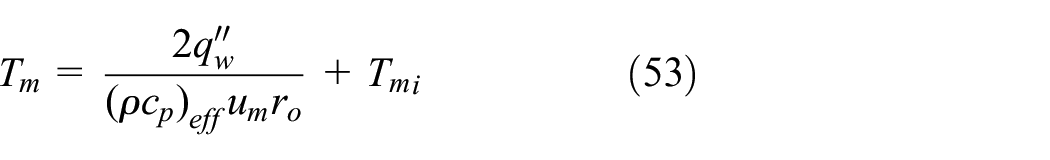
The temperature varies in the z-direction along the pipe. The energy balance equation, as shown in Figure 4, is applied to find the mean temperature variation in the axial direction as in equation (52), where,


Conduit`s energy and mass balance.
Irradiance data for Amman.

The material’s sensible heat storage is determined by its heat capacity, energy density, thermal diffusivity, or the rate at which heat is taken and released. Where

A mesh independence study for the used finite difference technique is investigated by applying different grid size. As shown in Figure 5, the Mean Nusselt number does not change for grid size more than 20,000 cells which refers to the small round off errors. Therefore, the grid size of 20,000 cells is used in this study.
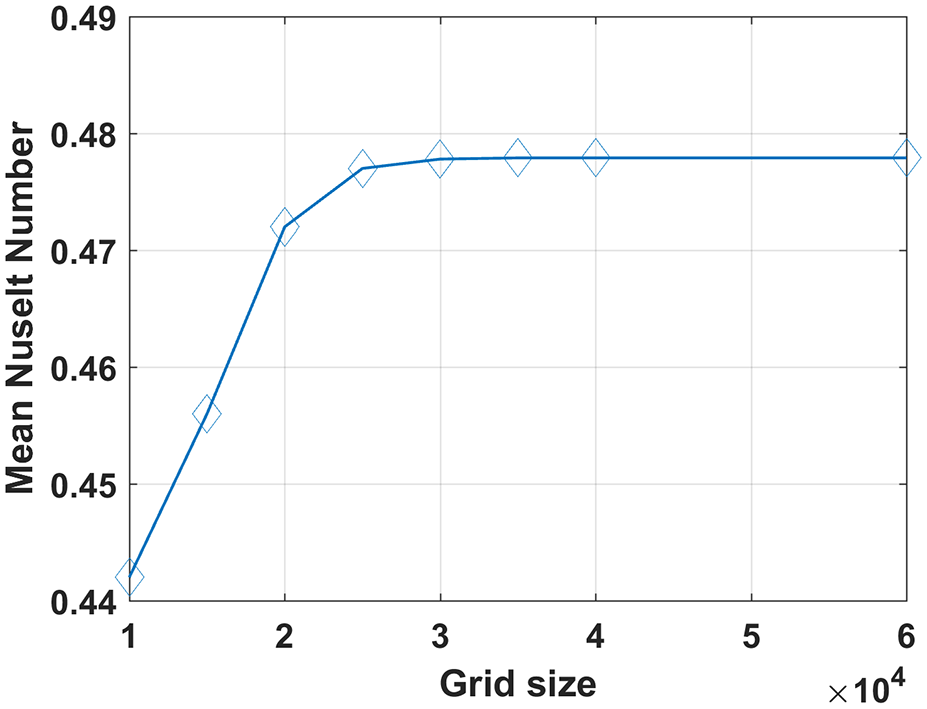
The calculated mean Nusselt number for different grid size for the case of Al2O3-water nanofluid.
Results and discussions
Unfortunately, the lack of experimental studies that are similar to the combination of porous and nanofluid used in the current paper, did not allow an exact validation of the obtained results. Instead of that, the model was validated against other numerical results published by Abelman et al. 28 The used parameters in 28 including the inlet temperatures, the flow rates, pressure, and volume fraction had been implemented in the current model. Two cases had been included in the comparison, one for the Cu-water nanofluid and the other for Al2O3 nanofluid. The calculated Nusselt numbers for the two cases were compared with numerical results of in Abelman et al. 28 As shown in Figure 6, obviously, the difference between simulated results and the numerical results is very small and this indicate that the current model is validated and can be used for modeling the solar tube problem. On the other hand, the numerical solution of the flow at entrance region is matched with the exact analytical solution of the fully developed region for all of the applied step size.

Comparison between Numerical results of 28 and current study for two types of nanofluids in terms of Nu number.
Figures 7 and 8 show the results of the solution of the previous system of equations. As can be seen in the figures, the Nusselt number has a fast decreasing profile, it begins with a high value and then rapidly drops until it reaches a constant value. This value remains constant throughout the fully developed region. In the fully developed region, the friction factor, heat transfer coefficient, and therefore the mean Nusselt number remain constant regardless of the nanofluid velocity or Prandtl number.

Mean Nusselt number at different velocity values for Al2O3.

Mean Nusselt number at different Prandtl number values for Al2O3.
Figures 9 and 10 show the dimensionless temperature

Dimensionless temperature at different velocities for both water and Al2O3.

Dimensionless temperature at different Prandtl number for both water and Al2O3.
Figures 11 and 12 show the local Nusselt number at various nanofluid velocities, as well as Prandtl numbers. The difference between the outer surface and the entry temperatures was used to calculate the local Nusselt number. The temperature differential between the outer surface temperature and the entry temperature along the tube caused the local Nusselt number profile to drop sharply until it reached zero. The longer the entrance region length is, the greater the nanofluid velocities and Prandtl numbers are, which is undesirable. As the Prandtl number and nanofluid velocity drop, the entrance length decreases, allowing the fully developed region to be reached faster. As a result, it is advised that the nanofluid velocity and Prandtl values be kept as low as possible for optimal performance.

Local Nusselt number at different velocity values for Al2O3.

Local Nusselt number at different Prandtl number values for Al2O3.
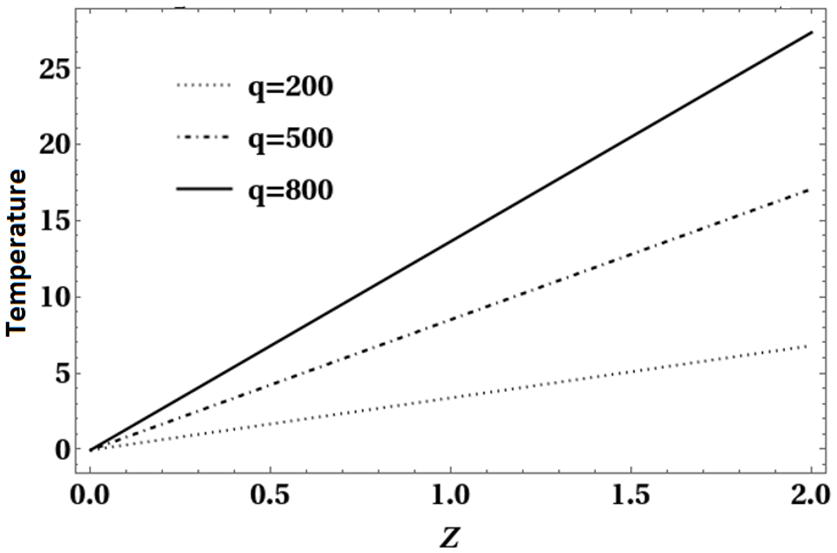
Figures 13 to 16 represent the temperature difference for different nanofluids types (AL2O3, TiO2, CuO, and SiO2) at different heat flux values. Considering that the same volume fraction was used for all nanofluids, the results depend on the thermo-physical properties of each nanofluid solely. As can be seen from the figures, AL2O3-water is the best nanofluid between the studied nanofluids and this is applied for all heat flux values.

Temperature difference at volume fraction (1.5%) and different heat flux for Al2O3.

Temperature difference at volume fraction (1.5%) and different heat flux for TiO2.

Temperature difference at volume fraction (1.5%) and different heat flux for CuO.
Temperature difference at volume fraction (1.5%) and different heat flux for SiO2.
Figures 17 to 20 show a comparison of nanofluid and pure water at different solid volume percentages. The figures also illustrate the mean temperature fluctuation at various heat fluxes. At the same heat flux, the performance of the nanofluid is superior to that of water. The solid volume fraction of nanoparticles in the nanofluid is shown to have a substantial impact on the temperature where increasing the volume fraction leads to a notable increase in the temperature difference at all heat flux values.

Temperature difference at volume fraction (1.5%) and different heat flux for Al2O3 compared with water.

Temperature difference at volume fraction (3%) and different heat flux for Al2O3 compared with water.

Temperature difference at volume fraction (4.5%) and different heat flux for Al2O3 compared with water.

Temperature difference at volume fraction (6%) and different heat flux for Al2O3 compared with water.
Figures 21 to 24 illustrate the impact of pressure, pore diameter, porosity, and tube diameter on temperature fluctuation along the solar collector tube at a constant heat flux (500 W/m2). The temperature of the nanofluid is shown in Figure 21 as a function of pressure at various pressures. The temperature drops as the pressure rises. This can be explained by the rise in the nanofluid velocity at high pressure values. The effect of porosity on temperature fluctuation is seen in Figure 22. Porosity has a strong inverse relationship with temperature, with a modest increase in porosity resulting in a substantial reduction in temperature fluctuation.
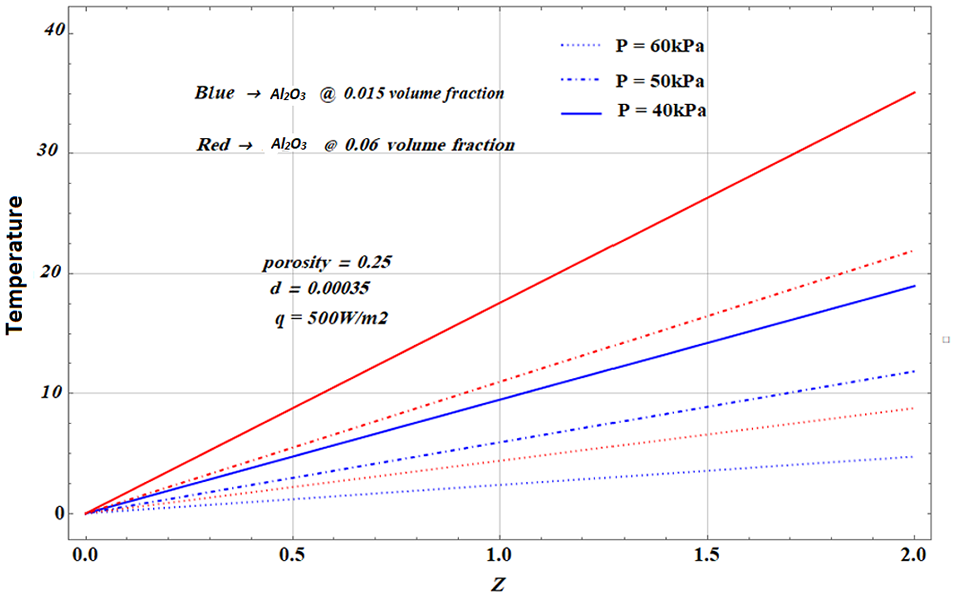
Temperature difference at different volume fraction and medium pressure for Al2O3 at q = 500 W/m2.

Temperature difference at different porosity and volume fraction for Al2O3 at q = 500 W/m2.
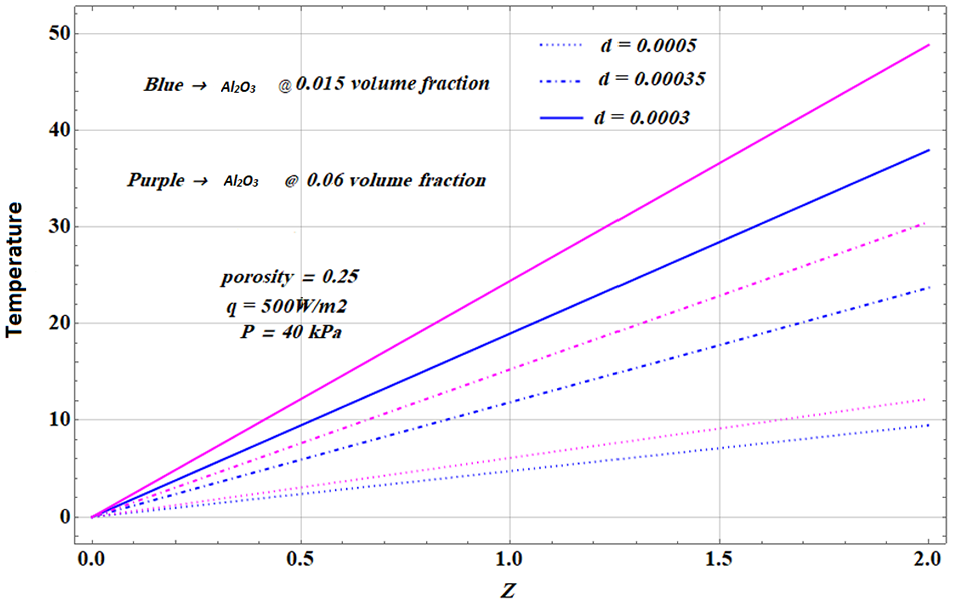
Temperature difference at different particles diameter and volume fraction for Al2O3 at q =500W/m2.

Temperature difference at different tube radius and volume fraction for Al2O3 at q = 500 W/m2.
The influence of solid particle sizes on the temperature is shown in Figure 23. Similar to porosity, particles diameter has a substantial inverse relationship with the temperature, with a small increase in particle diameter a large reduction in the temperature will be observed. The previous calculations utilized a tube radius of 3 cm; the impact of the tube radius is shown in Figure 24, and as the tube radius increased, the temperature difference will be decreased.
Figures 25 and 26 show the temperature difference in the solar collector tube in Amman City at different solar irradiances (heat fluxes). Irradiance data was obtained from the “Photovoltaic Geographical Information System” (PVGIS), and temperature variation was computed using that information. Applying the Al2O3-water nanofluid helps achieving higher temperature gradients in both of summer and winter seasons. Obviously, temperatures were at their highest during the summer months of July and August where the lowest temperatures were recorded in December and January. As a result, the irradiance will be highest in the summer and lowest in the winter. Because of the variation in solar noon across the months, the daily peak for the curve varies from month to month. Based on that, it is beneficial to use nanofluid in evacuated tube solar collector during the winter season as it enhances the collector performance by increasing the temperature difference along the tube. On the other hand, Figures 27 and 28 illustrate storage capacity in the winter (January) and summer (August) under the conditions and parameters stated. To get the desired temperature, the conditions and parameters can be altered. It’s important to note that increasing the solid volume percentage of nanoparticles raises the temperature that can be reached.

Daily temperature variation T (°C) for different months in Amman (Al2O3 with 6% solid volume fraction).
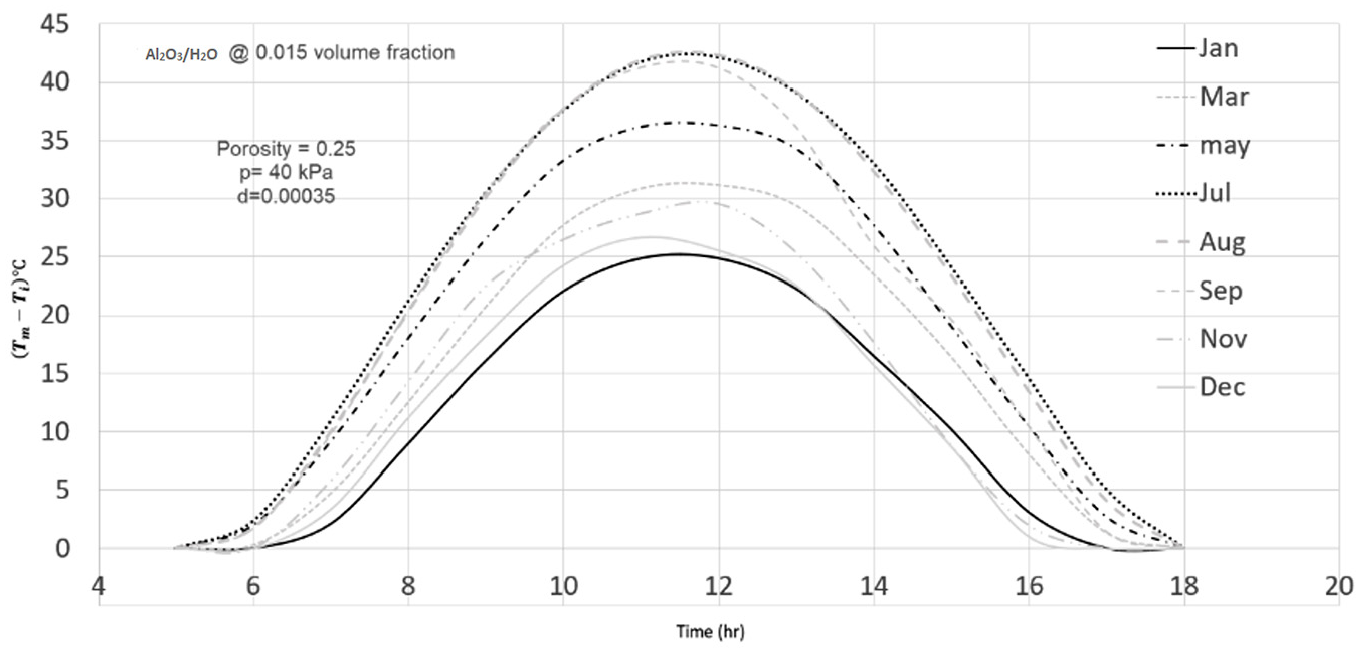
Daily temperature variation T (°C) for different months in Amman (Al2O3 with 1.5% solid volume fraction).

Temperature variation T (°C) in Amman during January for Al2O3.

Temperature variation T (°C) in Amman during August for Al2O3.
Conclusions
A numerical investigation of using nanofluid implanted in a saturated porous medium to enhance the performance of the evacuated tube solar collector is presented. The results of the study had been obtained by solving the governing equations in the entrance and the fully developed regions. The numerical approach had been applied in entrance region using the FDM technique while solution for the fully developed region had been performed using the analytical way. The impact of several factors such as heat flux, porous medium porosity, solid particle diameter, nanoparticle volume fraction in the nanofluid, pressure, and tube diameter was explored and studied. The findings of the study can be concluded as follow:
Porous material improves the energy storage since it has high thermal conductivity and this enhance the solar collector performance.
In the presence of porous medium, nanofluid performed better than pure water.
The Nusselt number begins with a maximum high value at the entrance region, and then quickly drops to achieve a constant value along the fully developed region.
The pressure, porosity, tube radius, and solid particle diameter of porous media were found to have an inverse relationship with temperature variation along the tube.
Increasing the heat flux and using nanoparticles improves the collector performance and raises temperature and stored energy.
The results show that increasing the solid volume fraction of nanoparticles in the nanofluid improves the system’s performance.
The best results were achieved at low flow velocities and Prandtl numbers.
Using Amman, Jordan as an example, the results for a natural heat flux were demonstrated; it is clear that the required temperature variation can be achieved by altering conditions and parameters such as pressure, nanoparticles solid volume fraction in the nanofluid, porous media porosity, solid particle diameter in the porous media, and tube radius.
Footnotes
Appendix
Handling Editor: Chenhui Liang
Declaration of conflicting interests
The author(s) declared no potential conflicts of interest with respect to the research, authorship, and/or publication of this article.
Funding
The author(s) received no financial support for the research, authorship, and/or publication of this article.