
Abstract
In this study, the effect of DBD plasma actuator based active flow control for a truck model was investigated. Two different electrode shapes which are linear and comb-shaped plasma actuators, are considered. The two DBD plasma actuators are placed at the leading edge or the trailing edge of the trailer, respectively. First, the drag reduction for the DBD plasma actuators at input voltages varying from 6 to 14 kVpp are compared. At a Reynolds number of 25,000, the maximum drag reduction using three comb-shaped plasma actuators at the trailing edge of the trailer is 8.7%, while the maximum drag reduction of three linear plasma actuators is approximately 6%. Then flow visualization behind the truck is performed. At a Reynolds number of 3500 and an input voltage of 14 kVpp, the results show that three comb-shaped plasma actuators installed at the trailing edge of the trailer produce a significant reduction in the wake region. In addition, the PIV measurement is used to quantize the flow field. It is observed that comb-shaped plasma actuators change the slope of the wake region more significantly than using linear plasma actuators. Therefore, this study shows that the use of DBD plasma actuators qualitatively and quantitatively reduces aerodynamic drag.
Introduction
Transport costs increase when drag increases due to extra fuel consumption. In recent years, many studies1,2 have demonstrated how to manipulate the flow around an object to reduce the drag coefficient. DBD plasma actuator based active flow control can be used to reduce or eliminate unsteady flow. However, a large number of studies3,4 have only focused on air vehicles. In this study, we present a truck model with different shaped electrode DBD plasma actuators to reduce aerodynamic drag. Julian et al. 5 analyzed the drag coefficient reduction of plasma actuators on the Ahmed body. They installed the plasma actuator on the leading edge, trailing edge, and both the leading and trailing edges on the Ahmed body. At the low wind speed, the drag reduction was up to 22% while the plasma actuator was placed on the leading edge. Khalighi et al. 6 investigated the Ahmed model with eight different rear-end pieces corresponding to freestream velocities of 10, 15, 20 m/s using single dielectric barrier discharge (SDBD) plasma actuators. A drag reduction of 20% was measured at a freestream velocity of 15 m/s with the plasma actuator turned on. At the highest velocity of 20 m/s, the measured drag was reduced by approximately 2.9% compared to the baseline. Shadmani et al. 7 studied the Ahmed model at two different freestream velocities of 10–20 m/s using steady and unsteady plasma excitations. The drag reduction in steady and unsteady plasma excitations were 7.3%–4.88%, respectively. At the velocity of 20 m/s, the results showed that the drag reduction reached 2.13%–1.5%, respectively. Kim et al. 8 analyzed the Ahmed body with a wire-to-plate DBD plasma actuator for drag reduction at the freestream velocities of 10–20 m/s. With plasma actuation, the drag is reduced by the amount of maximum 10% at the freestream velocity of 10 m/s. However, the shapes between the Ahmed body and the truck model are quite different. In order to more accurately predict the effect of the plasma actuator, a real truck model is required. Harinaldi et al. 9 investigated the drag reduction of a cylindrical model with the plasma actuator. The actuation was set at the angles of 55°, 90°, and 125° of the stagnation point to predict the location of the separation point. There was a clear effect occurs in altering the flow by placing the plasma actuator on 90° at the surface. It could reduce drag up to 20%. Harinaldi found the best position of the plasma actuator placed on the point that the flow separation begins. In our study, the separation occurred on the trailer of the truck. Therefore, we can place plasma actuators on the leading or trailing edge of the trailer, respectively. Also, we consider different shapes of plasma actuators for the effect of drag reduction. Riherd and Roy 10 discussed the serpentine electrode of plasma actuators for flow control. The serpentine actuator can accelerate or delay the transition of laminar flow to turbulent flow and produce streamwise oriented vorticity. In the low Reynolds number, this actuator can be against separation in effect. In our study, the design of the comb-shaped plasma actuator is referred to as the serpentine actuator. Roy et al. 11 analyzed different actuators for flow control on both experiment and simulation. The linear actuator generates a jet pattern that expands to the backward, and the comb-shaped actuator allows pinching and spreading of the neighboring fluid rapidly inducing three-dimensional vortices. We can see that the comb-shaped actuator has a stronger influence in the wake region of the truck. Wicks et al. 12 used plasma to flow control, in order to decrease the noise. Their study showed that the plasma actuator could minimize unsteady flow separation and reduce noise effectively. Tsai 13 demonstrated the corner nozzle flow to reduce drag. When the flow hits the vehicle, it stops and changes the direction of the flow. The high-pressure region will occur in front of the vehicle. When the flow leaves the vehicle, the vortex shedding will be generated behind the vehicle. The low-pressure region behind the vehicle produces more drag. When the flow field is directed inward through the nozzle, the inward flow can reduce the vortex shedding behind the truck and decrease the low-pressure region to reduce drag. This concept is similar to a plasma actuator to control flow. Seifert et al. 14 presented active flow control could delay the boundary layer separation effectively which alters the flow behavior using energy injection. The separated flow could be redirected to the back of the truck to increase the back pressure and reduce drag. The technical report 15 discussed the technologies used on heavy vehicles to reduce drag, and thereby reduce greenhouse gas emissions. For example, side skirts are installed to prevent air from entering the region under the trailer. Sutopo 16 showed that there are three areas that contribute to the drag reduction, such as the truck-trailer gap, the back of the truck, and the bottom of the truck. The drag reduction device should be installed in a location with the best efficiency. The purpose of this study is to discuss the effect of the comb-shaped DBD plasma actuator based active flow control on the truck model by varying the applied voltage and comparing its performance with the linear plasma actuator for drag reduction. First, we placed three linear or three comb-shaped DBD actuators on the truck model and used a load cell to measure the changes in the drag on the truck model. Power consumption and plasma induced thrust of the DBD plasma actuators were also measured. Then, we used flow visualization to observe the flow field behind the truck model with and without the DBD plasma actuators. Finally, the PIV technique was used to quantify the flow velocity field behind the truck model to understand the mechanism responsible for the drag reduction.
Problem description
The dimensions of the truck model are 75 mm×23 mm×37 mm, as shown in Figure 1. The DBD plasma actuators were placed at the leading and trailing edges of the trailer. A load cell was connected to the bottom of the truck model to measure drag forces, as shown in Figure 2. The truck model was placed in the test section of a wind tunnel. Flow visualization and the PIV experiment were conducted to quantify the flow field behind the truck model to observe the effect of the DBD plasma actuators on drag reduction.
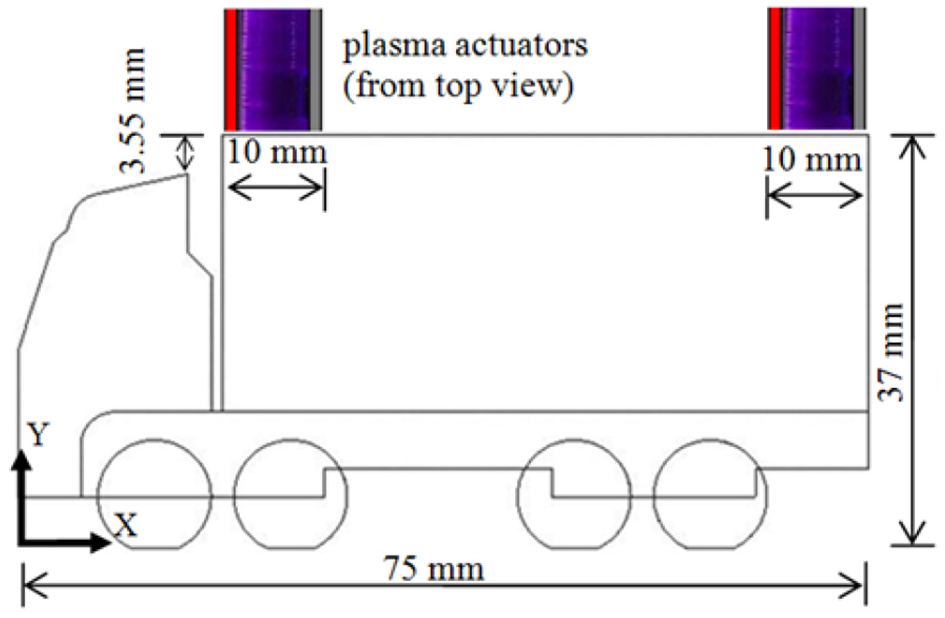
Schematic of the truck model with the DBD plasma actuators at the leading and trailing edges.
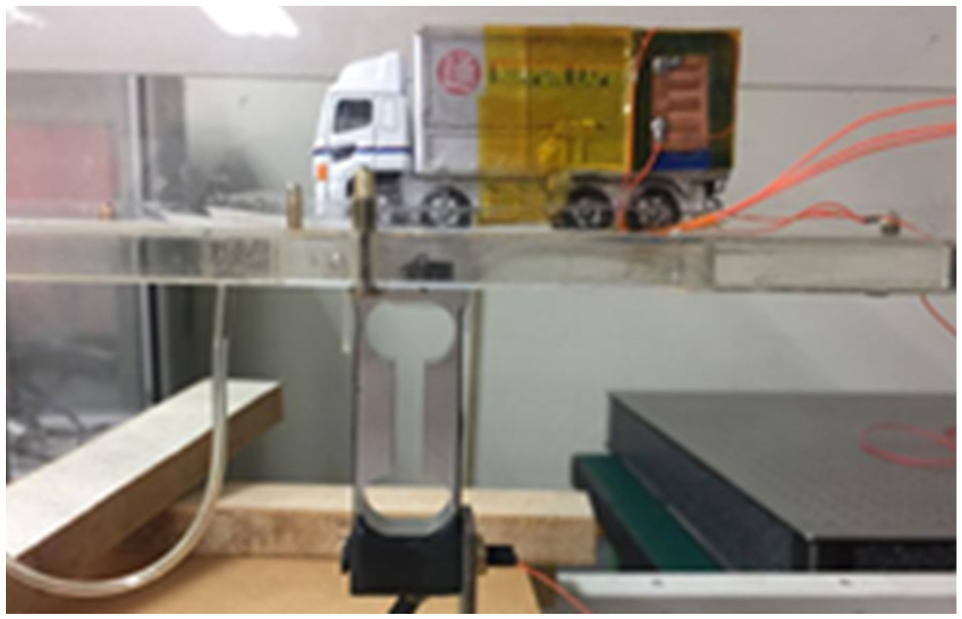
Image of the truck model with the load cell.
Experimental setup and process
The test section of a wind tunnel is 1000 mm long with cross-sectional area of 82 × 82 mm2. An axial blower generates the wind speed from 0.2 to 8 m/s. The wind speed is measured by the hot wire anemometer. The principle of hot wire anemometer is a heating wire and dissipates heat through the flowing air. The hot wire anemometer we used is Lutron AM-4204. It is available for low velocity measurement from 0.2 to 20 m/s and the resolution is 0.1 m/s. We collect drag forces from the load cell, which is made by Vishay Celtron company called 0.6 Low-Profile Single Point. The load cell measures the deformation of structural members and converts them into electronic signals. The load cell can measure maximum weight of 600 g and the error is less than 0.3 g. Before the measurement begins, the load cell must be calibrated by the weight. For drag measurements, the wind tunnel was started at different velocities of 5, 7, 8 m/s. The drag was acquired via the use of a load cell installed under a truck model. The output from the load cell was sampled for at least 60 s at a rate of 5 Hz to obtain a mean drag. All the measurements were done with at least five independent runs. The drag coefficient (Cd) is defined as:

where Fd is the time-averaged drag, ρ is the air density, U∞ is the freestream velocity, and Af is the frontal area of a truck model.
The DBD plasma actuator is composed of two thin copper electrodes. The electrodes were separated by a dielectric, which prevents the generation of sparks. The top electrode was connected to the high voltage and the bottom electrode was connected to the ground that leads the airflow induced by the plasma. Two different shaped electrode DBD plasma actuators were tested in our experiment, as shown in Figure 3. The dielectric layer was a 1-mm-thick rectangular acrylic plate with dimensions 18 mm ×23.5 mm. The top and bottom electrodes of the linear actuator had dimensions of 5 mm ×15 mm, as shown in Figure 3(a). The dimensions of the comb-shaped actuator are shown in Figure 3(b). Figure 4 shows a schematic of the DBD plasma actuator for power and thrust measurements. A Tektronix AFG-2000 function generator input the voltage signal to a Trek 20-20C high-voltage amplifier and then sent it to the plasma actuator. The power of the circuit was measured using a Tektronix P6015A high voltage probe and a Pearson Electronics Model 2100 current monitor, which sent the data to the oscilloscope. The data were gathered through a double channel GDS-1000 oscilloscope, and exported to a computer for further processing. The maximum output voltage of the amplifier was 20 kV. The output voltages were set from 6 to 14 kVpp with a sine wave at frequency of 3 kHz. The oscilloscope collected 4000 pairs of data at each timestep. The data were substituted into the instantaneous power equation P(t) = V(t) × I(t). Once the power function of time was obtained, a mean value was solved by:


Schematics of (a) linear and (b) comb-shaped DBD plasma actuators.

Schematics of experimental setup for (a) power and (b) thrust measurements.
where n is the total number of 4000 data collected and t0 is the timestep of 4 × 10⁻⁷ s.
The diffusion of particles through the laser light sheet allowed the flow field to be observed in flow visualization tests. The particle size of the smoke was 0.1 mm. The laser used was a Dantec RayPower 2000 with a maximum output power of 2.53 W. The camera used was a Nikon D7100 with AF-S Micro NIKKOR. The range of the shutter was from 0.05 to 0.5 s and the range of aperture was from f/5 to f/10. Images were taken and the locations of vortices were marked with white circles. Each white circle was superimposed into one image so that the vortex shedding and the recirculation region at different configurations of DBD plasma actuator and input voltage could be observed.
PIV is a non-intrusive, whole-field optical technology used to get velocity information about the flow field. The process is similar to flow visualization. The principle of PIV is to keep the tracking particles in the flow field. A CCD camera captures two frames in a very short time, and the system tracks the particle displacement between the two frames. The flow field is analyzed through the Dantec DynamicStudio software using an adaptive PIV method. The CCD used in the PIV experiment is a Dantec FlowSense EO camera. The resolution of the camera was 648 ×488 pixels, time between pluses was 3000 μs, trigger rate was 100 Hz, and exposure time was 2000 μs. The centerline x–y plane at z = 0 was considered for the measurement. An iterative adaptive correlation method was employed with an initial interrogation area size of 32 × 32 pixel 2 to obtain the final interrogation area size of 16 × 16 pixel 2 with 25% overlaps. The adaptive PIV method calculates velocity vectors from the two frames. The method adjusts the size of the individual interrogation areas iteratively. The vectors can then be calculated from the displacement of the particles and the time between frames of each interrogation area in the two frames. To obtain a fully converged mean velocity field, 2000 instantaneous fields were taken and averaged.
Results and discussion
In this study, two different types of actuators, namely linear and comb-shaped, were considered. DBD plasma actuators were installed on the top, left, and right leading or trailing edges of the trailer. Figure 5 shows the power consumption per unit length for the linear actuator and the comb-shaped actuator. Under the input voltage of 14 kVpp, it can be observed that the cost of the linear actuator is 75 W/m, which is lower than that of the comb-shaped actuator at 102 W/m. To understand the relationship between the electrode length and power consumption, Figure 6(a) shows the comparison of power consumption versus input voltage for different electrode lengths (i.e. 15, 30, 45, 60, 75 mm). Clearly, the longer the electrode length, the smaller the power consumption per unit length. Figure 6(b) shows the plasma-induced thrust versus input voltage for different electrode lengths. Under the same input voltage of 14 kVpp, the linear actuator with an electrode length of 15 mm creates the largest thrust per unit length. Figure 7 shows plasma discharge images of the linear actuators with different electrode lengths and the comb-shaped actuator. These images indicate that a linear actuator with shorter electrode lengths has longer streamers, which is the reason that a linear actuator with an electrode length of 15 mm consumes more power and produces more thrust per unit length. The power consumption is proportional to the thrust induced by the linear actuators. For the comb-shaped actuator, compared with the linear actuator, the streamer discharge near the sharp corners is much stronger, which is the reason the comb-shaped actuator consumes more power than the linear actuator.

Power per unit length of the linear and comb-shaped actuators.

(a) Power and (b) thrust measurements of the linear actuator for different electrode lengths.
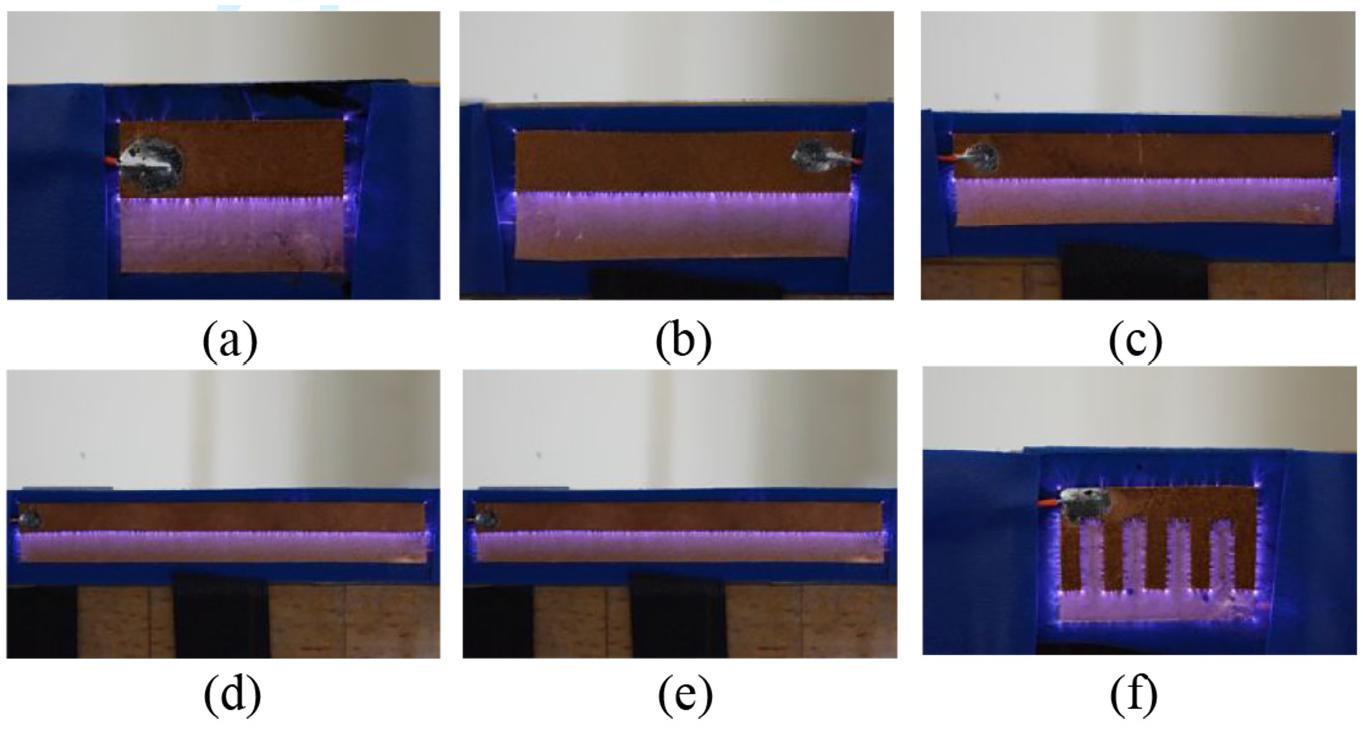
Plasma discharges with an input voltage of 14 kVpp for linear actuators with electrode length of (a) 15 mm, (b) 30 mm, (c) 45 mm, (d) 60 mm, (e) 75 mm, and (f) the comb-shaped actuator.
CFD analysis
The computational fluid dynamics (CFD) tool was employed to investigate the mechanisms of aerodynamic drag reduction for a truck model using plasma actuators. The effects of plasma actuation were modeled using the reduced-order model to approximate body force distribution. 17 For flow modeling, the k–ω SST turbulence model has been chosen to solve Reynolds-averaged Navier-Stokes (RANS) equations for turbulent flows to analyze the flow field behind a truck model. Figure 8(a) and (b) show a qualitative comparison of u-velocity contours with and without plasma at freestream velocity of 30 m/s. The linear plasma actuator was placed on the top leading and trailing edges of the trailer. The wake of a truck model can be divided into upper and lower bubbles corresponding to the high drag region. When the linear plasma actuator was on, the streamline curvatures from the top leading and trailing edges were slightly bent. Figure 8(c) shows a quantitative comparison of drag coefficients with and without plasma. The change in the drag coefficients due to the plasma on was 0.3%. The results showed that at higher velocities (>30 m/s), larger body forces are required for effective flow control.

Qualitative and quantitative comparisons of (a) u-velocity contour without plasma, (b) u-velocity contour with plasma, and (c) drag coefficients with and without plasma.
Drag measurement
A truck model connecting the load cell was placed into a wind tunnel to measure drag forces. Depending on the test conditions, the Reynolds number ranged from 25,000 to 40,000. Linear or comb-shaped actuators were installed on the top and both sides at the leading edge or the trailing edge of the truck model for testing. When the input voltage of the plasma actuators was changed from 6 to 14 kVpp, the drag forces were collected with a load cell. Under the Reynolds number of 25,000 and an input voltage of 14 kVpp, as shown in Figure 9(a), the three linear actuators at the leading edge (i.e. 3L-DBD-F) or trailing edge (i.e. 3L-DBD-B) show a drag reduction of 6.3%–6.7%, while the three comb-shaped actuators on the trailing edge (i.e. 3C-DBD-B) show a maximum drag reduction of 8.7%. When the top actuator was operating alone (i.e. 1C-DBD-B), it resulted in a mean drag reduction of approximately 3%. When the Reynolds number was increased to 35,000 as shown in Figure 9(b), the maximum drag reduction of the comb-shaped actuators on the trailing edge (i.e. 3C-DBD-B) was reduced by approximately 4.5%. It was found that when the wind speed increases, the drag reduction decreases due to the limited ability to increase the actuator’s voltage. When the Reynolds number was increased to 40,000, the drag reduction in all cases was reduced to almost zero. At high speeds, the DBD actuators need to generate more thrust to control the flow field behind the truck model.
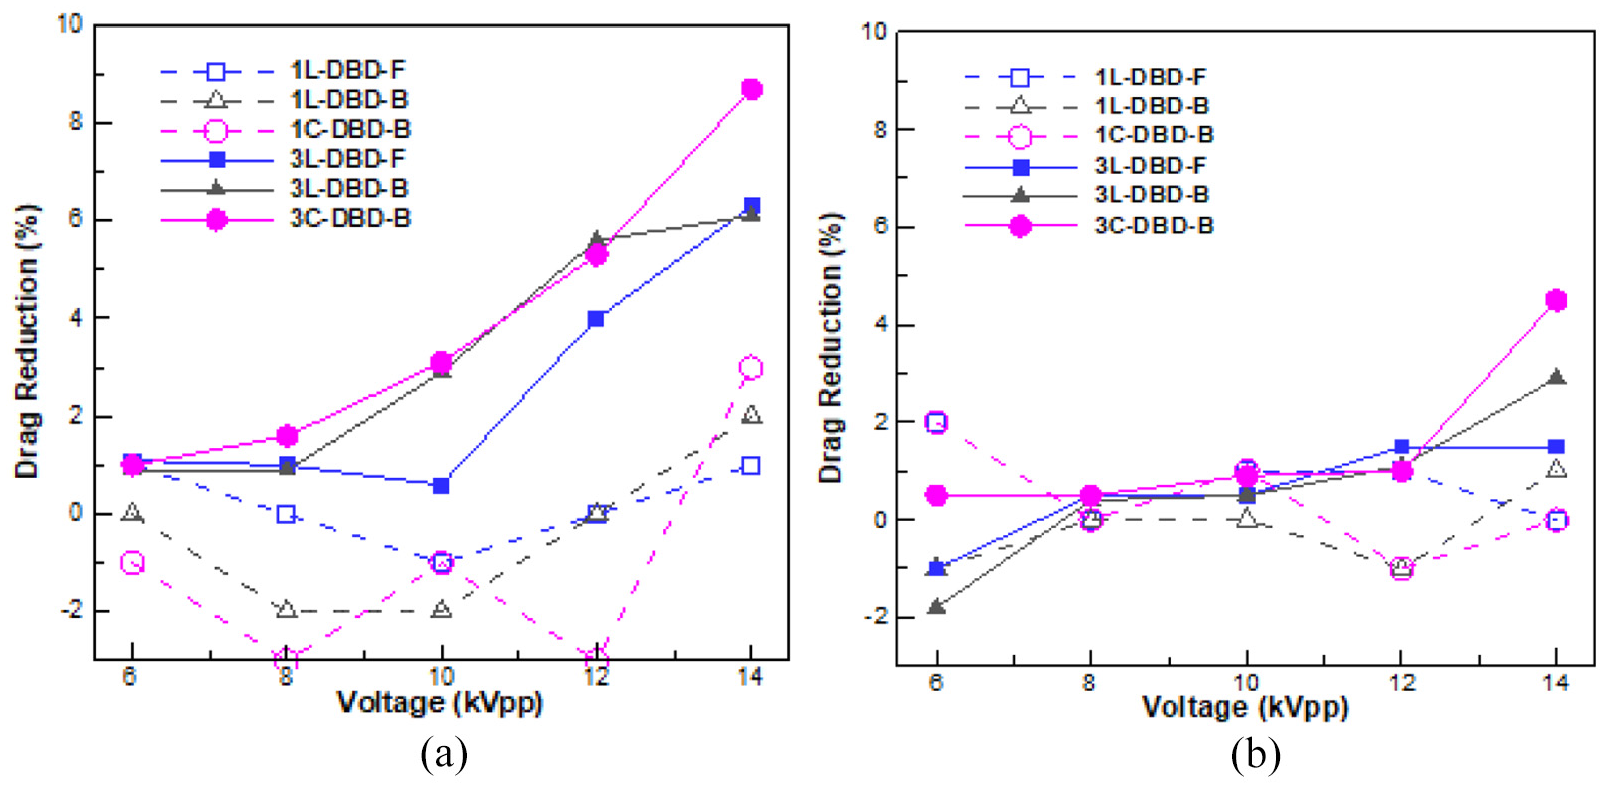
Drag reduction at the Reynolds number of (a) 25,000 and (b) 35,000.
Flow visualization
The pressure drag can be improved by reducing the size of the wake region behind the truck model. The flow visualization technique was adopted to observe the effect of the plasma actuators. A laser sheet was placed on the centerline of the truck model and parallel to the flow direction to visualize the 2-dimensional flow field behind the truck model. The Reynolds number ranged from 3,500 to 7,000 and the input voltage was set to 6 kVpp to 14 kVpp. All images were marked with white circles representing areas where vortices were shedding frequently. Figure 10 shows the flow visualization without and with the DBD plasma actuators. The wake region behind the truck is significantly reduced with the DBD plasma actuators. Based on to these images, it was found that the higher the input voltage the smaller the wake region. The comb-shaped actuators placed on the trailing edge of the trailer were better at reducing drag than the linear actuators placed on the leading edge or trailing edge.
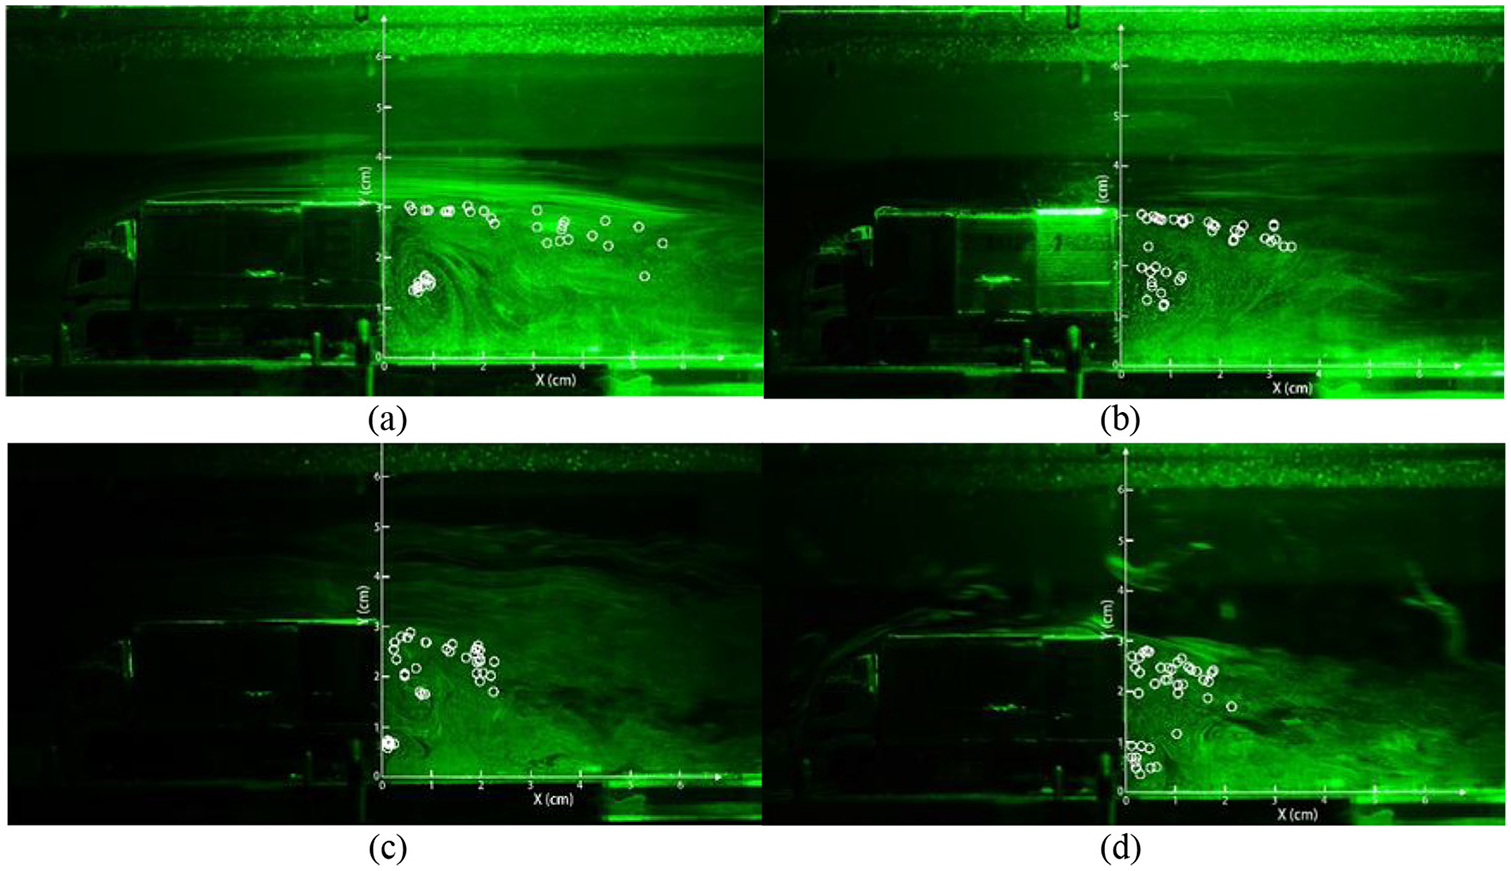
Flow visualization at the Reynolds number of 3500. (a) Without plasma and with (b) 3L-DBD-F, (c) 3L-DBD-B, and (d) 3C-DBD-B plasma actuators at the voltage input of 14 kVpp.
PIV measurement
To quantify the velocity field behind the truck model, a high-speed CCD camera was used to continuously take photos. These photos were analyzed and time-averaged by Dantec DynamicStudio software. Figure 11 shows the u-velocity flow field measured by PIV at the Reynolds number of 3500. The blue in the u-velocity contours represents the wake region and the black dashed line represents the slope of the wake region behind the truck. The comb-shaped actuators on the trailing edge show the best performance in reducing the wake region. Figure 12 shows the relationship between the length of the wake region and the input voltage when the Reynolds number is 3500. It can be seen that when the plasma actuator is turned off, the length of the wake behind the truck is approximately 6 cm. When the voltage increases, the wake length decreases in a linear fashion. The comb-shaped actuators on the trailing edge (i.e. 3C-DBD-B) show the shortest wake length of 2 cm at an input voltage of 14 kVpp. When the top actuator was operating alone (i.e. 1C-DBD-B), the wake length was 2.5 cm, which was much shorter than the case of three linear actuators on the leading edge (i.e. 3L-DBD-F).
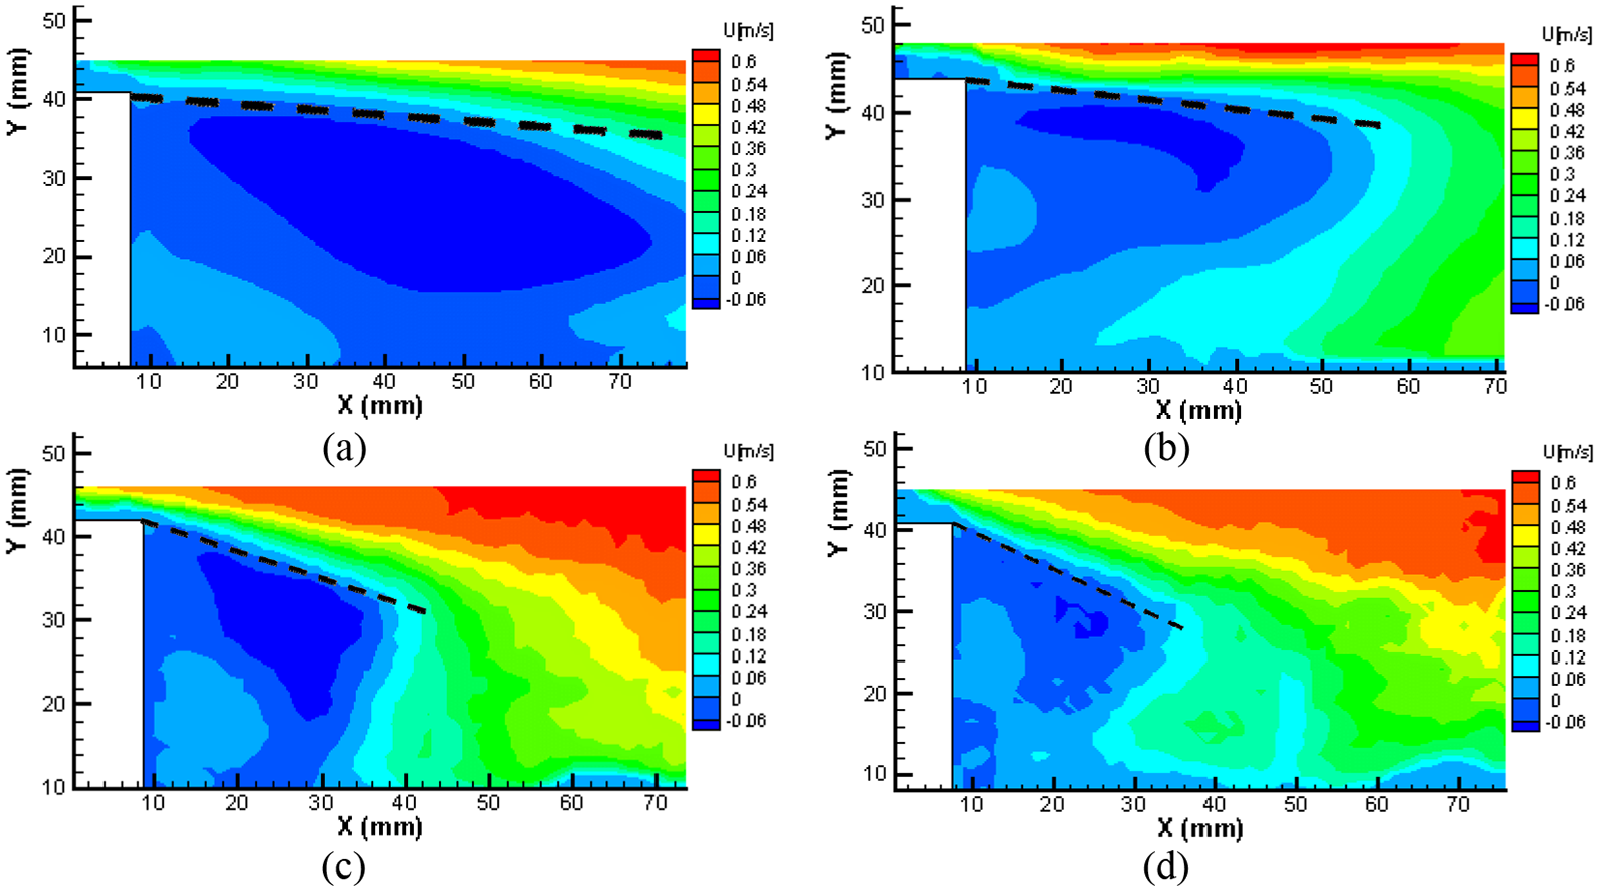
PIV measurement of u-velocity contours at the Reynolds number of 3500. (a) Without plasma and with (b) 3 L-DBD-F, (c) 3 L-DBD-B, and (d) 3C-DBD-B plasma actuators at the voltage input of 14 kVpp.

Wake length versus input voltage at the Reynolds number of 3500.
Conclusions
The main purpose of this study was to use linear and comb-shaped DBD plasma actuators to reduce the aerodynamic drag of a truck model. The power and thrust measurement results showed that the shorter the electrode length, the greater the power consumption per unit length, which is proportional to the thrust induced by the plasma. The comb-shaped actuator consumes more power than the linear actuator. For drag measurement, the three comb-shaped actuators showed the largest drag reduction of 8.7% at a Reynolds number of 25,000 and an input voltage of 14 kVpp. From the flow visualization, three comb-shaped actuators showed the best performance in terms of reducing the wake region behind the truck model. Based on PIV measurement, three comb-shaped actuators can effectively reduce the wake region behind the truck model.
Footnotes
Appendix
Handling Editor: Chenhui Liang
Declaration of conflicting interests
The author(s) declared no potential conflicts of interest with respect to the research, authorship, and/or publication of this article.
Funding
The author(s) disclosed receipt of the following financial support for the research, authorship, and/or publication of this article: The authors were supported by the Ministry of Science and Technology, ROC under Grant No. MOST 105–2221-E-155-021.