
Abstract
In order to obtain the influence of the medium bubble contents on temperature rising characteristics of a hydraulic system, the working hydraulic system of a wheel loader was taken as the research object. By carrying out the comparison experiments of the hydraulic system with and without de-aeration devices on a 5-ton wheel loader, the air bubble contents and concerning temperatures were obtained. To identify the factors which have impact on temperature rising of the hydraulic system, the head chamber of boom cylinder is taken to analyze, and the temperature rising expression in a volume were deduced. By the utilization of the thermal hydraulic library, combining with mechanism and control libraries on AMESim simulation platform, the integrated simulation model of the whole system was established and verified, meanwhile, the simulation was carried out from aspects in different air contents and initial chamber temperatures. From the simulation, the prediction models of the air contents to temperature rising, and the pressures to temperature rising were predicted. Finally, the correctness of the prediction models are verified by experiment data and showing good results, which can be used to enrich and improve the calculation and evaluation methods of heat generation to any other hydraulic systems.
Introduction
Since oil replaced water as the pressurized medium of hydraulic system in 1906, the modern era of fluid power began. 1 Due to its advantages of high power density, flexible layout, and convenient control, hydraulic technology has been rapidly developed and applied in various heavy-duty industries in recent 100 years. However, it also has some obvious technical defects, which have not been solved effectively so far, among which the problem of cavitation, that is, bubbles in oil, is one of the most typical problems. Air as one of significant pollutants of hydraulic system is often existing in the oil in the form of dissolved or/and bubbles, which has obvious impacts on the performance and reliability of hydraulic system and component.
When cavitation occurs in the hydraulic system, it may cause the problems for instance the instable pulsations of pressure and flow, the increases of noise and vibration, the slowness of response, the acceleration of oil degradation, etc.2,3 During the processes of generation, development, and collapse of the bubbles, the thermal imbalance comes out as well, 4 which directly leads to the increase of temperature in the hydraulic oil. The oil temperature rise of hydraulic system caused by the process from bubble compression to collapse is one of the significant performances of bubble thermal effect. The early research on bubble thermal effect can be traced back to the middle of the 20th century. The studies of Hickling, 5 Tomita and Shima, 6 and Fujikawa and Akamatsu, 7 showed that when the bubble is intensely compressed, the temperature at the center can reach over 6000 K. According to the later research of Flint and Suslick, 8 a high temperature of more than 5000 K can be produced after bubble collapse. Backe and Lipphardt 9 had also pointed out that during the compression of air bubbles in the oil volume, the ignition may be occurred due to the rising temperature on the boundary surfaces between the bubbles and the oil, which calls Diesel effect. Even if thermal effects are negligible for most of the collapse phase, they play a very important role in the final stage of collapse when the bubble contents are highly compressed by the inertia of the inrushing liquid. The pressures and temperatures that are predicted to occur in the gas within the bubble during spherical collapse are very high indeed. 10
There have been many studies on cavitation heat generation and damage in hydraulic machinery and other industries in recent years,11–15 which also have the relatively completed theoretical system. However, there are few studies on considering the cavitation heat generation into the thermodynamics of hydraulic system. 16
Jian et al. 17 studied the relationship between the generation and development of cavitation and the temperature change of hydraulic oil in the system, from which the Rayleigh Plesset equation was improved, meanwhile, the new views on heat transfer coefficient and polytropic index were proposed. In addition, the phenomena of the cavitation bubble luminescence in the hydraulic cone-type throttle valve was also studied by the author, 18 the cavitation effect on the hydraulic oil temperature was presented, which showed that the hydraulic oil temperature decreases in the region of the cavitation inception because the bubbles need to absorb heat from the oil, therefor, the oil temperature will be increased with the bubbles collapse.
Jiang et al. 19 took the stage of bubble growth as the research object to analyze the heat transfer situation under appropriate assumptions of thermodynamic conditions, and the mathematical expression of the temperature change of bubble was deduced by using thermodynamic principle.
Zhou et al. 20 proposed an innovative equivalent method to calculate the total heat power rate induced by cavitation based on the previously developed gas evolution equation. The simulated tank oil temperature was proven to have a good match with the measured data for both with cavitation and without cavitation cases, thus confirming the new approach.
Shen et al. 21 studied the thermodynamic processes of cavitation by carrying out experiment on the cone-type throttle valve, from which the processes of growth and collapse of bubbles were analyzed, meanwhile, the relationships between the temperatures of hydraulic oil and the growth and collapse of bubbles were deduced.
In the research of hydraulic system of construction machinery regarding oil bubbles, Suzuki et al. 22 made a comparative test on the hydraulic system of excavator with and without bubble eliminator. The results show that the system with the bubble eliminator has a lower oil temperature on average 5°C than that one without eliminator. Suyan et al. 23 carried out a test on an excavator by equipping a return oil filter, which called filter device 24 with the bubbles coalescence function produced by RT-Filter technik GmbH in HYDAC INTERNATIONAL GmbH, and found that the heat balance temperature of the hydraulic system without the de-aeration device had a higher value of 1.2°C than the setting target and didn’t meet the balance temperature requirement, whereas the system with the de-aeration device had a lower value of 3°C than the setting target and meet the requirement very well.
From the current studies of bubbles heat effect in hydraulic system, most of them were focusing on the course of the development of the bubbles and some theoretical foundations were presented. The performances of heat effect on air bubble in hydraulic oil are included but not limited: The oil temperature of whole hydraulic system would be risen because the bubbles will release the heat to their surroundings when they are compressed under the high pressure. The local bubbles would be burst and release heat intensely and even cause the diesel effect, which the local oil could be burnt and the life span of oil would be shorten. The requirement of cooling power would be increased due to the heat transfer and thermal conductivity of oil with bubbles become poor.
There is of little practical significance to study the behavior of a single bubble or a few bubbles to such a large hydraulic system of construction machinery. The studies in Suzuki et al. 22 and Suyan et al. 23 revealed that the huge amounts of bubbles in the hydraulic oil have obvious impacts on the temperature of hydraulic oil. Based on the current studies, the analysis of temperature rising to bubbles content will be further developed in this paper. By carrying out the comparison experiments of the hydraulic system with and without de-aeration devices 24 on the working hydraulic system of a 5-ton wheel loader, the oil temperature rising data will be obtained.
The prediction models of bubble content to temperature rising and pressure to temperature rising are predicted through theoretical and simulation analysis. The correctness and feasibility of the prediction models are verified by the verification results between experiment and prediction, which will enrich and improve the calculation and evaluation methods of heat production to hydraulic systems.
Experiments of bubble observation and heat balance
In order to obtain the influences of bubbles to temperature of the hydraulic system, a 5-ton wheel loader is used to carry out the experiment. The whole hydraulic system of a wheel loader is usually consisted of working hydraulic system, steering hydraulic system, and braking system. To simplify the issue, the working hydraulic system is only considered in this paper. Two configurations reservoir on the machine will be compared and the only difference between them is the oil return filter. One of them is the conventional filter without de-aeration function, and the other is a filter with de-aeration. The de-aeration filter mentioned in Suyan et al. 23 has been verified a good de-aeration performance and will be used for the comparison experiments in the study. For the hydraulic system of wheel loader is usually configured with a cooling system, in which at least part of the return oil needs to flow into the cooler and then to the reservoir, and the distribution of the amount of the oil is controlled by the back pressure valve. Only in this way can the oil temperature be controlled in an allowable range to ensure the hydraulic system works normally.
Wheel loader working system and typical working conditions
The typical working hydraulic system of a wheel loader is mainly consisted of pump, main valve, boom cylinder, bucket cylinder, back pressure valve, cooler, and reservoir. Combining with mechanical parts and materials (loads), the complete diagram of the working system of a wheel loader is illustrated in Figure 1. By means of the co-operations of boom and bucket cylinders, as well as the traction force of the vehicle, the wheel loader can realize to load and dump the materials.
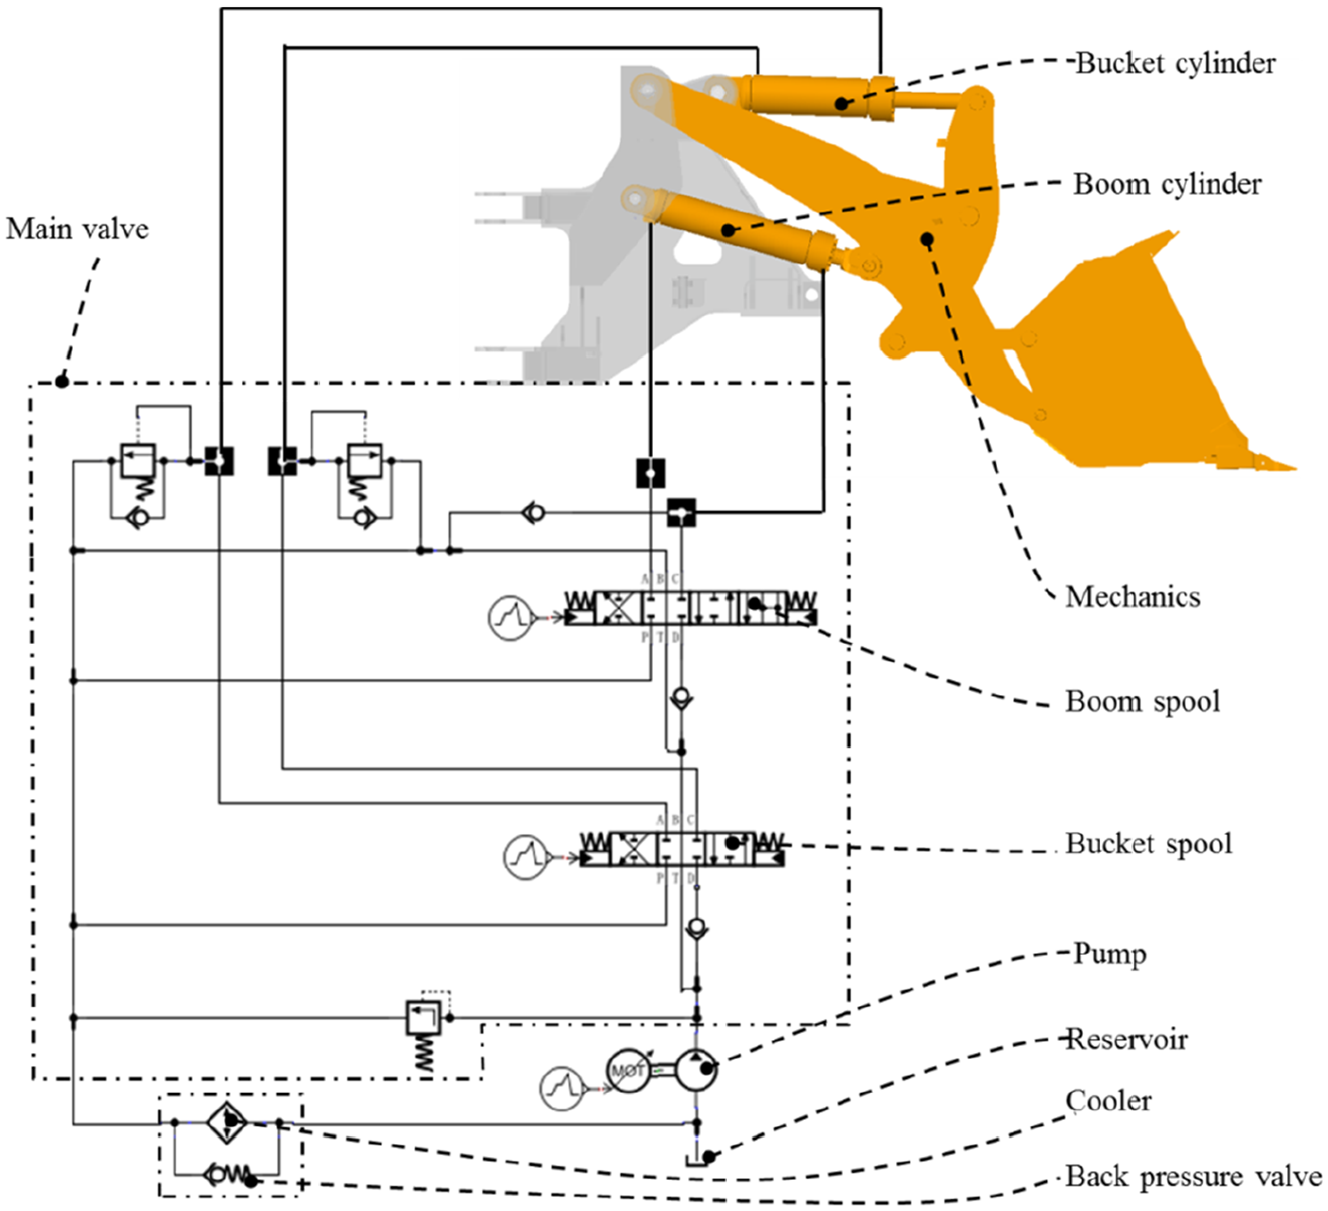
Typical hydraulic diagram of wheel loader hydraulic working system.
There are many operations can be performed according to the working conditions on the wheel loader, but just two of them need to be considered to this study. One typical operation is, in order: Bucket tilting, Boom lifting, Bucket dumping, Bucket tilting, and Boom down, which is without moving and digging and can be called in suit operation. The other is, in order: Straight forward moving, Digging and loading, Straight backward moving, Straight forward moving, Boom lifting, Bucket dumping, Bucket tilting, Boom down, and Straight backward moving, which can be called loading and dumping operation.
Bubble observation experiment
Through the visible designs on the reservoir, and under the in suit operation with no load, meanwhile the system oil temperature range in 40°C–50°C, the comparison experiments of the system with and without de-aeration devices are performed. We can see there is a huge amount of bubble from the visible window under the system with the filter has no de-aeration function, which are illustrated in (b)–(d) of Figure 2. Meanwhile, it can be seen from that the diameters of most of the bubbles are below 0.5 mm (Assume the bubble is a sphere). According to Schrank et al., 25 the bubble content in the oil can be estimated by the method of image. Consequently, the estimation of bubble content in (b), (c), and (d) is about 0.5%, 3%, 5%, respectively. That is, the higher engine speed and the faster operation, the higher bubble content in the reservoir. As shown in (a) of Figure 2, the bubble content in the reservoir is very low even under the same operation with (d) due to the de-aeration filter is used. From the reflection on the external objects and the small amount bubble on the oil surface, it also indicates that the low bubble content, from which the estimation of bubble content here is about 0.05%.

The observation of reservoir bubble under different working condition: (a) twice operations of boom lift and down under high engine speed with de-aeration reservoir; (b) idle engine speed without any operation with normal reservoir (without de-aeration); (c) high engine speed without any operation with normal reservoir (without de-aeration); and (d) twice operations of boom lift and down with high engine speed with normal reservoir (without de-aeration).
Meanwhile, this paper provides a simple method to estimate the bubble content of hydraulic system by using sampling bottles, from which the bubble content of the hydraulic system could be simply quantified to some certain extent, and there needs at least four steps as shown in Figure 3.
Step 1: Keep the oil temperature of the hydraulic system within the range of 40°C–50°C and then operate the machine under specific working conditions, meanwhile, keep the cap of the sampling port is opening during the operation.
Step 2: After each operation, from the sampling port on the top of the reservoir as shown in Figure 2, by using the sampling bottle to take the oil from the sampling area which is near the suction port of the pumps. It is required that each sampling into the bottle is filled fully, as well as the cover is closed immediately after the sampling, and repeat 10 times sampling under each operation.
Step 3: Let the sampling bottles stand until there is no small bubbles, and a cavity was formed in each of the bottle, which means all of bubbles rise up to the top of the bottle.
Step 4: Turn on the cover and add fully pure oil into the sampling bottles by using high precision graduated cylinders, the average volume of added pure oil in each operation stands for the volume of air bubble under the specific condition.

The steps of bubble content measurement by sampling bottles.
The sampling bottle of Figure 3 is 200 mL, the added oil as shown is 3.5 mL, and the air content of this condition is 1.75%.
However, this method also has some limitations. Although the air is difficult to dissolve into the oil in a short time, the empty sampling bottle will bring the possibility of increasing the air content during the sampling process. At the same time, in the process of the sampling bottle standing, the cap of the bottle may produce leakage, which will cause the reduction of bubble content in the sampling bottle. Meanwhile, in the process of adding oil to the bottle, the oil adhered to the surface of graduated cylinder will also affect the estimation of bubbles volume.
In addition, the oil temperature of the hydraulic system will rise after the machine running a period of time, and the next repeat test has to wait until the temperature drops to the demanded range, because the temperature will affect the oil viscosity, and thus affect the speed of air bubble rising and cause the change of bubble content in the reservoir. Only under the condition of certain range oil temperature, could the sampling method is feasible and reliable. Therefore, it will take a relative long time to complete the measurement even if just one working condition.
Heat balance experiment
The pipelines of hydraulic system on wheel loader are relatively complex, in which the changes of pressure and flow are drastic. The air contents and air forms, as well as the temperatures are also different from time to time and location to location in the system. This paper is mainly focusing on the pipeline of boom cylinder circuit, which is shown in Figure 4. There is about one-third return oil from the main valve going into the cooler and then to the reservoir, and the rest going to the reservoir directly. The data acquisition system we used as shown in Figure 5, which is produced by HBM Incorporation of The US and widely used in many industries. The data acquisition system mainly includes power source, computer and software, eDAQ, sensors, and cables.

The pipelines and test points locations.
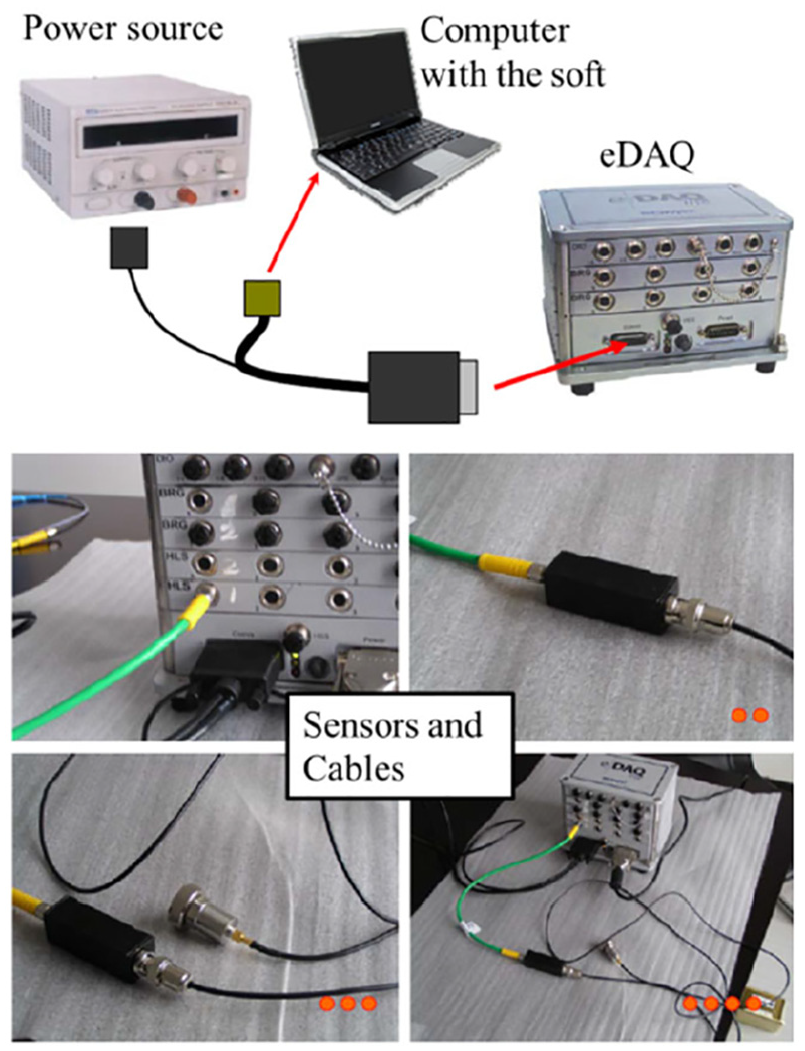
eDAQ data acquisition system.
There are usually two typical types of cooling system for wheel loader. One is the fan driven directly by the engine, which the speed of fan follows the engine. Another is the fan driven by a hydraulic motor, which the speed of fan could be adjusted automatically as necessary. In order to eliminate the influence on temperature caused by the automatic change of fan speed, the vehicle with the fan direct driven by engine was used for the study, which is also shown in Figure 2. That is, the fan speed follows the engine no matter the system is with or without de-aeration devices.
Considering the areas of low pressure, high pressure, and pressure conversion between low and high, the temperatures of different locations in the hydraulic system need to be concerned in this experiment. The test points are showing in purple lines of Figure 4 and the descriptions of the points are listed in Table 1.
Temperature test points and descriptions.

The experimental working condition of the wheel loader in this study is under the loading and dumping operation. The overall experimental data are shown in (a) and (b) of Figure 6, from which can be seen the data changing after 6000 s is very small and considered it reaches the heat balance state.

Heat balance experimental data and data conversion: (a) without de-aeration experimental data, (b) with de-aeration experimental data, (c) without de-aeration experimental data-convert, and (d) with de-aeration experimental data-convert.
From the ambient temperature curve we know, the ambient temperatures of the two experiments are different. In order to realize the comparison and analysis of the performance at the same ambient temperature, the following formula in Suyan et al. 23 is commonly used in engineering to convert the related data, which, however, is only an empirical formula in engineering. Practice shows that the estimation of thermal balance of hydraulic system on most construction machinery is applicable, but there is uncertainty whether it is applicable to hydraulic system of other machinery or industries.

Where Tb is the heat balance temperature, Tamb is the ambient temperature, Tact is the actual temperature, and 45 (°C) represents the highest ambient temperature which the machine can work normally. The converted results are shown in (c) and (d) of Figure 6.
In order to compare the influence of bubble content to oil temperature changing under the same ambient temperature in hydraulic system, the data after 6000 s of (c) and (d) in Figure 6 were extracted, meanwhile, the data of the same measurement point were put together as shown in Figure 7. Averaging the data of each curve, and then making a subtraction in each group, the temperature difference of with and without de-aeration devices on each test point are shown in Table 2. As we can see, there is a maximum difference reaching 8.1°C at suction port of the pump, and a minimum 4.5°C at the outlet of cooler. The average temperature difference among the points is 5.7°C, that is, the oil temperature of the hydraulic system with de-aeration device is lower than the one without de-aeration device, and the difference can reach to 5.7°C on average.
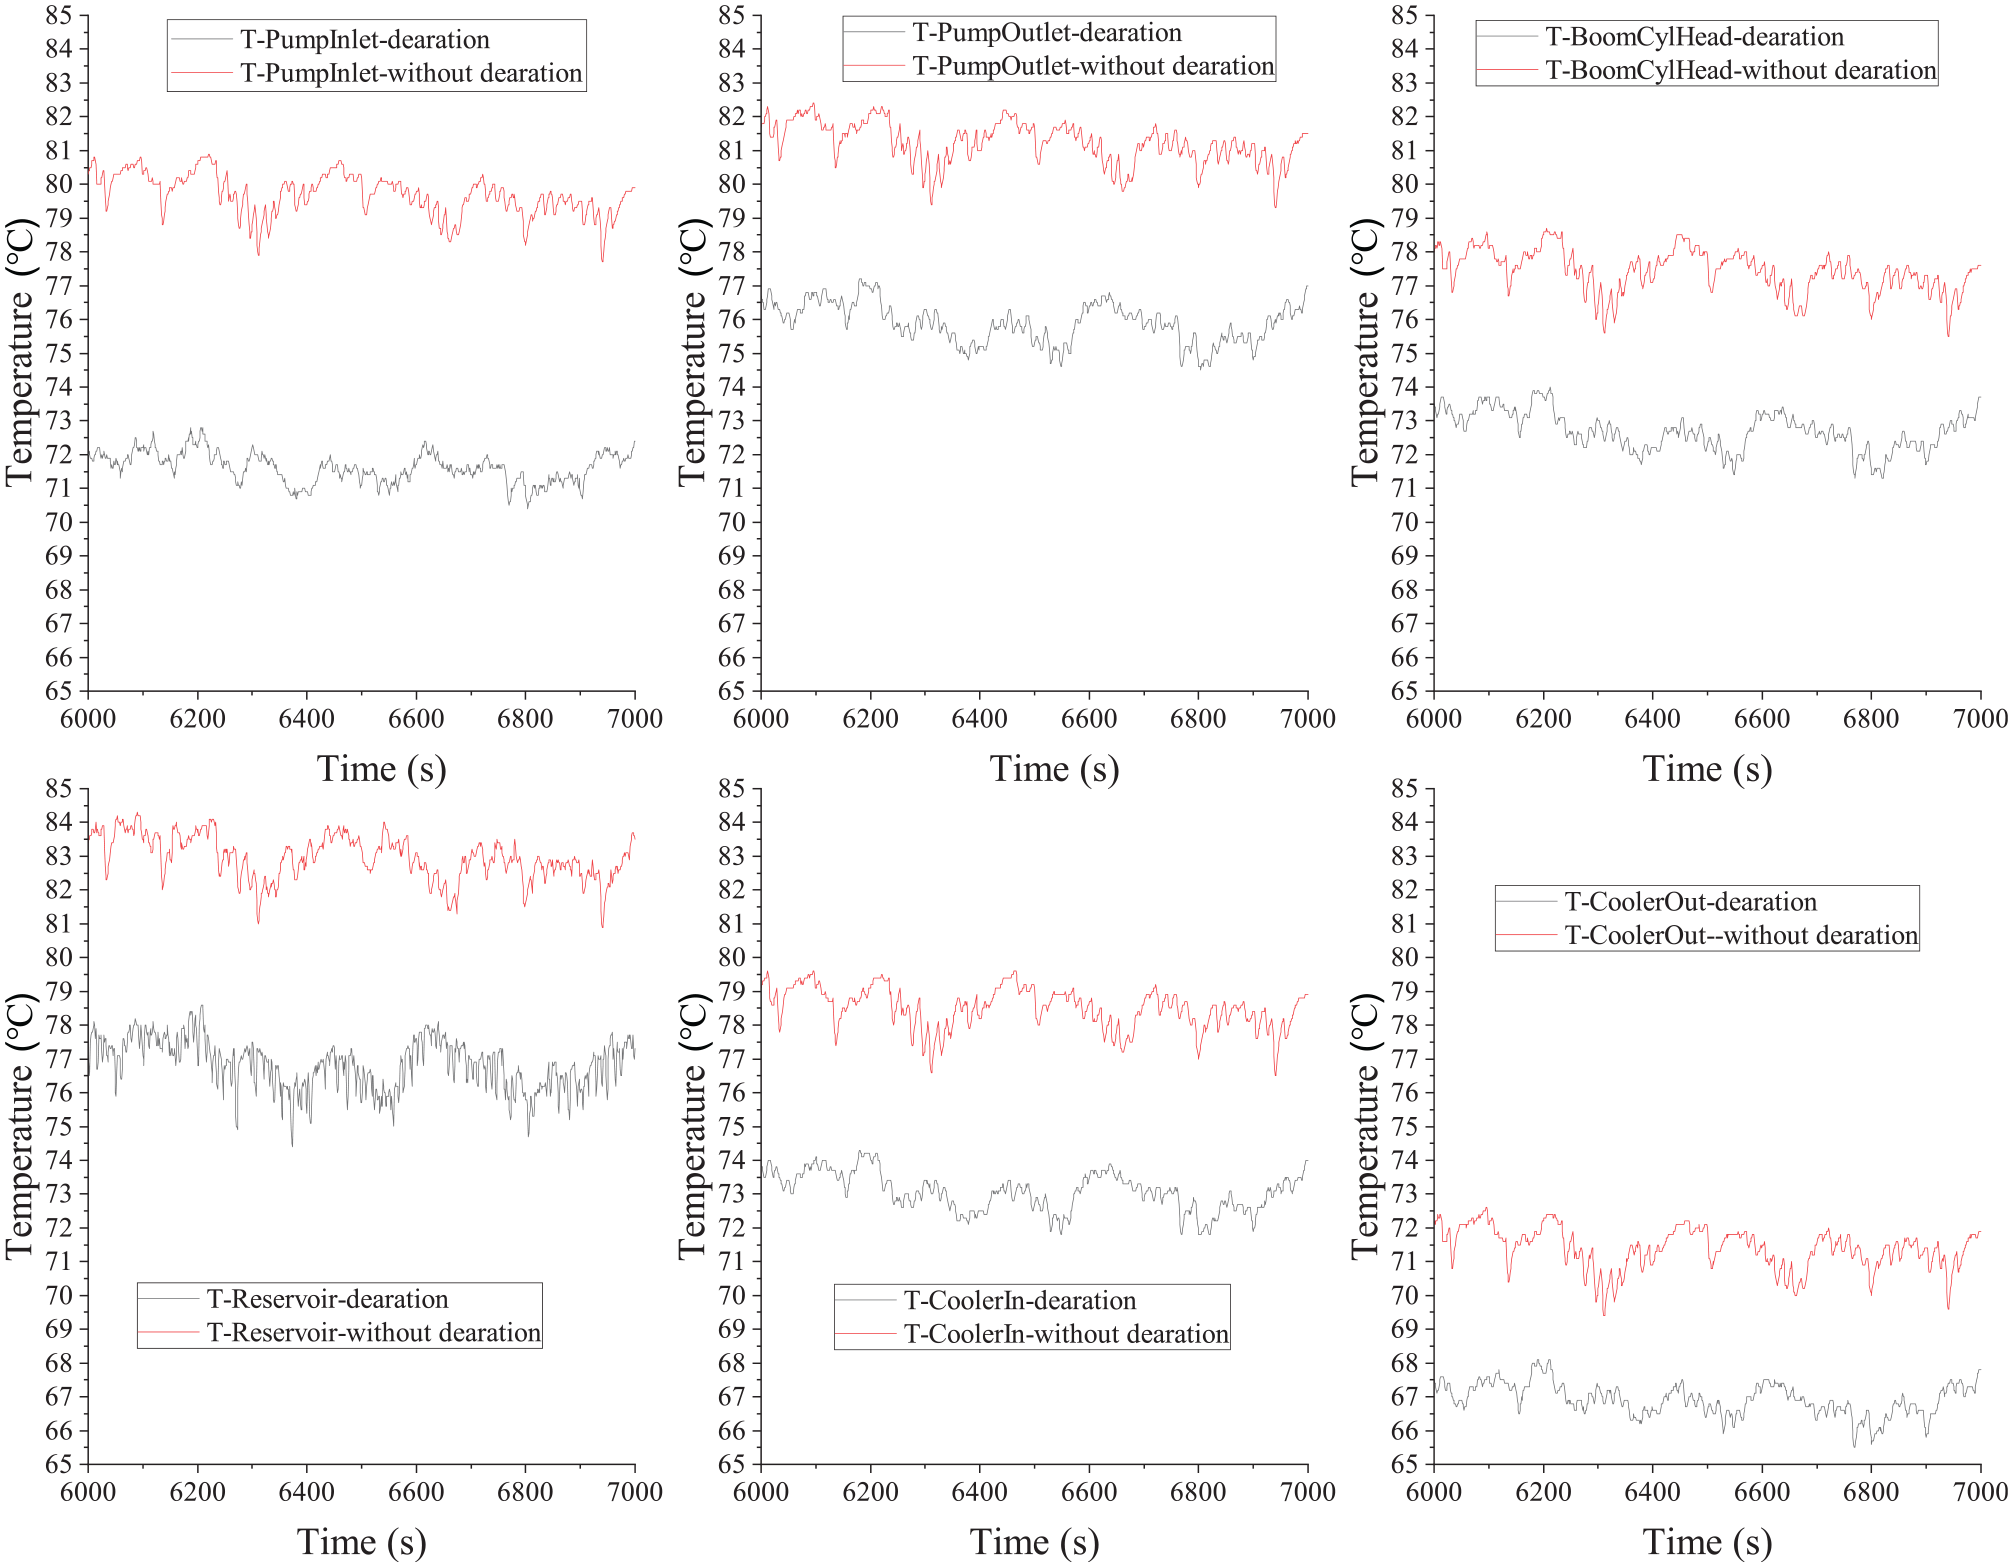
Data comparisons of temperatures in heat balance stage.
Temperatures and the differences of test points (Unit here is °C).

Theoretical analysis
In order to find the factors that caused the difference of the temperature rising in the heat balance experiment, the theoretical analysis is necessary. For the bubble in hydraulic system, under the condition of low pressure, it has a large size and flow with the oil. However, at the conversion moment from low pressure to high, the bubble will be compressed suddenly. Meanwhile, due to the compressed period is extremely short, the pressure gradient changes sharply and leads to the heat generation.
From the working hydraulic system, it can be seen, the head chamber of boom cylinder is a typical volume which the pressure changes periodically and from height to height through the operations, which will be used as the research object to carry out the theoretical analysis in this paper, as shown in Figure 8. D, L, and dL is the piston diameter, cylinder stroke, and length of control volume, respectively. The control surface 1-1 is the inlet of the volume, and 2-2 is the outlet.
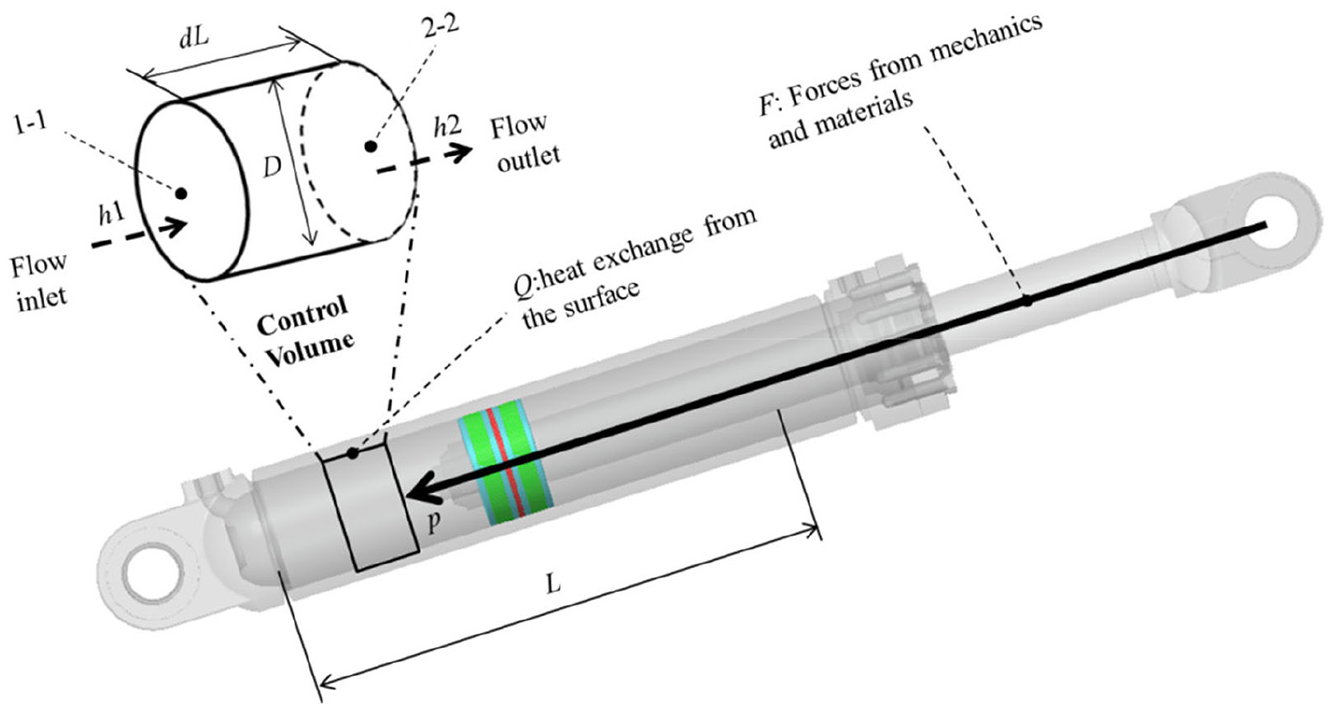
Boom cylinder and the analysis control volume.
The change of internal energy or temperature in the control volume reflects the characteristics of heat effect. According to the knowledge of fluid mechanics, the change of internal energy in the control volume of this object is consisted of the mechanical work of loads imposing on the control volume, the heat exchanging between the control volume surface and the cylinder wall, and the net enthalpy flowing on inlet and outlet of the control volume, which can be expressed as 26

Where, m is the fluid mass of the control volume; u is the internal energy of unit mass of fluid; p is the pressure acting on the control volume; V is the volume of the control volume; Q is the heat exchange amount between the surface and the wall; hi is the enthalpy flow rate of unit mass on the inlet and outlet.
Enthalpy is the sum of the external energy and the product of pressure and volume, which can be written as

Substituting equation (3) into equation (2), considering the mass m is the product of density ρ and volume V, and yields the following result for the change of enthalpy flow rate in the control volume as

For the simple systems, enthalpy is a function of any two independent state variables in pressure, volume, and temperature, which can be written as

By using Taylor series method to expand equation (5) with respect to time, and considering the variables p and T, then neglecting the higher-order terms, we can get

Where
Combining equations (4)–(6), and the temperature derivative equation can be obtained as

We define the density of oil and air are ρl and ρg respectively, and the volume fraction of oil and air are xl and xg respectively, then the density ρm of the mixture of oil and air can be expressed as

Substituting equation (8) into equation (7), as well as considering the geometry parameters of control volume, the Equation of temperature derivative can be expressed as

We know, the isobaric volume expansion coefficient is defined as

Substituting equation (10) into equation (9), and simplifying the density, we can get

Equations (9) and (11) are the expressions of temperature changing of the control volume. We can know from that:
From equation (9), when the oil is mixed with air, the density of the mixture will be decreased, the denominator on the right becomes smaller, and the temperature of the control body will be risen.
From equation (9), if the percentage of air is zero in the oil, the denominator on the right will not be changed. The temperature changing of the control volume is only related to the work done by the pressure, the heat exchanging on the surface and the enthalpy flowing on the inlet and outlet.
From the first term of the numerator on the right in equation (9), the larger the size of the chamber, the slower the temperature rising in it.
From equation (9), it can be seen from the second term of the numerator on the right that the greater of the medium compressibility, the higher initial chamber temperature and the higher chamber pressure will produce a higher temperature changing.
From equation (11), it can be seen from the numerator on the right under the isobaric volume expansion coefficient and chamber pressure are constant, if the initial temperature of the chamber is higher, the lower of the whole numerator on the right would be, and the temperature of the chamber changing would be slowed down.
Simulation and models prediction
Based on the previous theoretical analysis, we know there are many factors have impact on the temperature changing of the chamber, on which the air content, the chamber pressure and the initial oil temperature will be focused. Considering the target of this paper is the research of the temperature issue of hydraulic system, we will use the thermal hydraulic library of the AMESim software to establish the simulation model of the hydraulic system as shown in Figure 1 to study the influences of different factors on the temperature changing characteristics of a cylinder chamber.
System modeling and verification
The simulation model is shown in Figure 9, which consists of thermal hydraulic system, mechanical system, and control system. The sub-models of pump, valves and cylinders are choosing the thermal models to simulate the heat effects. Meanwhile, the floating function of boom spool is not considered (The rightest position of boom spool in Figure 1). The position limited devices are set among the mechanics to simulate the pressure sudden generated by the interference of mechanics in the limitation positions.

Heat hydraulic simulation model of wheel load working hydraulic system with mechanical and control parts.
The medium models and main parameters as follows: The oil model is ISO VG46 OIL-MOBILE DTE MEDIUM. The polytropic exponent is 1.4. The model of aeration and cavitation is STANDARD CAVITATION MODEL. The model of cavitation and dissolution is GAS TRANSPORT MODEL. The rest parameters remain default.
In order to verify the correctness of the simulation model, we need a comparison between the simulation results and the actual test results. The pump speed control signal and the spools control signals use the actual test data. The loads imposed on the mechanics are converted by the pressures of the cylinders from the test results.
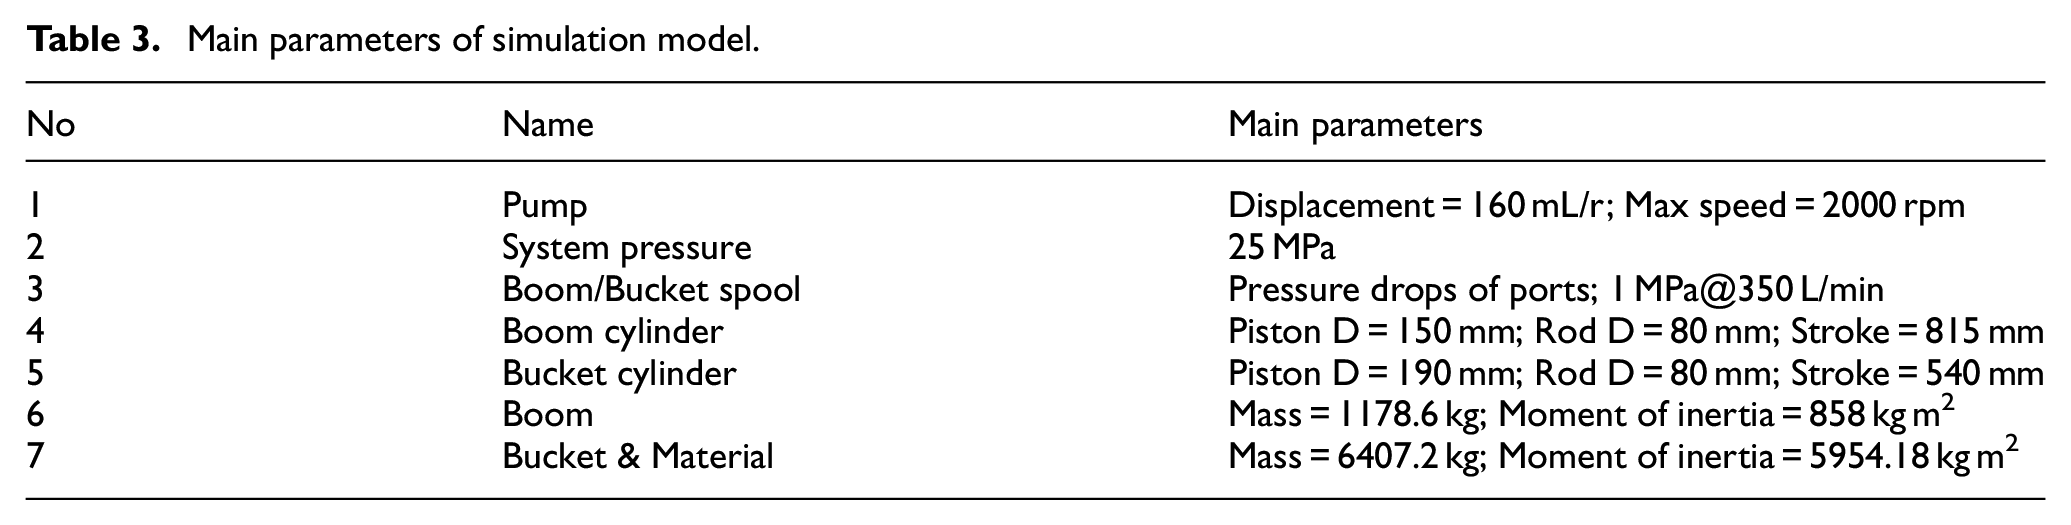
The main parameters of the model are shown in Table 3.
Main parameters of simulation model.
There is only one command input port for the spool in simulation model, but the actual spool has two pilot pressure ports, and therefore the actual test pilot pressures need to be converted into the commands for simulation. The conversion model is shown in the red part of Figure 9, though which we just need to load the actual test data on it and the simulation commands of the spools are available. The data of two cycles which lasts 110 s were compared on this model. Figure 10 shows the converted data of the spool pilot pressures to spool commands in the first working cycle, from which, the first 13 s data were deleted compared to Figure 11 which is the comparison results between the test data and the simulation data in two completed working cycles. It can be seen from the results that there is only a gap on average about 5% between the test and the simulation, which indicates that the simulation model is feasible and reliable.

The conversion of spools control data from experiment to simulation. I-Dig and load; II-Boom lift; III-Bucket dump; IV-Bucket tilt; V-Boom down; VI-Next cycle.

Comparison results of simulation and experiment.
For further explanation to the comparison results, we know that the pressure depends on the load to hydraulic system, and the loads what impose on the simulation model are converted from the actual measured pressures of the hydraulic cylinders, therefore the pressures of simulation output and the actual are highly consistent. However, there are some areas not matching very well. For the beginning of the simulation results, the initial pressure of cylinders is not easy to obtain and caused a relative big gap at the first 13 s. For the gaps, for examples from 27 to 35 s, 46 to 50 s, and 59 to 62 s, are caused by the internal forces of working mechanism when they reach to the limitation positions. It can be seen from that the actual measured results are relative higher than the simulation, because some detailed structures of the mechanism are difficult to be considered on the simulation model.
For the flow rate of the cylinder, we know that the flow rate is the product of pump displacement and rotation speed. The displacement of the pump in the actual and simulation are the same, and the actual measured pump speed was used to control the pump in simulation model, so it can be seen the gaps of flow rate between the actual and the simulation could be almost neglected. Some local fluctuations happened in the simulation results are due to the response time and resolution.
For the displacement of hydraulic cylinder, which has relations with flow rate and structure parameters, due to the structure parameters of cylinder are fixed, therefore, as long as the flow rate is correct, the displacement is correct. It can be seen, however, there is a gap after 55 s, this is caused by the conversion of the actual pilot pressure to the simulation control signal, from which some local detailed are neglected during the conversion, but the tendency and magnitude fit very well.
Nevertheless, the focus on this paper is the rising step of boom cylinder, some differences out of this range have no substantial impact on the research target, and therefore there is no effort on those differences in this paper.
Control model simplification
For the facilitation of the problem studying and the shortened time consuming of simulation, it is necessary to simplify the control model. The principle of simplification is to carry out the operations under the fastest speed in the cycle in order: Bucket tilting, Boom lifting, Bucket dumping, Bucket tilting, and Boom down, which is the in suit operation mentioned previous but here with loads. The simplified model is shown Figure 12, and the rest of the whole model is not changed as shown in Figure 9. Figure 13 is the outputs of the simplified control model, it can be seen from that the pump speed control commands follow the valve commands, in which the pump is at the highest speed only under the condition of the hydraulic system is operated.
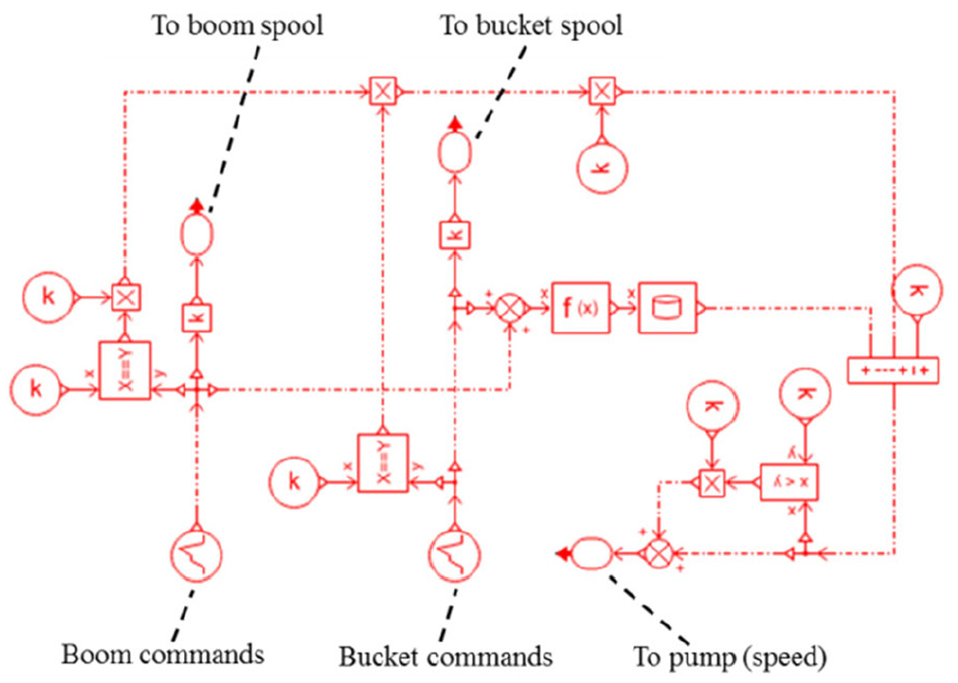
The simplified control model.

The outputs of simplified control model.
Air contents simulation and model prediction
There is an approximation of 10% air dissolved in the oil under the condition of atmosphere pressure (0.1 MPa) and ambient temperature at room temperature (25°C). When the local pressure is lower than the saturation pressure in the hydraulic system, there would be occurred aeration and bubbles in the oil. Meanwhile, the air around the oil surface in the reservoir could be swept into the oil when the machine works under the heavy vibration. Consequently, the bubble content in the oil could be increased from these ways. For hydraulic system, the total air content in the oil is the sum of dissolved air and air bubbles, and the bubble content includes the total gas and vapor volume fractions. Considering the practical issues and some extreme conditions, for the hydraulic system of wheel loader, the air content can be set to 0%, 1%, 5%, 10%, 15%, 20% for study in this paper. It means that in these cases when the air content exceeds 10%, there would be bubbles in the oil. The working temperature of hydraulic system is usually around or over 60°C. Accordingly, we choose the temperature at 60°C as the reference to study the heat effect characteristic of different air content in the hydraulic system, and the parameters changing in the head chamber of boom cylinder are mainly concerned.
Figure 14 is the simulation results of a single group of air content. It can be seen from that the pressure and displacement of boom cylinder are consistent with the result trends in Figure 11, which indicates that the simulation results are credible.

The simulation results of single air content. I: Boom lift; II: Boom holds at highest position; III: Boom down.
During boom lift stage I, the temperature in the cylinder increases with the increase of the pressure. The bubbles in it are compressed gradually with the pressure increasing and leads to the heat released.
During stage II, the boom holds at highest position, the head chamber and rod chamber of boom cylinder are both closed by the boom spool. Under this condition, when there are operations on bucket spool, the interference of mechanics will cause the unexpected pressure changes to the chambers of boom cylinder. Meanwhile, the pressure of the head chamber in boom cylinder is at the highest level, which will lead the temperature reach to the highest value when the bubbles compressed under this condition.
During boom down stage III, the path between the head chamber of boom cylinder and return oil line is connected by the spool, thus some heat is taken away. Meanwhile, the bubbles expand with the pressure of the chamber decreasing. During the course of expansion, the bubbles absorb heat from the surrounding as well. The two reasons lead to the temperature decrease in the cylinder chamber during this stage.
Figure 15 illustrates the temperature rising characteristic of the head chamber in boom cylinder during the working process under different bubble contents. From the detailed views on stage I and stage II, which could reference from Figure 14, it can be seen that the more the air content in the chamber, the higher temperature rising. In order to study the quantitative relationships of air contents to temperature rising under different pressures, the relationship between pressure and temperature rising needs to be established under each air content condition. We can see from the latter part of stage I as shown in Figures 14 and 15, which shows satisfactory linearity among the curves. From it, the data could be extracted and used to construct the relationship of temperature rising to air content along the full range change of pressure. The data extracted is shown in Table 4.

Temperatures of boom head chamber under different air content.
Internal temperature of boom cylinder changing with pressure under different air contents.

Ti is used to represent the temperature changing when the air content is i%, R is used to represent correlation coefficient. The data in Table 4 is fitted in linear mode and shown in equation (12). From the equations, it can be seen the gaps between any of the two adjacent are very small. In order to identify the gaps of the temperature rising under the different air content easily, the first group of air content is 0 can be used as a baseline. The other groups minus the baseline, and consequently, the data of temperature rising with only the influence of air content is obtained, which is illustrated in Figure 16. From the results we can see, when the air content is about 1%, 5%, 10%, 15%, 20%, the temperature rises about 0.01°C, 0.05°C, 0.1°C, 0.18°C, and 0.25°C, respectively.


Temperature rising at differences air contents.
In order to obtain the relationship of the more different air contents to temperature rising, the air content could be set as the variable and temperature rising as the function, and then the relationship of air content to temperature rising through linear fitting and can be given by
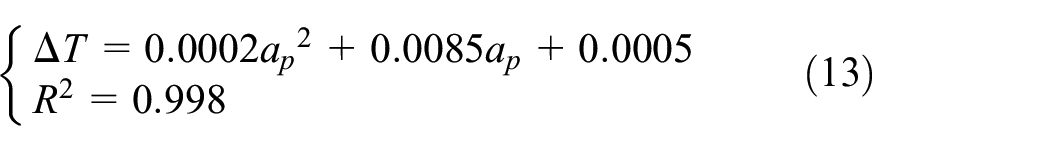
Where ap is the air content and ΔT is temperature rising.
Equation (13) is the prediction model of air content to temperature rising, in which the air content is variable, while the temperature rising is function. In the air content range from 0% to 50%, and set the temperature rising to 0 at air content is 0, the changes of temperature rising to air contents could be illustrated in Figure 17. From the curve we can see, the temperature rising will be faster and faster with the increase of air content. When the air content is lower than 10%, the temperature rising has a good linear relationship. Whereas, the temperature rising increases as a quadratic function when the air content exceeds 10%. Here can be explained that the reason of the curves in Figure 16 are not parallel to the X-axis when the air content is at 15% and 20%.
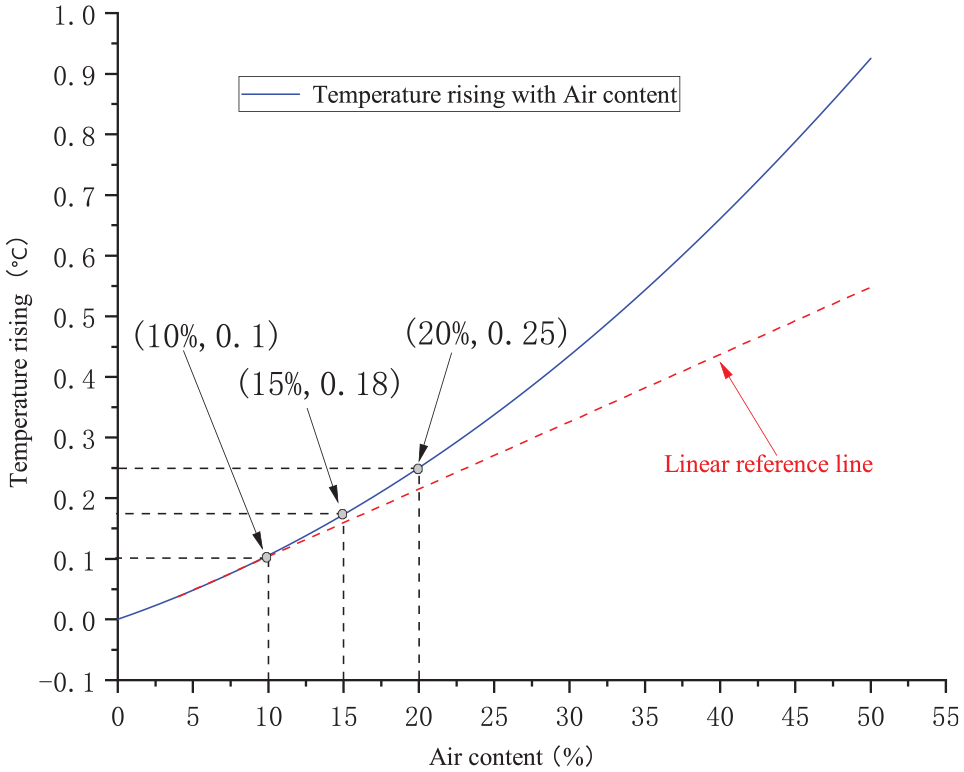
Temperature rising under air contents.
From Figures 16 and 17, combined with equation (12), it can be seen when the total air content is higher than 10%, that is, when bubbles appear in the oil, the increase of temperature no longer has a linear relationship with the bubble content. Goto et al. 27 points out that when the bubble content of the hydraulic system exceeds 5%, that is, when the total air content exceeds 15%, the hydraulic pump will work abnormally. Therefore, the air content boundary of this paper has reached to 20%, which has exceeded the boundary that the hydraulic pump can work normally. Higher air content is of little practical significance for engineering. Although equation (13) is obtained through fitting by limited data, and there may be some limitations and accuracy problems, it can be used to predict the change trend of hydraulic system temperature rising with bubble content within a certain bubble content range.
Initial temperatures simulation and model prediction
It can be seen from the theoretical analysis that the pressure of the chamber has impact on the temperature rising performance of the system. In order to predict the model, the certain air content under different chamber initial temperatures in the same pressure range is studied in this section. From the bubble observation experiment we know, the system without de-aeration device has air content about 15%, therefore this air content is chosen for this study for the convenient comparison with the experiment. The simulation results of Figure 18 are the initial temperatures of the chamber at 20°C, 40°C, 60°C, 80°C, 100°C respectively, which shows the amount of temperature rising is gradually decreasing with the increase of the initial temperature. Similarly, in order to obtain the relationship between the temperature rising and the initial pressure of the chamber, the data of the latter part of stage I was extracted. The temperature difference ΔT is equal to the simulation result minus the initial temperature, and the pressures could be referred from Figure 14. The data is shows in Table 5. Tin is used to represent the amount of temperature increasing when the initial chamber temperature is n, then the relationship through linear fitting is shown in equation (14).


Temperature rising under different initial chamber temperatures.
Temperature rising with pressure under different chamber initial temperatures (The unit of temperature here is °C, and pressure is MPa).

Equation (14) is the prediction model of pressure to temperature rising under a certain initial temperature, in which the pressure is variable, while the temperature rising is function.
We set the amount of temperature rising to 0 when the pressure is 0. The amount of temperature rising to the pressure under different initial temperatures of the chamber are illustrated in Figure 19, which shows that the lower the initial chamber temperature, the higher the amount of temperature rising. Meanwhile, the amount of temperature rising is negative when the pressure is relatively lower under the relatively higher initial temperature, which indicates that the bubble is not releasing the heat to the surrounding but absorbing at these moments.

Temperature rising under different initial chamber temperatures.
When the pressures in Table 5 are taken as references, we can obtain the relationship of the amount of temperature rising to the initial temperature in Figure 20, which indicates that the higher the initial temperature, the lower the amount of temperature rising under the same pressure. Meanwhile, the relationship between oil temperature and density shows that the higher the oil temperature, the lower the density. The curve in red of Figure 20 is the density test result of ISO 46# hydraulic oil with the temperature changing, from which we can see the relationship between the initial chamber temperature and the amount of temperature increased could be also illustrated by the relationship between the density and the latter.

The relationships among initial temperature, temperature rising and density.
Models verification
It is generally accepted that the heat generation of a hydraulic system is caused on account of power loss, and the more the loss, the more the heat. Generally speaking, the estimation value in the amount of heat generation based on the power loss is lower than the actual, because the heat effect of air bubbles in the hydraulic oil is not considered according to the traditional calculation method. We get two models of temperature rising prediction previous. One is the relationship of air content to temperature rising, and the other is the relationship of pressure to temperature rising under the certain initial temperature. To verify the correctness and feasibility of the prediction models, the temperature data of heat balance experiment need to be used.
The model of air content to temperature rising
In order to verify the model of air content to temperature rising, the air content in the system needs to be known. From the observation results in suit operation, the bubble content of the system without de-aeration is about 5% under the tough conditions, whereas, the system with de-aeration is about 0.05% under the same conditions. Meanwhile, we assume that the air contents in all locations are the same, although they are different in actual. The comparison of air content to temperature rising needs a stable temperature, therefore the data of heat balance stage as shown in Figure 7 is the studied object.
We excerpt the data of head chamber on boom cylinder in the range from 6600 to 6950 s as study. It includes 10 cycles as shown in Figure 21, from which we can see there is a corresponding relation between each working cycle and each temperature changing. In the actual experiment, the sampling frequency of temperature is 1 Hz, while the displacement is 100 Hz, consequently, the corresponding relation among the data points is not very strict. However, according to the change of temperature curves, it can be seen there are 10 times of rise, indicating that the frequency of temperature changing in the cylinder chamber is consistent with the boom lifting.

Temperature rising in cylinder chamber under heat balance phase.
The statistics of temperature rising in each cycle are shown in Table 6. For the system without de-aeration, the temperature rising in the cylinder chamber is 0.16°C on average, and for the system with de-aeration, the value is 0.13°C.
Temperature rising in each cycle.

The prediction model of equation (13) represents the relationship of temperature rising to air content. We substitute the air content of 10.05% and 15% respectively and obtain (Notice that the air content is the sum of dissolved air and air bubble)

The temperature rising of the prediction in the head chamber of boom cylinder is 0.173°C under the air content is 15%, compared with the experimental result 0.16°C, which has a difference of 0.013°C (An error about 7%). The reason of the difference is caused by the reduction of the amount of bubbles, which will reduce to some extents with the time increasing as the machine works. We substitute the actual temperature of 0.16°C to the prediction model and get the air content under the situation is 14.1%.The bubbles in the system will decrease with the working time of the machine, which is due to the natural rise of bubbles in the reservoir. Image (d) in Figure 2 is the bubble status during the short-time operation in situ. A certain amount of bubble will rise above the oil level in the reservoir if the time is long enough, and resulting in a certain reduction in bubble content.
For the system with de-aeration device, the temperature rising of prediction in the head chamber of boom cylinder is 0.106°C under the air content is 10.05%, compared with the experimental result 0.13°C, which has a difference of 0.024°C (An error about 18%). The reason of the difference is caused by the increasing of the amount of bubble. As mentioned previous, the air around the oil surface of the reservoir is very easy to be swept into the oil when the machine works under the heavily vibration, and resulting in the increasing of bubble content. According to the prediction model, under the temperature rising at 0.13°C, the air content in the chamber is about 11.5%, which means there is about 1.5% bubble content in the oil even the system with de-aeration device.
In general, the temperature rising of the experiment is within the scope of prediction. The gaps between the experiment and prediction are caused by the working state of the machine, which are in accord with the actual and can be explained not only in theoretical but also in practical. The results of prediction and experiment are verified mutually, which shows the prediction in equation (13) is reliable and feasible.
The model of chamber pressure to temperature rising
In order to verify the model of pressure to temperature rising under a certain chamber initial temperature in the unique air content, the pressure and the chamber initial temperature need to be concerned. From the experiment previous, we know the air content in the system without de-aeration device is around 15%, therefore, it is the object needs to be focused on in this section.
We excerpt the data of temperature in the range from 60°C to 70°C to study, which has 20 cycles from 85 to 770 s and as shown in Figure 22. Making an enlarged view of the extracted curve and putting together with the cylinder displacement as shown in Figure 23, we can see the variation of experimental results has the same trend with the previous description. That is, the boom cylinder lifts one time and the temperature in the head chamber changes one time.

Temperature data of cylinder chamber excerpted in heat non-balance phase.

Temperature rising in heat non-balance phase.
The extraction of the temperature data under each cycle from Figure 23 is shown in Table 7, from which can be seen that with the increase of oil temperature, the amount of temperature rising shows an overall downward trend. In this temperature range, the average temperature rising on each cycle was 0.53°C on average.
Temperatures of each working cycle.

During the process of boom lift of wheel loader, the pressure in the head chamber of the cylinder changes from height to height. We know that there needs a period for the rising of temperature but the pressure changing is instant. Therefore, in order to study the relationship between pressure and temperature, the pressure in a cycle needs a processing of mean value. The curves illustrated in Figure 24 are the displacement and the head chamber pressure of boom cylinder in 10 cycles in the range from 80 to 430 s. The mean value of pressure in the 10 cycles is 9.58 MPa, and the mean value of the first cycle which initial temperature at 60.3°C is 10 MPa. We can see from Table 7, the temperature rising in the first cycle that the initial temperature at 60.3°C is 1.1°C.

Pressure and displacement of cylinder under without de-aeration cycle.
From the prediction model of equation (14), the relationship of temperature rising to pressure which is under the conditions of 15% air content and 60°C initial temperature in the chamber is as follows

Substituting the mean pressure value of the first cycle p = 10 MPa into equation (15) and obtain

By comparing the results of experiment and prediction value above, it can be seen that the prediction value is about 0.08°C lower than the experimental, that is, there is an error of about 7%. The error of the fitting formula itself and the estimation of the air content in the system may affect this accuracy. But in general, the prediction of temperature rising versus pressure under the certain air content by equation (14) is feasible.
Conclusions
From the visible experiments on the wheel loader, for the system without de-aeration, the bubble content could reach to 5% under the tough working conditions whereas the system with de-aeration is only about 0.05%. The average temperature of the hydraulic system with de-aeration reduces by about 5.7°C compared to the system without de-aeration.
The theoretical relationship of temperature changing in limited space like a cylinder chamber is deduced. And the main factors affected the changing are identified, which including the air content, medium density, initial oil temperature of the chamber, pressure, and chamber size, etc.
The simulation model of the whole working system of the target wheel loader was established, of which the hydraulic components are all thermal used to simulate the heat effect of the hydraulic system. The simulation results were compared with the experimental and showed that there is only about 5% difference between them, which verified the correctness and feasibility of the simulation model. Through the analysis of the simulation results which was under the simplified control model, the prediction models of the air contents to temperature rising, as well as the pressures to temperature rising were predicted. When the air content is lower than 10%, there is a fine linear relationship of air content to temperature rising. Whereas, when the air content exceeds 10%, the relationship will be changed in the type of quadratic function. Meanwhile, the temperature rising in the chamber has a fine linear relationship change with the pressure under the certain air content at a certain chamber initial temperature.
By comparing the experiment and prediction results, for the prediction model of air contents to temperature rising, there is a error of 7% under the air content is 15%, and the error is 18% under the air content is 10.05%. For the prediction model of pressure to temperature rising, there is an error of 7%. The errors among the experiment and prediction are caused by the working state of the machine, which can be explained not only in theoretical but also in practical and verified the correctness for the predictions. The prediction models can be used to enrich and improve the calculation and evaluation methods of heat generation to any other hydraulic systems.
However, due to the current experimental and estimated methods in bubble content existed limitations, as well as the experiment was carried out on the machine and many conditions were not easy to control, meanwhile considering the accuracy of the measure instruments, the estimation of the bubble contents in the hydraulic system may be not so accurate. In addition, the prediction model was obtained from numerical fitting by the limited data, which may result in inaccurate to the model itself as well. Considering all of the factors above, the comparison results between the prediction values and the experimental have a relative large error in some working conditions is understandable. If the air content can be measured accurately in the future in hydraulic system, a simple hydraulic test bench can be built in the laboratory to improve the prediction model equation (13) by carrying out the heat balance experiment of the system. Meanwhile, we suggest that the air content in the oil and the ambient temperature should be controlled strictly, as well as the higher resolution instruments need to be used during the experiment.
In conclusion, equation (12)–(14) are the prediction models obtained by simulation, which have certain reliability within the specific engineering scopes and boundary conditions, but whether they are applicable beyond the scope and boundary remain to be verified.
Footnotes
Handling Editor: Chenhui Liang
Declaration of conflicting interests
The author(s) declared no potential conflicts of interest with respect to the research, authorship, and/or publication of this article.
Funding
The author(s) disclosed receipt of the following financial support for the research, authorship, and/or publication of this article: This work was supported by the Science and Technology Department of Gansu Province of China under Grant 2018620001000830.