
Abstract
The nut manufacturing machine operates almost continuously throughout the day and, consequently, requires frequent maintenance, the duration of which depends on the type of fault. Unpredicted downtime can cause loss of production volume, inability to meet critical timelines, and product quality degradation. Vibration research was conducted on a six-die nut manufacturing machine, which experienced frequent faults on the fourth and sixth dies that exerted the greatest impact on the nut material. The application of several analytical techniques on vibration data – the fast Fourier Transform, Empirical Mode Decomposition, Multiscale Entropy, Shock Response Spectrum, and correlation – enabled the identification of fault indicators, which would be useful for predictive maintenance. These features were detectable up to 8 h 28 min and up to 1 h 9 min prior to failure or deterioration resulting from severe and regular damage, respectively. Faults included quality deterioration and die and non-die breakage, fusion, bending and cracking. This research can optimise machine efficiency through timely upkeep facilitated by predictive maintenance.
Keywords
Introduction
The usefulness of nut and bolt fasteners in securely joining separate parts together has benefitted users ranging from an everyday consumer to more specialised, highly technical beneficiaries such as the mechanical and aerospace industries.1,2 For Taiwan, the nut industry is economically important. With the recent reopening of trading borders after the COVID lockdown, over 75% of nut production was exported in 2021. 3 To produce the volume and quality of nuts to meet industrial demand, equipment require adequate maintenance to remain in good condition.
The more common maintenance norm for these machines is ‘run-to-failure’ (RTF),4–6 with maintenance performed after machine failure. As a consequence, product quality cannot be ensured, and machine downtime and repair requirements may sharply increase if a failure causes multiple failures in associated processing components. To remedy this, the fastener industry has resorted to a form of ‘condition monitoring’7–9 where product samples are tested at periodic intervals to ensure dimensions are within the accepted tolerance, 10 and equipment maintenance is done at predetermined times. Inherent to this approach is the margin of error that allows unsampled batches of poor-quality products to slip through undetected, the ‘domino’ risk of cascading multiple parts’ failures and faults occurring between maintenance periods.
Research to improve manufacturing efficiency and product quality has analysed several aspects of the production cycle. One approach was to improve the quality of the raw material by treating it before 11 and after the fastener was manufactured.12,13 Work was done on enhancing tool die materials by adding carbon fibre, as shown by Yurtdas et al. 14 Other studies investigated shrink fit interference on the die to improve its design, enhancing die service life. 15 A finite element approach identified areas of the dies experiencing adhesive wear by applying stress levels to simulate wear. 16 A different approach using fault tree analysis identified when failure occurred within the manufacturing stage and proposed a change in the die design to reduce defects in the final nut part. 17 In recent years, artificial intelligence (AI) image recognition technology was developed to optically inspect samples of finished products to confirm if their measurements were within the required dimensional specifications.18,19 The most recent study was on a screw-forming machine in which the forging force was recorded in real-time, and kinetic analysis was done to identify error values that would trigger machine stoppage to check for mould damage. 20 The studies so far have not advanced condition monitoring of fastener manufacturing, save for the AI paper 19 in which the disadvantage remained that defects were identified after the product had already been manufactured making it not a predictive approach but a monitoring technique. In Cheng’s 20 study, real-time monitoring of the forging force identified error values that were related to the surface mould damage which could occur after die and other non-die damage had already affected product quality.
In summary, the aforementioned studies have focused mostly on pre and post manufacturing methods to improve fasteners by monitoring of the manufacturing process, not the prediction of the failure of the die. This paper intends to explore the use of vibration analysis to monitor the operating condition of a six-die nut manufacturing machine and detect fault indicators in sufficient time to facilitate predictive maintenance in order to contain or minimise damage that will compromise production volume and quality.
Vibration analysis was chosen over other methods because of its success in fault detection during equipment operation, albeit that success was mostly with rotational devices. A machine’s vibrations are dynamic, reflecting changes in its health condition arising from normal wear 21 and other faults. The use of appropriate vibration analytical techniques can filter out and identify the anomalies indicative of developing faults, such as misalignments and wear, within the vibration signal and facilitate an effective ‘as needed maintenance’ approach. Bunks et al. 22 determined gearbox defects using Hidden Markov Models via vibration spectra. Defects were detected in rolling element bearings by using the fast Fourier Transform (FFT) to predict maintenance. 23 Huang et al. 24 reported that the Empirical Mode Decomposition (EMD) produced intrinsic mode functions (IMFs), which yielded instantaneous frequencies and functions of times that facilitated the identification of imbedded structures. Yang and An 25 used the EMD technique to diagnose faults in a wind turbine gear box. Valles-Novo et al. 26 used IMFs to detect a broken and half-broken rotor bar for squirrel cage induction motors. Another study used the EMD to filter noise from chatter vibration on a computer numerical controlled trainer lathe to output a chatter index which would create a stable machining zone for material removing processes. 27 Hussain and Gabbar 28 identified four categories of faults grouped according to severity levels after filtering, finetuning and then subjecting the resulting vibration analysis to the shock response spectrum (SRS). The SRS analyses the severity of a vibration shock on a system and is more widely known for its seismic application. Vibration signals can also be analysed using the Multiscale Entropy (MSE) technique, which measures the entropy within a system to determine its health. Hong et al. 29 detected abnormalities of voltage in lithium-ion batteries 1 h prior to failure with the MSE technique.
This study was done under an academic collaboration agreement with a highly quality-conscious nut manufacturing company, so successful results should be feasible for application under commercial working conditions. Successful results, from a quality perspective, mean that the analytical technique should be able to identify the more commonly occurring faults – quality deterioration, die damage and auxiliary non-die component damage. The predictive maintenance enabled by effective condition monitoring will optimise the use of existing nut manufacturing equipment and allow best-capacity, quality production at least cost. Due to the lack of literature on vibration analysis to monitor the condition of an impact deformation manufacturing machine, this paper will test the efficacy of the FFT, the EMD, the MSE and the SRS in detecting fault indicators from vibration data collected from a six-die nut manufacturing machine in commercial operation.
Nut manufacturing machine and data acquisition
Nut fasteners are produced by a series of deformations caused by increasing die impact forces based on the hardness of the raw material and the complexity of its design. 30 In this equipment, the fourth and sixth dies experience more frequent faults and replacements as they exert the largest forces on the workpiece to remove the centre where the threading will be formed. Damage to the die, such as cracks or bending, affect product quality and may result in collateral machine damage requiring considerable maintenance downtime. Damage to non-die components, such as the forks, sleeves and moulds, negatively affect the proper operation of the die and lead to machine failure as well. Due to the manufacturer’s focus on quality, maintenance is scheduled on this six-die nut manufacturing machine after a certain number of batches are manufactured to ensure a consistently, high-quality product. Machine maintenance includes die replacement due to regular wear, quality adjustments and fault repairs such as breakage, bending, cracking, twisting and fusion of dies and non-die components. Due to the emphasis on quality, dies are often replaced even though wear is negligible. This overly cautious approach requires a very sensitive analytical technique to capture anomalies indicative of fault occurrences. The detection of these fault indicators that forebode an impending failure or deterioration in machine performance would be useful to optimise production and resource allocation as well as help to maintain consistent quality standards by enabling timely maintenance.
To study the fourth (4P) and sixth (9P) die fault features, vibration data were captured from PCB Piezotronics ICP® accelerometers – specifications are in Table 1– attached to the bottom of the die moulds (shown in Figure 1). The two accelerometers were mounted on the moulds close to the two most frequently damaged dies. Given the lack of information on the frequency range within which this machine’s fault features can be found, the vibration sampling frequency was set at 50,000 Hz, since tribologically induced damage often occurs at high frequencies. 31 The accelerometers were connected via a PCB Piezotronics 508BR030AC wire, specifically chosen to withstand the high temperatures and lubrication conditions of the nut manufacturing machine, to an IMC CRONOSflex data acquisition system (DAQ) – specifications in Table 1– as digital and analogue signals were recorded simultaneously. The DAQ transferred the data to a storage device, after which it was imported into Visual Signal, a signal analysis software. In addition, a record of the time and description of each maintenance was kept in a daily log.
Accelerometer and DAQ specifications.


Schematic for data acquisition.
To allow machine operation to stabilise, data collection began 10 min after machine start-up, either at the beginning of the manufacturing day or after maintenance was done during the day. While data was collected continuously, the datum on one impact was selected initially every 30 min for analytical purposes. Closer to the maintenance periods, the impact data was selected every 5–10 min to capture the gradual deterioration of the machine components resulting from 4P, 5P (fifth die), or 9P die defects, quality adjustments, or other damage. The more commonly used FFT, EMD, MSE, and SRS techniques were assessed on their usefulness in detecting the more common fault indicators and in predicting maintenance to contain or minimise damage to the nut manufacturing machine.
Analytical techniques
Several analytical techniques used for fault detection in vibration analysis of rotating machinery were performed to isolate the particular frequencies that may contain the impending faults’ indicators, since the constant motion of the six dies produced simultaneous impacts and considerable random noise. Deviations sustained for a minimum of 15 min outside the empirically-determined health thresholds were considered fault indicators. Health thresholds, which were determinable, were consistent over a 1-month period.
Fast Fourier transform
The fast Fourier Transform (FFT) is usually the first analysis conducted as it converts the vibration signal from the time domain to the frequency domain. The FFT equation is written as 32 :

Where
Empirical mode decomposition
The Empirical Mode Decomposition (EMD) decomposes an acquired signal, while remaining in the time domain, into several components – Intrinsic Mode Functions (IMFs) and a residual – which when recombined returns the original signal without loss of information. 33 The IMFs, distinguishable by frequency ranges, facilitate the detection of fault features within each frequency function. Over time, the IMFs with the desired fault characteristics would be identified and those containing noise or irrelevant data would be filtered out.
Yang and An 25 stated that the EMD algorithm producing the IMFs was represented as:

Where
Multiscale entropy
Entropy can be viewed either as a measure of the disorder or as the evenness of energy distribution within a system. The equation for sample entropy is given by 34 :

Where
Shock response spectrum
The shock response spectrum (SRS) is a graphical representation of the response by a Single Degree of Freedom (SDOF) system to a shock defined as a transient acceleration input. The x-axis of the graph is the natural frequency of the SDOF, while the y-axis gives the peak acceleration achieved by the system from the shock input. The SRS calculation is elaborated by Tuma and Koci 36 and the open-source code from Irvine. 37 Sun et al. 38 explained the Laplace transform of the transfer function relating the acceleration response to the acceleration input as:

Where
Correlation
While the nut manufacturing machine operation is repetitive, relatively minimal die deterioration and non-die changes can affect nut quality and the smooth functioning of the machine components. Hence, correlation was seen as a potentially successful analytical tool to detect the initiation of changes resulting from fault impairments, including impending equipment failure due to the repetitive impacts. Correlation compares sets of data against a standard normal performance data set – data reflecting the functioning of the machine in good condition. The first data set, either at the start of the day or after maintenance, is assumed to reflect the system in its best health condition relative to subsequent operations until machine stoppage. After each machine start-up, the best health correlation standard changes, which maintains the relevance of correlation tests, because the machine’s condition changes with each part replacement and other repairs. Deviations from the ‘best health condition’ are assumed to be due to fault occurrences.
Results and discussion
The typical vibration of one cycle of the six-die nut manufacturing machine is shown in Figure 2. The cycle shows two reciprocating movements – the movement of raw material from one mould to the other and the dies’ repositioning and the die impact on the raw material with the latter having the largest amplitudes. The analyses focused on identifying anomalous pulses within the die impact vibrations associated with any impairment in the healthy condition/operation of the machine. The analytical procedures used on the impact vibrations of 4P and 9P to identify fault indicators are shown in Figure 3.

Vibration profiles of one complete cycle at 9:10 a.m. of (a) 4P and (b) 9P.

Analytical procedures.
Given that maintenance is conducted on a programmed basis, the study examined vibration data for periods prior to scheduled and unplanned maintenance, as indicated in Table 2, in the attempt to identify fault features indicative of normal wear, other damage and quality deterioration.
Maintenance record for February 24–25 and March 9.

Fast Fourier transform (FFT)
The die impact frequencies of the nut manufacturing machine were isolated between 2000 and 6000 Hz, as shown in Figure 4, since frequencies above had very small magnitudes and were related to ambient surroundings, and those below were mostly unrelated to tribological-induced damage. The average magnitudes of the FFT values from this range were calculated for both dies to facilitate identification of notable fluctuations in the mean strength of the frequencies prior to maintenance. Significant deviations from the mean trend indicate abnormalities caused by fault occurrences.

Typical frequency profile of 4P die.
Results for February 24–25 are shown in Figure 5. On February 24, 4P and 9P dies were changed before operations began and therefore were in good condition. Nine minutes before the screw responsible for tolerance dimensions was tightened, the average FFT magnitudes of 4P and 9P declined due to the loosened moulds as shown at ‘A’. At 02:58, collision severely damaged the fourth clamp, fifth clamp, and fifth mould. Importantly, the 1P, 4P, 5P, and 9P dies were changed even though wear was very minimal. Such a cautious maintenance stance reflected the high emphasis placed on quality. Consistently lower average FFT magnitudes at 00:30 for 4P were sustained for 2 h 28 min prior to collision of non-die parts. A sharp fluctuation at ‘B’ occurred for 9P some 5 h 58 min before machine failure and was followed by consistently lower values sustained for 45 min from 01:00.

February 24–25 average FFT magnitude from 2000 to 6000 Hz for (a) 4P and (b) 9P.
Results for March 9 are shown in Figure 6. The dies’ failures on March 9 at 19:51 were linked to distinct decreases in the average FFT magnitudes of 4P and 9P, which occurred just 16 min before their failures. With severe damage, the magnitudes of the frequencies change due to the changing impact forces of the die on the nut and damage inflicted on the die’s internal structure.

March 9 average FFT magnitude from 2000 to 6000 Hz for (a) 4P and (b) 9P.
As a preliminary analysis, the average FFT magnitude was more effective in showing distinctively substantial fluctuations in the case of severe die damage but at a time-to-failure too short to prevent serious damage compared to its performance in detecting less severe faults, quality changes and eventual damage to non-die components, as shown in Figure 5.
Average FFT of the empirical mode decomposition (EMD)
The FFT, with its wide frequency range, indicated the need to further the frequency analysis by performing an additional set of techniques to enable the empirical determination of reliable health thresholds via averaging and the EMD analysis, which partitioned the impact frequency range into its smaller component ranges, thereby reducing random noise. The EMD decomposed the vibration data into its IMFs and residual components, which enabled identification of the IMFs showing fault features useful for predictive maintenance, as the technique was more sensitive to deteriorating conditions and, therefore, allowed the discovery of reliable health thresholds. The FFT was then performed on the IMFs, after which the average FFT magnitude of the frequency distribution was calculated. The main frequency distribution ranges for IMFs 1 through to 4 are as follows: 5000–8000 Hz, 4000–5000 Hz, 2000–4000 Hz, and 0–2000 Hz. Consistent and reliable health ranges were empirically determined, which were specific for each IMF and die. The upper threshold (UT) and lower threshold (LT) for each health range are given in Figures 7 and 8. Deviations occurring outside the health thresholds sustained for a minimum of 15 min are indicators of faults affecting dies and machine normal operations.

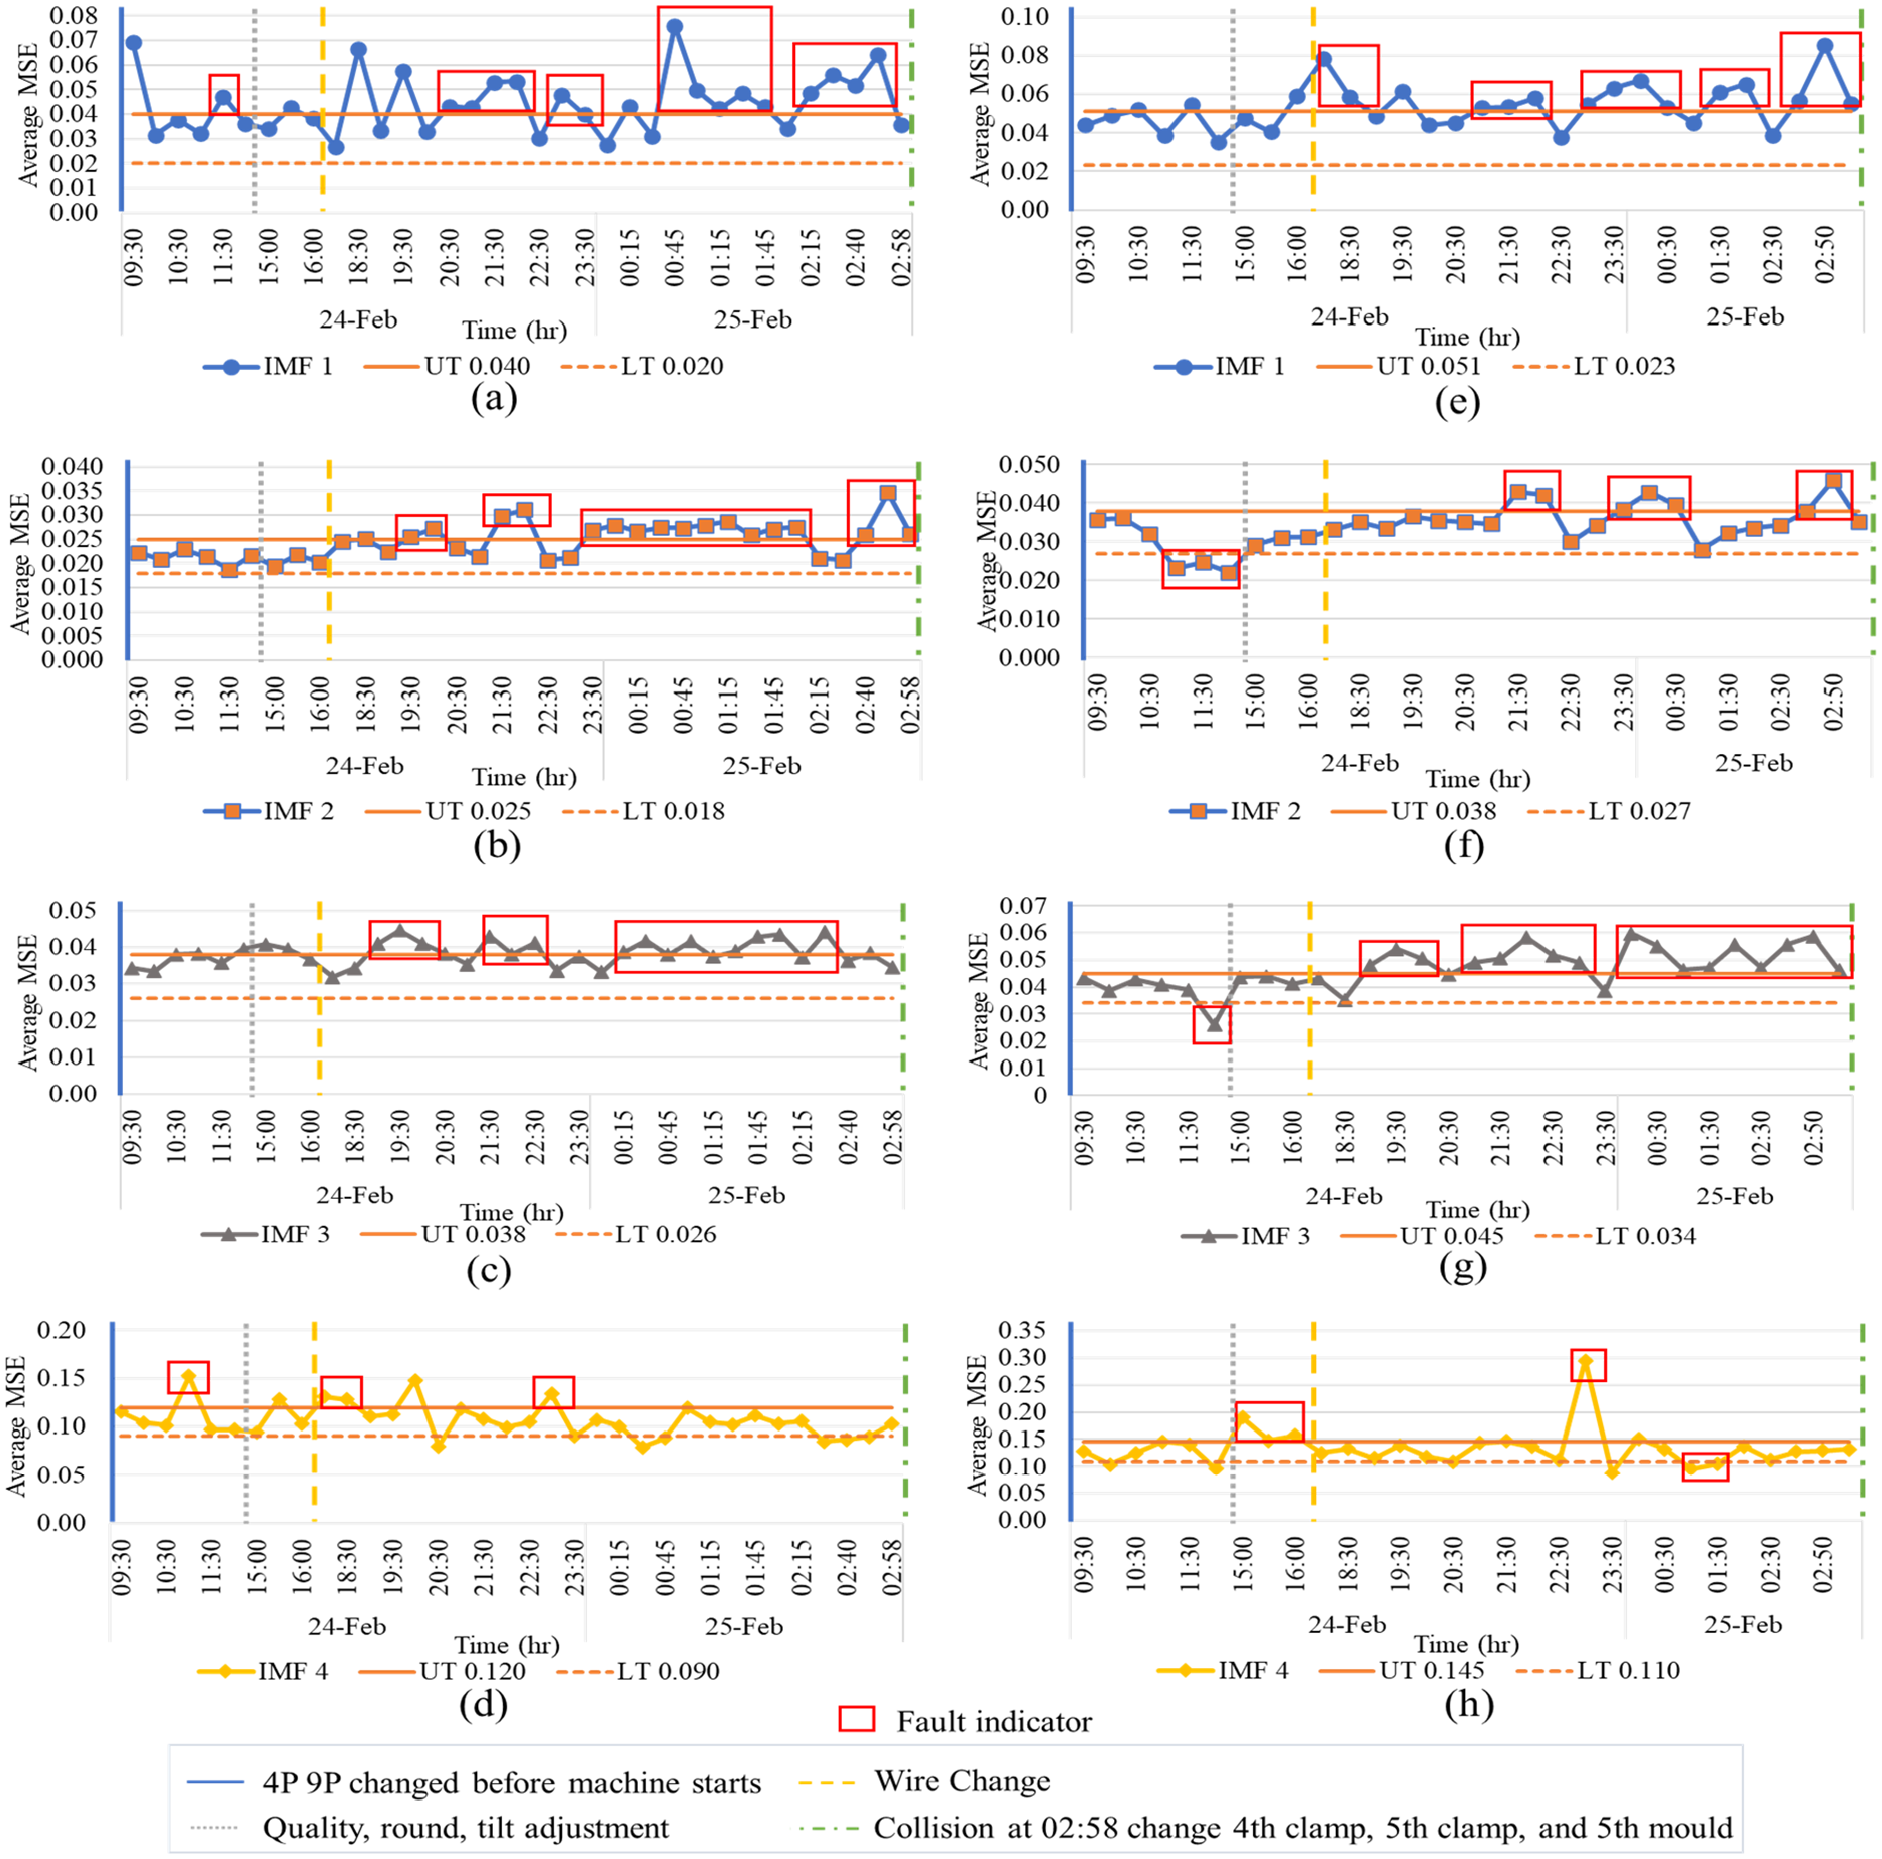
February 24–25 average FFT magnitude for 4P of (a) IMF 1, (b) IMF 2, (c) IMF 3, (d) IMF 4 and for 9P of (e) IMF 1, (f) IMF 2, (g) IMF 3, and (h) IMF 4.

March 9 average FFT magnitude for 4P of (a) IMF 1, (b) IMF 2, (c) IMF 3, (d) IMF 4 and for 9P of (e) IMF 1, (f) IMF 2, (g) IMF 3, and (h) IMF 4.
As shown in Figure 7, on February 24–25, all IMFs of 9P as well as IMF 2 and IMF 4 of 4P provided indicators of quality deterioration. The longest warning period of 2 h 9 min was given by IMF 2 of 9P. Warning periods of 1 h 39 min were given by IMF 3 and IMF 4 of 9P, while IMF 2 of 4P provided an alert of 1 h 9 min. The shortest notification periods of 39 min and of 9 min were given by IMF 1 of 9P and IMF 4 of 4P, respectively. The degradation and eventual collision of non-die components could be detected in all IMFs of 4P and 9P after the wire change. Excluding IMF 2 of 4P, each IMF had the fault indication repeated at different time periods to mark the progression of damage until final collision. IMF 3 of 4P had fault indicators occurring between 8 h 58 min and 58 min before machine failure. The prior warning period of IMF 3 of 9P spanned 8 h 28 min to 18 min, while the fault notification period for IMF 1 of 9P ran from 7 h 58 min to 18 min. Except for a solitary indicator at 6 h 28 min before collision given by IMF 2 of 4P, the warning period for all other IMFs started approximately at 3 h to failure.
For March 9, shown in Figure 8, fault indicators of the impending 4P and 5P failures at 19:51 were evident in all IMFs. Except for IMF 2 of 4P, each IMF had repeated fault indications, which provided ample time-to-failure warnings to effect timely repairs. For 4P, IMF 1 indicators occurred between 4 h 51 min and 21 min before die failures. Likewise, the alert period of IMF 3 ran from 4 h 21 min to 51 min. IMF 4 had prior warnings that started at 2 h 25 min and ended at 51 min, with the final alert given by IMF 2 at 16 min. For the 9P data, IMF 1 had the earliest time-to-failure of 6 h 51 min with several other alerts occurring up to 16 min before machine breakdown. On the other hand, IMF 2, IMF 3, and IMF 4 had the first of repeated fault indicators appearing at 4 h 21 min prior to die failures. The earliest signs of vibration anomalies with sustained deviation times came from IMF 1 and IMF 3 of both 4P and 9P.
The EMD methodology allowed the development of reliable empirical health ranges for each die and IMF that were consistent over a one-month period. The decomposition of the signal into its IMFs, which underwent additional transformation with the FFT, reduced random noise and enabled the identification of faults commonly affecting nut production relating to quality, dies and non-die components. Indicators of die and non-die faults were detected well in advance to effect timely maintenance. While the warning period for quality issues was much shorter, it still permitted adjustments to be done in a timely manner. This technique is acceptable for quality-conscious manufacturers.
Multiscale Entropy (MSE) on EMD
The MSE was performed on the IMFs, which were known to contain fault characteristics and which were obtained from the EMD of the vibration data. The MSE was calculated with m = 2, r = 0.15, and scale = 25, which were the best parameters for the 4P and 9P accelerometer data. The average MSE values of the selected IMFs were plotted over time, with fault indicators identifiable by the notable fluctuations outside the health ranges. Health ranges were identified empirically for each die and IMF, as shown in Figures 9 and 10. Deviations sustained for a minimum of 15 min outside of the health thresholds are indicators of faults affecting dies and machine normal operations.
February 24–25 IMF’s average MSE value for 4P of (a) IMF 1, (b) IMF 2, (c) IMF 3, (d) IMF 4 and for 9P of (e) IMF 1, (f) IMF 2, (g) IMF 3, and (h) IMF 4.

March 9 IMF’s average MSE value for 4P of (a) IMF 1, (b) IMF 2, (c) IMF 3, (d) IMF 4 and for 9P of (e) IMF 1, (f) IMF 2, (g) IMF 3, and (h) IMF 4.
Results for February 24–25 are shown in Figure 9. Data gathered from 4P captured damage to the fourth clamp, whereas that from 9P captured damage to the fifth clamp and fifth mould. In the detection of quality deterioration, IMF 1 and IMF 4 of 4P gave prior indications of 39 min and 1 h 9 min, respectively, whereas IMF 2 and IMF 3 of 9P gave prior warnings of 1 h 9 min and 9 min, respectively. Faults affecting non-die components were clearly detectable in IMF 1, IMF 2, and IMF 3 of 4P and 9P. After the wire change, these IMFs provided repeated sustained indicators of increasing damage severity that began prior to unplanned maintenance for IMF 1 of 9P at 8 h 58 min, for IMF 3 of 4P and 9P at 7 h 58 min, for IMF 2 of 4P at 7 h 28 min, for IMF 1 of 4P at 6 h 28 min and for IMF 2 of 9P at 5 h 28 min. All three IMFs of 4P and 9P provided sufficient notice of impending non-die damage for timely maintenance to be conducted.
For March 9, in Figure 10, all IMFs of 4P and 9P displayed instability throughout the day. IMF 3 and IMF 4 of 4P and 9P provided the earliest and most notable repeated signs of die faults. For 4P, IMF 4 indicated initial damage to 4P at 5 h 51 min with two additional alerts before failure. IMF 3 provided timely die fault alerts at 4 h 21 min and at 1 h 51 min prior to 4P breakage. The earliest warning period for IMF 1 of 4P was at 1 h 21 min with two other fault indicators occurring less than half hour before failure. In the case of 9P, the average MSE fluctuated outside the health threshold at 6 h 51 min in IMF 4 and at 4 h 51 min in IMF 3 prior to 5P fusion. IMF 1 and IMF 2 provided fault indicators less than half an hour before 5P fusion.
The average MSE of each IMF allowed the establishment of consistent and reliable empirical health ranges, which were specific for each IMF and die. IMFs 1 through to 3 for both dies provided clear, repeated indicators of non-die component faults. IMF 4 of 4P and 9P only indicated die damage. While all IMFs of 4P and 9P showed die damage, the most useful and timely indicators occurred in IMF 3 and IMF 4 for both dies. Quality issues were detectable in IMF 1 and IMF 4 of 4P and IMF2 and IMF 3 of 9P.
Correlation analysis was performed on the MSE profiles to determine if normal wear of the dies and quality deterioration over time were more easily detectable. A health range was empirically established for each die and IMF. The UT was 1, representing perfect correlation with the ‘best condition’ profile. Deviations sustained for 15 min below the lower health threshold, which was specific for each IMF and die, would indicate faults or quality deterioration causing sub-optimal die and machine operation. The LTs for 4P and 9P are shown in Figures 11 and 12.

February 24–25 MSE profile correlation to period after maintenance for 4P of (a) IMF 1, (b) IMF 2, (c) IMF 3, (d) IMF 4 and for 9P of (e) IMF 1, (f) IMF 2, (g) IMF 3 and (h) IMF 4.

March 9 MSE profile correlation for 4P of (a) IMF 1, (b) IMF 2, (c) IMF 3, (d) IMF 4 and for 9P of (e) IMF 1, (f) IMF 2,(g) IMF 3 and (h) IMF 4.
On February 24–25 in Figure 11, all IMFs of 4P indicated the need for quality adjustments, as reduced die impact on the nut caused a fall in entropy. All 4P IMFs gave prior warning of 39 min except IMF 2, which gave a 9 min time-to-failure. The need for a new spool of material was only detectable by IMF 1 and IMF 2, which indicated sub-optimal machine condition 52 min prior to the raw material change. For the 02:58 collision, IMF 2 and IMF 3 indicated fault occurrences at 20:30 – 6 h 28 min prior to non-die collision – and at two more repeated fault indications. None of the 9P IMFs showed quality related or wire change issues. However, all 9P IMFs successfully indicated the non-die faults that eventually caused machine failure at 02:58. At 18:30 – time-to-failure of 8 h 28 min – IMF 1 deviated into the faulty condition zone and remained in this sub-optimal condition for most of the time until the collision of non-die components. IMF 4 provided repeated fault indications that started at 7 h 58 min before collision. IMF 2 and IMF 3 remained below the LT as of 23:30 – 3 h 28 min before failure.
On March 9 in Figure 12, all MSE profile correlation results for 4P and 9P, except IMF 4 of 9P, distinctively deviated below the health threshold over time as the increased fracturing of the 4P die resonated throughout the IMF frequencies. The earliest time-to-failure of die damage – 8 h 21 min – was provided by IMF 1 and IMF 3 of 4P and by IMF 1 and IMF 2 of 9P. IMF 2 of 4P correlation continuously indicated faulty die condition for 7 h 51 min before die failures. All IMFs showing die faults, except IMF 2 of 4P, had indicators at repeated time intervals prior to 4P breakage and 5P fusion.
The MSE profile correlation allowed the establishment of consistent and reliable empirical health ranges. All IMFs of 4P enabled detection of quality issues. All IMFs of 9P and only IMF 2 and IMF 3 of 4P provided indicators of non-die component fault occurrences. All IMFs of 4P and 9P, except IMF 4 of 9P, provided clear, repeated indicators of die damage. Evidence of quality issues, non-die faults and die faults were detectable sufficiently in advance to facilitate timely maintenance.
Shock response spectrum (SRS)
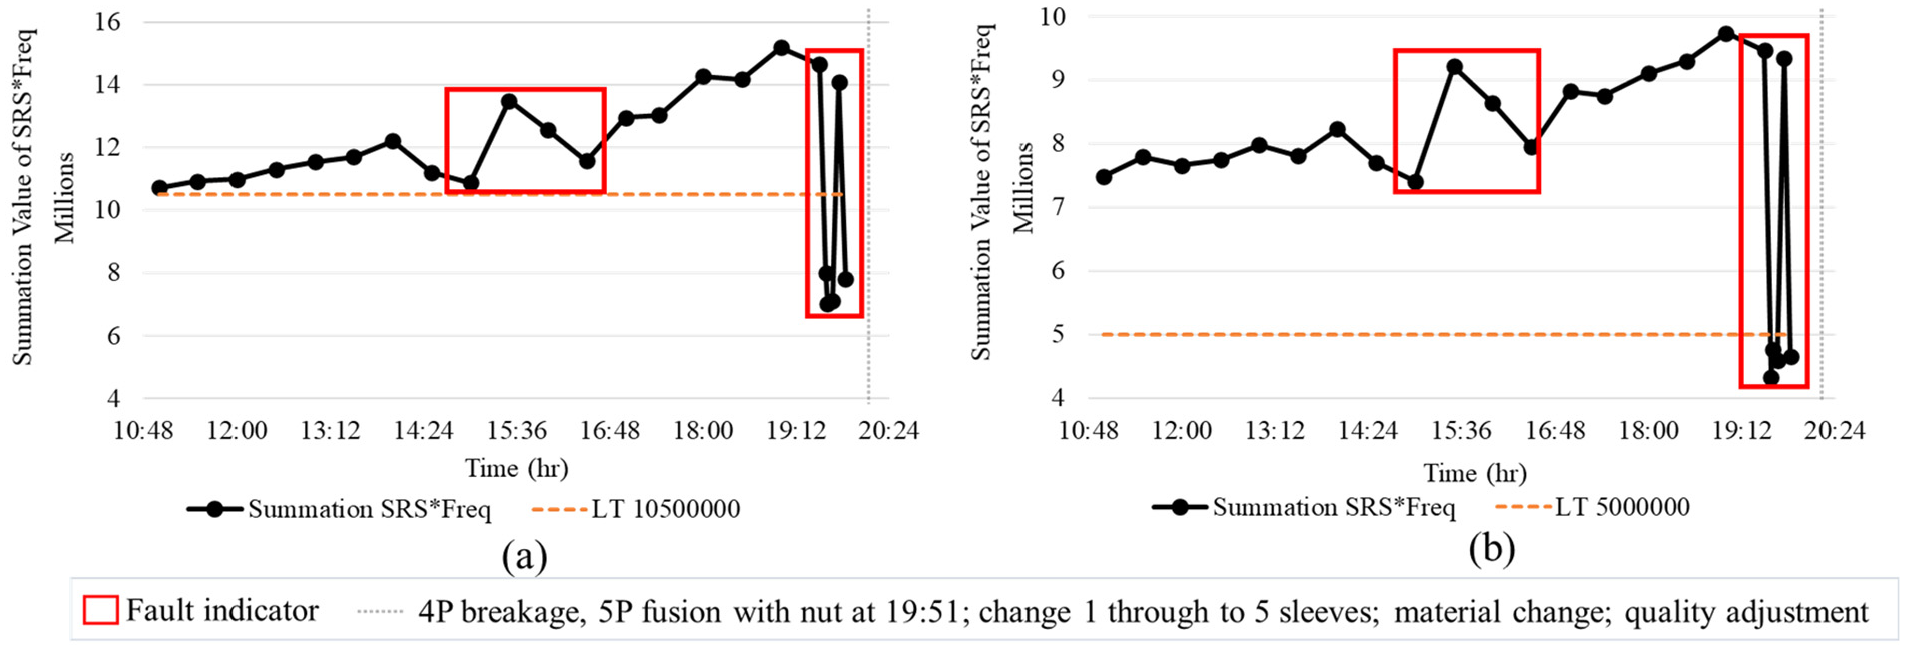
The summation of the values of the SRS times the frequency was calculated to determine the cumulative impact energy response of the system. The LTs were empirically established as 10.5 million and 5.0 million for 4P and 9P, respectively. The period, February 24–25, is shown in Figure 13. Nearing quality adjustment at 12:00 for both 4P and 9P, the SRS values increased due to the forks’ shifting. Eventual damage, which occurred at 02:58, to the fourth clamp of the 4P die was preceded by a declining trend that started 7 h 58 min earlier. For 9P, the system also displayed an unsteadily decreasing energy response behaviour after the wire change until machine failure caused by non-die components. However, there was no clear delineation to distinguish faulty from fault-free condition when damage resulted from non-die components and quality related changes. These types of faults occurred within the established health range. As the values are a reflection of the system’s cumulative impact energy response, it is difficult to identify small frequency changes due to non-die auxiliary components.

February 24–25 Summation of SRS*Freq for (a) 4P and (b) 9P.
On March 9, with severe unplanned maintenance, the system energy of 4P and 9P in Figure 14 spiked at 15:00, some 4 h 51 min prior to unplanned maintenance. The system’s impact energy steadily increased thereafter until an abrupt decline below the health threshold occurred approximately 16 min prior to die failures at 19:35. The first period of instability, which occurred within the health threshold, likely corresponded to damage initiation that culminated in 4P breakage and 5P fusion with the nut. This SRS technique detected die damage due to die frequencies changing significantly with the loss of impact transmission from the die to the material.
March 9 Summation of SRS × Freq with very severe damage indications for (a) 4P and (b) 9P.
Although a threshold for die damage was developed, the summation of the system energy was unable to detect the relatively smaller changes caused by quality adjustments. Hence, correlation of the SRS profiles was performed to test if faults within the dies or other components would cause deviations from the ‘best health’ condition, since the die’s shock impact on the nut would change with the progression of damage. An empirical health range for the SRS profile correlation was established. The UT was 1 – perfect correlation – and the LT was 0.975 for both 4P and 9P. Deviations sustained for more than 15 min below the LT were fault indicators.
On February 24–25 shown in Figure 15, 4P and 9P’s SRS profile correlation values decreased 39 min prior to the quality adjustment, while still being within the health threshold range. Deviations were more evident after the wire change. Both dies experienced an initial deviation 5 h 28 min prior to unplanned maintenance followed by two more areas of instability signifying increased damage. Those for 4P had a larger deviation as the fourth clamp was damaged. The 9P data showed deviations resulting from less direct vibrational changes linked to the fifth clamp and fifth mould damages.

February 24–25 SRS profile maintenance correlation (a) 4P and (b) 9P.
On March 9, the correlation for 4P deviated significantly 4 h 14 min prior to die failures, as shown in Figure 16. Another fault indicator became evident at 1 h 51 min before failure. During this period, damage spread throughout the die structures and the sleeves until 4P breakage and 5P fusion. The SRS profile correlation approach facilitated the identification of fault indicators as the health deterioration was reflected in the shock delivered to the workpiece. It delineated die damage as well as non-die damage, which the summation of the system energy approach was unable to reliably do. Furthermore, the alert time to machine failure provided a feasible period within which to address and contain damage in contrast to the energy summation approach. This correlation could not delineate quality degradation.

March 9 SRS profile maintenance correlation for (a) 4P and (b) 9P.
Conclusion
In this research, vibration analysis was tested to determine its usefulness in identifying the fault occurrences of a commercially operated six-die nut manufacturing machine, which performed forced surface impact deformations to produce nuts. Various analytical techniques were used to assess which was effective in identifying the more common faults affecting nut machine operation – namely, quality deterioration and damage to die and non-die components – within a sufficient time period to contain or minimise damage. The major findings are:
Vibration analysis for fault diagnosis can be applied successfully to the nut manufacturing machine, an instantaneous impact machinery.
Health ranges were empirically established for the techniques using the EMD or correlation approaches.
From all techniques, the average FFT of the IMFs and the correlation of the MSE profiles of the IMFs identified all three fault types and yielded the best quality, die and non-die predictive times-to-failure.
While health thresholds are specific to the type of analytical technique, die and nut manufacturing machine, the analytical methodologies are applicable to other nut manufacturing machines to derive their specific health thresholds.
The 4P accelerometer data was more useful for quality adjustment indicators since vibrational changes attributable to alignment shifts were more clearly captured. The 9P accelerometer provided better data on die and non-die damage due to less random noise and interference from other moving components.
As the data was collected from a machine in commercial operation, the research results can be feasibly applied into a real-time monitoring system to monitor the quality, die and non-die health condition to predict and facilitate maintenance as needed. This would optimise production, reduce downtime and repair costs as well as maintain the quality standard of nut production.
Footnotes
Handling Editor: Chenhui Liang
Declaration of conflicting interests
The author(s) declared no potential conflicts of interest with respect to the research, authorship, and/or publication of this article.
Funding
The author(s) received no financial support for the research, authorship, and/or publication of this article.