
Abstract
This text presents an innovation that expands the methodological possibilities of situational analysis (SA), a framework often used to research complex institutions. Our innovation features the use of 3D visualization, a strategy which makes it easier to analyse the self-organizing processes of institutions. In the introductory part of the article, we describe how and for what reasons the successors of A. Strauss transformed Grounded Theory into SA. Our main focus is on the analytical significance of visualization, a central feature of SA methodology. In the second and third parts, we characterize the role of visualization to enhance the understanding of research phenomena using examples from the development of non-Euclidean geometry as well as the well-known A-not-B error research schema. In the next part, we explain in detail the innovation using an example from a three-year research project of ours during which the innovation was established. At the end, we discuss the importance of our innovation against the background of identifying self-organizing processes as well as reducing the amount of so-called dark data.
Keywords
Introduction
Situational Analysis employs a method of visualization by means of so-called cartographic tools – a set of maps: messy, ordered, relational, positional, social worlds/arenas maps (Clarke, 2003, 2005; Clarke & Charmaz, 2014; Clarke, Friesse & Washburn., 2015). In this paper, we introduce an innovation that mines the cartographic tools of Situational Analysis (SA) with the goal of more readily grasping the self-organizational processes of the situations under study.
We take inspiration from the broad epistemological framework of the Embodied Dynamism Approach (EDA) (Shapiro, 2014; Thompson, 2007; Varela et al., 1993) to analyse self-organizational processes (Rockwell, 2005; Thelen & Smith, 1994). This epistemological approach is consistent with the notion of the situation as a means of analysis, as featured in situation analysis.
Since any analysis of an organism or institution is too information-rich to be perfectly represented, during an analytical procedure it is often necessary to use visualizations that can meaningfully display the data in some reduced form, but at the same time track all its important characteristics. Visualization of the data therefore becomes an important part of the analytical procedure. Mapping, although only one of the possible starting points for SA, is essential to the assertions and propositions made in our article.
In the following sections, we (1) explain how and for what reasons grounded theory was transformed into situational analysis along with what role visualization plays in SA during the process of grasping the situation as a unit of analysis as well as during the phases of analysis which follow; (2) use two specific examples to document the ability of visualization to re-frame basic epistemological assumptions; (3) clarify the key role of visualization in the initial phase of analysis; (4) use the specific example of our research on inclusive schools to present 3D mapping as a process which facilitates the exploration of self-organizing processes.
The Role of Visualization: From Grounded Theory to Situational Analysis
The epistemological and methodological approach of situational analysis emerged as an enhancement of Grounded Theory (GT), which was originally conceived as a blend of Interactionism (Blumer, 1969) and positivist assumptions (Glaser, 1978; Glaser & Strauss, 1967). Positivist assumptions lead researchers to assume that a basic social process (Glaser, 1978, pp. 109–113) or core process (Glaser, 2002, p. 26) can be delineated for each phenomenon under study. The description of these crucial processes, including exactly how they will be explored in the analysis, is a key operation by which the researcher is able to properly analyse the phenomenon under scrutiny (Clarke, 2005, pp. 35–36).
Early GT researchers decomposed the phenomenon under study and its environment into codes, defined as the smallest analytical units possible or feasible to work with. These codes were thought to be the building blocks from which the elements of the situation and the relationships between them were derived. These smallest units could therefore be inductively grouped into higher-level analytical units called categories, which could then provide a basic semantic description of the properties of the phenomenon elements and environment. The definitions of these properties as well as intersections among them attempt to encompass all the essential relationships that exist among the categories.
Once they had been defined, the categories could then be classified in an axial coding phase into a predefined, situation-independent logical scheme based on the projected causal conditions which influence the researched phenomena by triggering behavioural strategies that lead to specific consequences. It was assumed that by this formalization the researcher could detect a “core process.” In the last phase of GT – selective coding – the general structure of the codes was intended to help develop a theory that would explain the nature of the phenomenon under investigation.
The entire procedure is based on three positivist assumptions. (1) It is possible to identify the smallest analytical units – codes – independently of preceding theories; (2) It is possible to use induction to categorize codes into meaning clusters, thus forming higher analytical units – categories; (3) There are prior logical schemes that are independent of specific situations and the actors, actants or other components involved. Using these formal structures of thought, researchers are able to employ logical frameworks to assemble the categories into an overall picture that reflects the structure of independent reality. These three assumptions form the core of the representational theory of knowledge that dominated epistemology from the late 17th to the 20th century (Rorty, 1980).
The results of research beginning in the 1990s into cognitive theory, neurobiology, cognitive science, and other areas critical to understanding cognitive performance (Damasio, 2010; Gibbs, 2005; Iacoboni, 2009; Johnson, 2007; Lakoff & Johnson, 1999; Noë, 2004; Rowlands, 2004) have provided a large body of evidence that positivist assumptions themselves do not account for how humans (or other organisms) actually cognize and learn. Above all, the positivist view that reality can be broken down into small units of analysis with no preconceptions is flawed, i.e., some working theory must already be operating in the background of the analysis, even if it is unrecognized or unacknowledged by the “analyst.” Similarly, as C. S. Pierce (1955) had pointed out as early as the 1870s, it is not possible to group codes into categories on the basis of mere induction, since the principle of grouping itself is predetermined by a particular preunderstanding.
Lakoff and Johnson (Lakoff, 1987; Lakoff & Johnson, 1999; Johnson, 2007) further illustrate that abstract concepts have their origins in the way the organism is embedded in its environment. Abstract concepts are the result of the process of generalizing the most successful interactions between an organism and its surroundings. The results of these interactions are embodied in the biological, psychological and social layers of the organism, thus forming the basic outline of the organism’s possible ways of acting. In the same way, the schemas that humans employ in inferential processes are also embodied. If adherents of grounded theory apply a ready-made logical framework (conditions-phenomena-strategies-consequences) in the axial coding phase, they are omitting in advance many relationships and multicausal connections that shape the complexity of the situation under study; they are thus imposing on the situation the “logic” of the most common form of human thinking available to them. Nevertheless, this coding in itself may not, and often does not, correspond to what is actually taking place in a given situation.
Positivist assumptions determine GT principles of analysis in such a way that researchers are often unable to capture the processual nature of the elements of the phenomenon under study (Clarke, 2005, pp. 35–36). One of the original founders of GT, Anselm Strauss (along with a number of his followers) became aware of these implications and increasingly gravitated towards solutions that eventually allowed new independent versions of grounded theory to emerge in the forms of constructivist grounded theory (Constructing Grounded Theory, Charmaz, 2006) and Situational Analysis (Clarke, 2005; Clarke et al., 2015).
SA removes remnants of positivism by changing the overall framework of how data is analysed. It seeks to capture the phenomenon under study in the context of the complex environment in which it occurs. This complex of phenomenon + environment is called a situation. Situational mapping becomes not only the initial step in the co-constitution of the situation, but also a way to more deeply and precisely analyse the situation in all its complexity. For this purpose, SA uses a set of cartographic tools based on a specific way of data visualization mapping.
Adele E. Clarke and others have accounted for this shift by adapting the original grounded theory to the postmodern turn in epistemology (Clarke, 2003; Clarke & Charmaz, 2014; Clarke & Friese, 2007). In many of its parameters, the epistemological change that situational analysis has undergone is consistent with the changes mentioned above in our discussion of the critique of positivist assumptions, culminating in the approach the Embodied Dynamism Approach (EDA). All the starting points important for SA (Interactionism, Foucauldian Discursive Analysis and Actor-Network Theory, dense description) are made consistent with EDA based on the methods’ shared emphasis on the relational and processual nature of reality.
SA understands the situation in a way in which the individual parts and their interrelationships are no longer analysed in isolation from each other. SA seeks to encompass the totality of changing relationships characterized by multicausality and ability to self-organize. The followers of A. Strauss embarked on a journey in which they gradually discarded the remnants of positivism (Corbin & Strauss, 2015) by basing research on a completely abductive process that begins with the creation of messy maps, the constant production of analytical memos, and the interpretation of analytical findings through visualization with other SA maps (Clarke, 2005; Clarke & Charmaz, 2014). In this way, the basic unit of research has become the situation, the boundaries of which are defined by a complexity of mutually constitutive properties that define the temporary boundaries of the situation over a period of time. (Dewey, 1992). In this context, Clarke refers to the gestaltic nature of the situation (2005, pp. 23–24). This quality is central, since it is essential to the multi-causal nature of an analysed reality, and the examination of all the components of this gestalt facilitates the emergence of their self-organizing processes.
Thus, on the one hand, SA seeks a temporary unity through which a part of reality can be epistemologically grasped and analysed as a single situation; on the other hand, this unity is constantly open to change and is therefore not trapped in advance within a preconceived static system of its parts. It is this manifestation of self-organizing processes that causes organisms, like human institutions, to transform themselves and their environment, thus finding a dynamic equilibrium (Damasio, 2018; Rockwell, 2005; Thelen & Smith, 1994; Thompson, 2007).
In our text, we focus primarily on the visualization process in SA. Visualization using SA maps is not the only innovation of SA, yet it is the one that plays a significant role both in its initial epistemic bounding box and in all stages of SA analysis. In our paper, we propose to complement these maps with a spatial map. This innovation allows researchers to analytically encompass a higher level of the mutual co-constitution of the parts of the situation at which self-organizing processes crucial for understanding the specificity of the situation under study can be more easily detected. Since enhanced visualization plays such a key role in our innovation, in the following section we will discuss how it may positively influence the cognitive research process.
Expansion of the Epistemological Horizon through Visualization
Since the quality of life of the human organism depends to a great extent on the sense of sight, visual representations of the world are what most of us use to enter the cognitive process and to engage the processes which follow. We are literally immersed in visual information on a continuous basis. Because visual situations are so extremely rich in information, the perception of all visual representations must reduce reality in some way. Each reduction has its own internal order which can be reflected in the way the situation is represented by other means, e.g., in pictorial, textual or, in our case, graphic form. In the mapping out of situations for analytic purposes, the way of representation further influences the ways of analysing the problem under study.
In the following passage, using two examples we will assess the significance of how a change in visualization can re-frame the very way of thinking. The first instance concerns a visualization that facilitates the emergence of a non-Euclidean conception of space, while the second concerns a visualization that makes it more possible to understand human developmental processes (Figure 1). Example of how the graphical questioning of Euclid’s sixth axiom encouraged the emergence of non-Euclidean geometry.
During the second half of the 19th century, Euclidean geometry was absorbed by the larger, non-Euclidean system as a specific part of it (Bachelard, 1984, pp. 19–42). Nevertheless, for more than two thousand years this specific subsection – Euclidean geometry – has generally been considered as the basis for all geometry. This emphasis on Euclid had consequences in terms of application for other areas of science as well. For example, in a purely Euclidean conception of space, the implications of relativistic physics would be completely incomprehensible (Bachelard, 1984, pp. 43–60).
Among other mathematicians, Bachelard mentions Taurinus, who also observed that “great circles on a sphere have properties quite similar to those of lines in a plane, except for the property in Euclid’s sixth postulate, namely that two lines can never enclose a space” (p. 23). The moment is was possible to imagine a plane as the surface of a sphere, it suddenly became easier to imagine how lines could enclose a space. By changing the representation itself, new relationships emerged that might enter the observer’s consciousness. This shift eventually led to the formulation of non-Euclidean theories.
Figure 2 depicts a landscape symbolizing the actions of a child searching for a hidden toy as featured in well-known A-not-B psychology experiment (Spencer et al., 2001; Spencer et al., 2011). The design of the experiment can be described thusly: The child watches a tantalizing toy and notices the place where the toy is being hidden. By reaching out in the direction where the toy “disappeared,” the child shows that he understands the cognitive relationship between the toy and the place where it was hidden during the experiment. First, the toy is hidden at location A multiple times, and after several repetitions it is hidden at location B. At this stage of the experiment, most 8- to 10-month-olds fail to identify the correct location (B), and they search for the toy in the original location (A). Around twelve months, most babies are able to more readily identify the new, correct place. Example of the A-not-B error experiment – retrieved from Smith and Thelen (2003).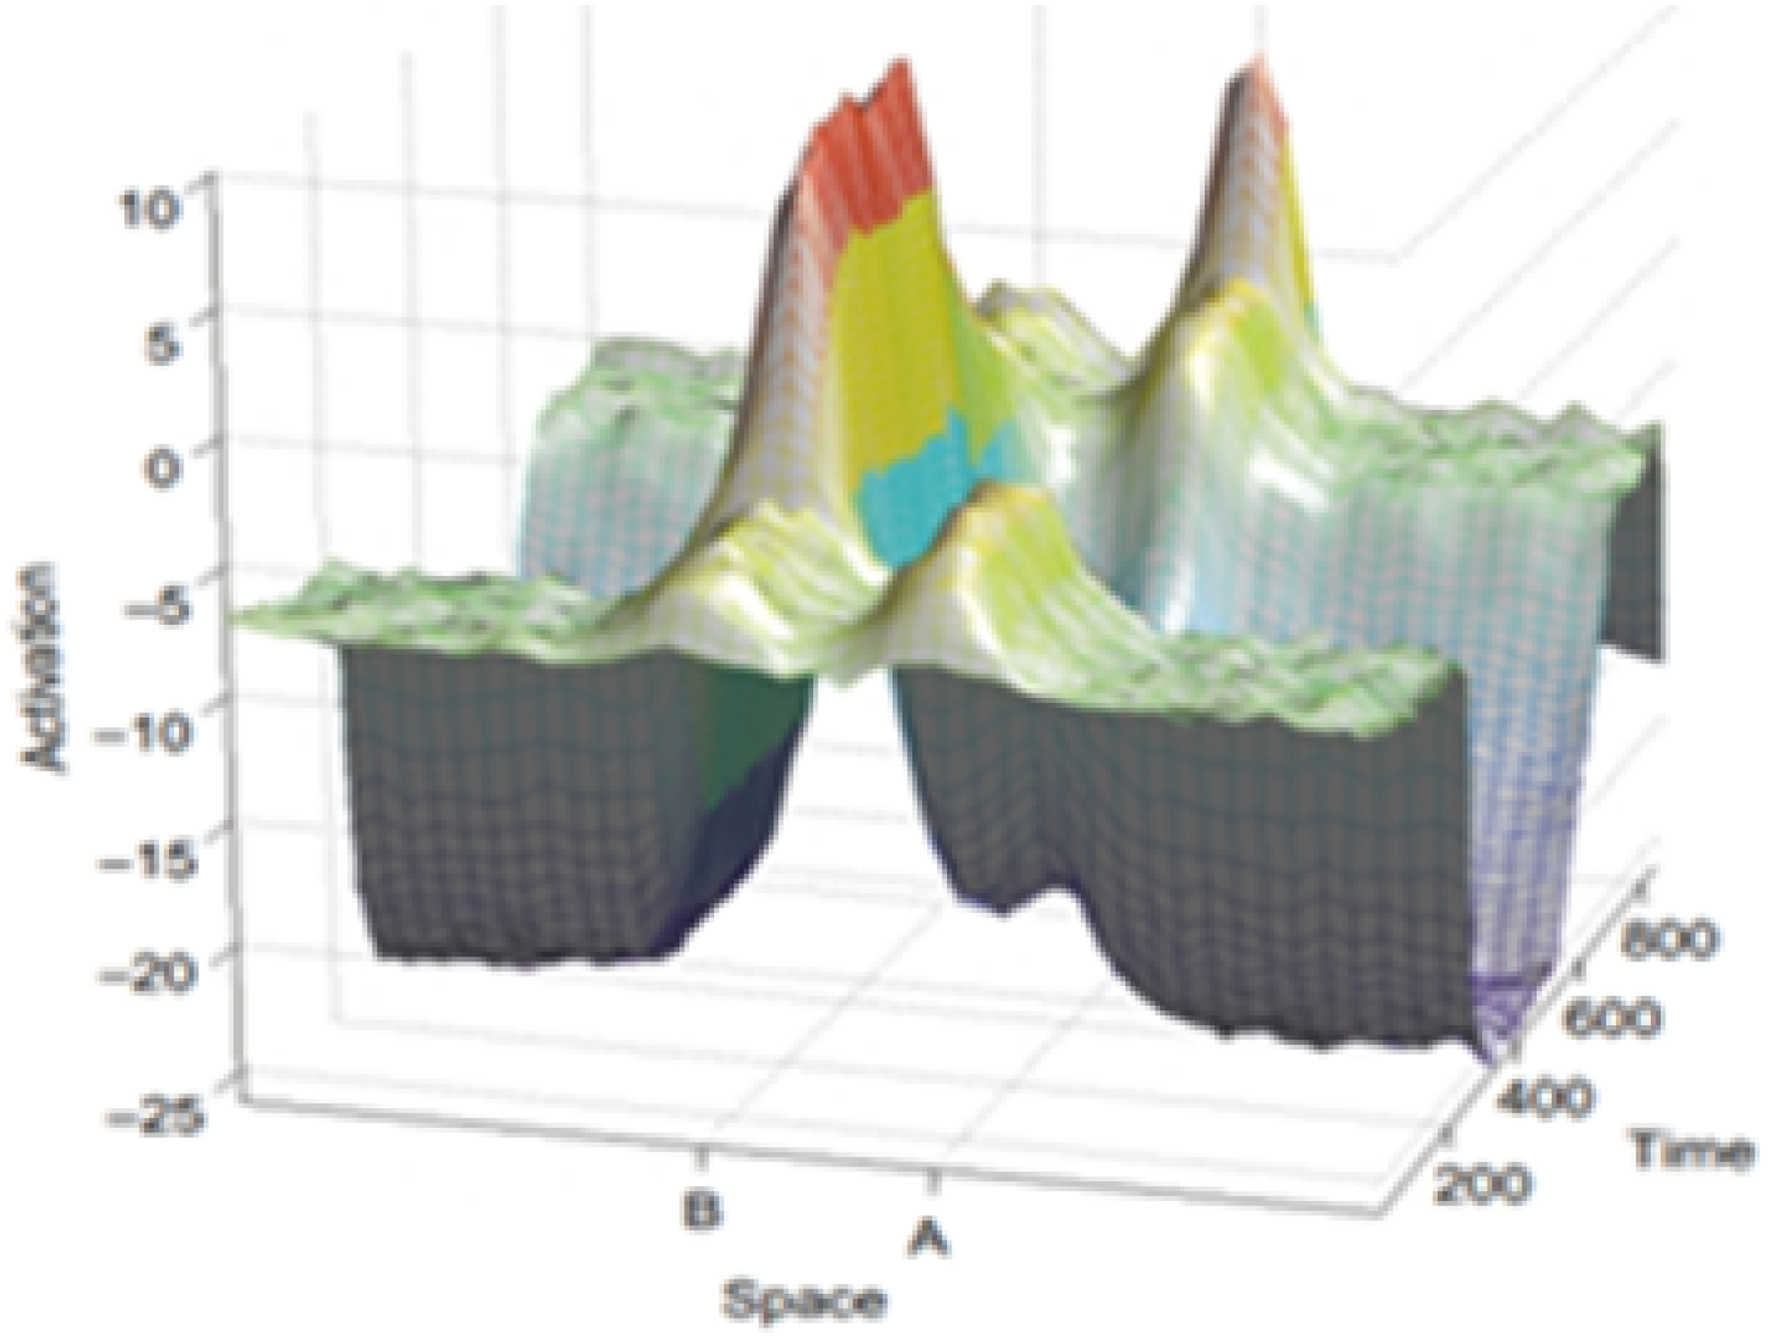
The visualization makes it possible to understand processes of acquiring behavioural patterns as processes in a vector field in which a child is attracted to certain behavioural patterns (attractors) or repelled from them (repellors), depending on whether or not there is a synergy of interacting impulses. The raised hills and mountain peaks here express “[a] highly activated point [s]” which “will have a strong inhibitory effect on points in its vicinity, allowing activation to be maintained even in the absence of external inputs.” (Smith & Thelen, 2003, p. 345). When a certain degree of synergy is reached, which is manifested in the representation by “highly activated points,” the child is able to identify the correct location even though the external input (toy) is no longer present (has been hidden). The more times this behavioural pattern is successfully repeated and supported by a positive emotional attachment (reaching the goal, the smile and enthusiastic tone of the experimenter’s voice, the child’s joy at success), the more firmly the pattern becomes part of the child’s experiential structure.
Traditionally, it is understood that the experiment investigates a clearly delimited phenomenon. Therefore, the cognitive shift is pre-conceived as a specific step that is separate from other stages of human development. However, the consequences of this epistemological reduction are reflected in what ultimately became unsatisfactory interpretations of the experimental results. Some researchers have explained the results by the understanding that between the eighth and 12th month of age the child develops a concept of an object independent of the child’s own actions. Other researchers have explained the results by developments in the child’s cognitive representation of space, still others by changes in the functioning of the prefrontal cortex, or by changes in the child’s ability to accurately cognise sequences of events in time (Acredolo, 1979; Diamond, 1998; Smith & Thelen, 2003, pp. 344–345).
Then again, when the conditions of the experiment are even slightly changed, the results will prove to be relative to the research setting. For example, Thelen and her team varied the method of covering the toy at point A as well as at point B; varied the length of time before the toy was hidden; varied the child’s body position when they were to search at point B; added a weight to the child’s arm when the toy was placed at point A, etc. Most of these changes also altered how the child overcame the inferential error, i.e., at what month the child was able to identify the correct location of the hidden toy (Smith & Thelen, 2003, pp. 345–346).
Based on these results, Smith & Thelen argue that the problem with traditional interpretations lay in an epistemological framework that forces researchers to explain results “in terms of a single cause when there is no single cause” (2003, p. 345). Therefore, the researchers began with the help of a new method of visualization to consider an overall epistemological change that would make it possible to understand the experiment in the context of multicausality and the nested timescales that allow living organisms to achieve self-organization. At the very moment when the toddler is able to form a concept of an object independent of his actions, he is also able to represent space in a new way; his prefrontal cortex has adapted to changes, and he is therefore able to properly map the actions of the person manipulating the toy (this list of processes is not exhaustive), thus a new phenomenon has emerged. In this newly structured process, old functions are rearranged and connected to new functions in such a way that the child is able to cope effectively with the challenges at hand. This entire process leading to the harmony of all components will then allow the child to establish and continuously reinforce a new behavioural pattern (Smith & Thelen, 2003). If the self-organising principle is successful, it will become a long-term sustainable structure for the child (Rockwell, 2005; Thelen & Smith, 1994).
Taurinus’ example, along with that of Thelen and Smith, document how changing the way we visualize loosens prevailing frames of thought, thus allowing researchers to newly contextualize a way to build the theory of geometric space or understand experimental results. In the first case there was a recategorization of Euclid’s sixth axiom and thus of the inferences that followed from it: Two straight lines can suddenly enclose a space. In the second, the original Piagetian idea of the continuity of the development of a human organism was revived (cf. Piaget, 2001): Cognitive change occurs in infants between the eighth and 12th month, but this change is, firstly, relative to the experimental conditions set and, secondly, shows similar features to those used throughout life in problem-solving processes. In both cases, the consequences of the change of visualization facilitate the transformation of the respective field of knowledge. As Euclidean geometry became seen as simply one special subsection within non-Euclidean geometries (Bachelard, 1984, pp. 19–42), the results of the A-not-B error experiment could become a particular part of a general theory of human development. Such would be the case, that is, if mainstream psychological research took life dynamics seriously (Thelen & Smith, 1994).
Grasping the Complexity of Co-constitutive Relations in a Situation
Regarding the mapping itself, what might seem like a mere arbitrary illustration or graphic is actually quite a useful tool for individuals (including researchers) to initiate, elaborate, and deepen cognitive processes through visualization. During the process of mapping out the terrain, observers can creatively identify actual and potential tools and methods in their research as well as analytically grasp the elements of the situation along with the relationships between/among the terrain and the various available tools. The whole process is inevitably carried out in an abductive way in which there is a constant “a recursive process of moving between data and theories” that begins with the research intention, the compilation of the first notes, and, finally, ends with the final interpretation (Timmermans & Tavory, 2022, p. 156). Even in the pre-entry phase, however, SA employs a messy map through which researchers chart their mental images of the problem. As the cognitive act is in most cases a continuum of knowledge transitions, the researcher always approaches the problem with an already defined horizon of preunderstanding, in which initial intuition plays a significant role.
As far back as 1931, John Dewey in Qualitative Thought (Dewey, 1992) had explained the initial phase of any cognitive act that is triggered by a complexity of co-constitutive relations in which the researcher is involved directly and to which he responds. These relations express forces shaping a situation and can at first only be grasped by intuition. However, intuition according to Dewey does not represent a subjective state of cognizing humans, but the outcome of interactions between observers (researchers) and certain forces constituting a situation that bears certain intersubjective features. In the later stages of the analytical procedure, however, intuition is applied to the empirical data and a consistent system of description is formulated. In essence, individuals have access to the data only after intuitively grasping a whole situation as only then empirical material might begin to form in a series of processes through which proto-analyses and first classifications develop. Intuition, in fact, enables and facilitates a rational, logical understanding of the situation. Thus, it is necessary to perceive the intuitive grasp as an ongoing process which begins before the field or theoretical study is first entered and which continues in parallel with the first proto-analyses. The situational analysis itself as well as the examples of changes in the concept of geometry and in the concept of the A-not-B experiment show that visualization plays a key role in the situation grasping phase.
Also in SA, maps are not the result of analysis, but a means of coconstituting the situation, a way of understanding and visually sharing the results of analysis. Our innovation is a continuation of this trend. We also present here a specific map that serves to capture the processes of co-constitution among the forces determining the situation under study. Our innovation enables this abstraction ascent, i.e., the creation of an abstraction that moves us towards a more general understanding that subsumes initially apparently unrelated phenomena under categories which enables researchers to detect emergent, self-organizing processes.
A Spatial Map and an Example of Its Use in Exploring Inclusive Schools
The terms element and mechanism are used in situation analysis to refer to the first stages of analysis. An element is any unit that occurs in the situation under study, is captured in the data, and is logically separated from other units. The elements are formed in a repeated process of abduction, as the initial interpretation of the retrieved data is achieved through the corresponding open coding along with extensive annotation. Clarke (2015) has proposed various ways to sort, organize elements; in graphical form, the output is an ordered map of situation. If the focus is on the interaction between the two elements and a description of how they interact, we may say that the mechanism has been captured. Mechanisms are usually depicted on a relational map of the situation. While elements are captured in messy and ordered maps, the relations between elements, so-called mechanisms, emerge in a relational map of the situation.
At a general level, it should be emphasized that the various types of maps typical of situational analysis are understood primarily as visual aids to enable an understanding of the whole situation while also allowing further investigation. Although maps help to visualize research data, they by no means represent the final result of the research. Maps serve merely as a starting point for telling an analytical story.
In our three-year research on inclusive schools (Šíp et al., 2022), we constructed the elements (i.e., the basic units of analysis in SA) in the first phase, then structured them in ordered maps in the next phase in order to place them in relation to each other in relational maps in the third phase of the analysis. These steps form the traditional process of working with situational maps. The basic step in structuring a relational map is to determine the central element. Although Clarke herself nowhere explicitly indicates that there must always be only one central element, most analyses carried out automatically assume such a reduction (Clarke, Washburn, Friese, 2015, Kalenda, 2016). The classical relational map thus assumes a relatively high degree of centrality from which a particular analytic story can be derived.
The attempt to focus on a central element is understandable in terms of efforts to address the stated research question succinctly and convincingly. At the same time, however, such an accentuation of one predetermined central element may significantly limit the researcher’s understanding of the complexity of the situation under study. Thus, the presentation of results in the context of SA, as in any method of qualitative data analysis, must constantly balance between over-reduction and overwhelming complexity. As a solution, we propose not to relegate ourselves to merely one or a few central elements, regardless of the information in the data. Instead, we propose to consider as central all elements whose nature requires it, i.e., the mechanisms between an element and all other elements can be readily identified. This selection criterion distinguishing which elements can be considered central (for more information on selection process see the respective paragraphs below). From these elements and their mutual mechanisms we can then construct a spatial map.
The spatial map also allows us to articulate various different levels of data analysis and interpretation, which we have labelled as point, linear, planar, and spatial levels (Figure 3). • The point level focuses on the peaks of the spatial body, thus indicating the central elements along with a description of them. • The linear level focuses on the edges and diagonals of the body, thus symbolizing the relationships among the elements, which are the basis for describing the mechanisms of action among the elements. This corresponds to working with a relational map. However, in a spatial representation, unlike a classical relational map, we can more clearly show that each element is part of different mechanisms. • The planar level involves the connection of one mechanism to another. For example, we might observe how management by supporting general didactic ideas enables teachers to differentiate teaching strategies, or how management by building sophisticated forms of communication facilitates the process of differentiating teaching strategies, etc. The planar level involving the interactions among the different mechanisms comes to the fore especially in the spatial representation. • Finally, the spatial level allows for the integration of all the previous elements into a complex whole. It allows us to create various analytical narratives and answer different research questions in detail, but it also allows us to see the whole in its complexity. The overall consonance or dissonance of individual mechanisms does not occur only on one of the many planes, but on the entire surface and in the body defined by them. Through these properties, the system may be allowed to develop a self-organising principle within itself. The very essence of SA – its plurality and complexity – can be more effectively captured at the spatial level. Spatial map with a description of levels.

By introducing a spatial map, researchers can more easily analyse the emergence of new features as well as various ways they may be coordinated, leading to the synergy of all features. The process of self-organisation can also be more easily identified and described. We will now illustrate this through a specific example. In one of the research projects (Šíp et al., 2022) we undertook on inclusive schools, the following relational map (see Figure 4) containing dozens of significant elements was created. Relational situational map of significant elements of a particular school. The elements highlighted in bold along with the relationships among them signify the selection of areas that will be further described and analysed in more detail.
We extracted six elements that must be considered central from within this relational map based on our research study on inclusive schools: differentiation of teaching, social orientation of the school, general didactic ideas, teaching assistant (TA), communication and management (see Figure 4). The six elements formed the peaks of a spatial map, which we arranged in the shape of a diamond. Each of these elements had been carefully described and integrated into ordered maps based on the previous stages of analysis. At the same time, however, it is essential that the mechanism of interaction between any two peaks (the chosen elements) from the data can be defined. This is a key discriminating criterion in deciding whether elements from a relational map fit into the resulting three-dimensional shape. Unless the data show that there is a significant mechanism between the selected elements that affects all other central elements, it cannot be considered a central element. In this case, we can describe, e.g., how the • the mechanism between the presence of teaching assistants in the school and differentiation of teaching, which describes how differentiation is implemented in the classroom. • the mechanism between teaching assistants and school management that characterizes how management reinforces the importance of the role by selecting new candidates, while also describing the support that TA receive in the school. • the mechanism between teaching assistant and the social orientation of the school, which captures how and why children with special educational needs are supported. • the mechanism between teaching assistant and general didactic ideas, within which it is possible to prepare and implement more sophisticated teaching strategies than is possible in the frontal delivery of information. • the mechanism between the teaching assistant and communication, which indicates that the formal presence of the teaching assistant is not enough, but that it is necessary to integrate the TA into the communication system in a meaningful way, or to adapt the communication methods appropriately.
The specification and descriptions of these mechanisms confirm the validity of the inclusion of the teaching assistant element as one of the central elements in the spatial map. All the other elements of this map were validated through this same procedure. In the ordered and relational maps, many other elements can also be captured that contribute to understanding the complex situation in the school under investigation. The difference in our model, however, is that it enables us to show a markedly higher degree of interconnectedness between (and among) the other central elements. For example, while the element dealing with the education of TA (linked in the map via “support measures” to the anchoring of the TA in school legislation) forms a describable mechanism with the presence of assistants in the school, this element is no longer directly related to, for example, the social orientation of the school. The materials and equipment element of the school forms an interesting mechanism with possibilities for differentiation of teaching, but it is not linked to the forms of communication in the school. Thus, both elements (materials and equipment and forms of communication) they are not sufficiently networked with the other central elements and therefore cannot be classified as central elements. All elements from the relational map underwent such a selection process, with only six determined to be central elements. With the spatial representation, we were able to more clearly capture the network which distinctly depicts the interplay among all the described mechanisms (see Figure 5). A strip of two examples of two differently rotated diamonds. The hatched area is the same in both cases, which aids in the perception of the movement of the diamond.
As represented in the diamond diagrams below, the spatial map thus constructed allows us to change its position and alignment, rotate it, and otherwise find various new perspectives for interpreting the observed data. The point is that not only one analytical story must be chosen, as the spatial map already includes a number of them (see Figure 5).
Despite the diverse possibilities of analytical narratives, the spatial representation helps us to perceive, maintain and share the complexity of the whole situation. In our example, the degree to which there is consonance or dissonance between all the elements determines how the whole school functions and what kind of environment is being built up within it. The spatial map offers the possibility to work with a larger number of central elements. It allows a focus of not only on the mechanisms, but above all on the common space that the mechanisms create in synergy with each other. In our example, all six central elements and fifteen mechanisms are shown to support each other. This newly revealed and previously unnoticed property of the system enables detailed depictions of the situation in various ways which can be quickly modified to form new visualizations. The spatial map did not include a number of elements and mechanisms (see Figure 4 above) that went beyond the mutual relationships defined in the diamond. The expansion of situational analysis in terms of spatial dimension should prove an extremely useful step toward greater balance between the excessive reduction of data and the possibility of being overwhelmed by excess data. Our move expresses a compromise between outlining the complexity of an investigated situation and the transferability of results to others who want to understand the results of research, including members of the general public.
Discussion
Our innovation of supplementing SA with a spatial map brings several important changes with implications that venture beyond our own current research. (1) It allows the researcher to create an
The Formation of an Abstract Ascent
SA is now used primarily in research on health, educational, and political institutions (Aldrich & Rudman, 2016; Ligita et al., 2022; Outer et al., 2013), with its importance in institutional research continuing to grow. Our research falls into the category of institutional research, analysing the situation of a specific school and its specific way of functioning. In this text, we have focused on a visualization method that allowed us to detect and analyse self-organizing processes that are specific to the given school.
In this research, it was important to determine whether organizational principles can be mapped – most of all, whether the emergent self-organising processes that allows the school to cope with the challenges it faces can be mapped. If a school lacks the capability to self-organize, it is unable to respond to complex challenges; it gradually stalls or eventually collapses. Therefore, in the process of forming a visual grasp, it is essential to verify whether the chosen mode of visualization allows the researcher to work with a level of abstraction that is capable of making the self-organizing principles visible while still allowing this level of abstraction to be demonstrably anchored in the empirical data.
The process of situational mapping can culminate in a relational map that can display the individual mechanisms among the elements. It can characterise the action of individual mechanisms as well as determine the centrality (level of importance) of certain elements. Nevertheless, by the nature of its 2D imaging principle, a relation map is unable to make interrelationships between mechanisms visible at a higher level. It is precisely these interrelationships that are essential, since through their mutual networks they influence the temporary direction of the investigated institution. These relationships can be represented in an analogy to the axiomatic foundation of geometry, which had originally been based solely on plane representation. Although there have been doubts about Euclid’s sixth axiom for centuries, the limitations of Euclidean geometry were made apparent only through the courage and perspicacity to simply imagine two lines on a spherical surface (Bachelard, 1984, pp. 21–25).
In our model, we expanded the map’s 2D representation into 3D space, adding an additional dimension which facilitates a visualization of an abstract ascent. On the one hand, this allowed us to concentrate only on a certain type of data – the networked mechanisms deemed crucial for a given situation and given time. On the other hand, this allowed us to observe a new, previously unseen element which represented new characteristics that have changed the functioning of the institution. These characteristics were reflected in the degree of consonance between the chosen mechanisms. Our research question was postulated as follows: Which key processes contribute to the pro-inclusive nature of the school? The final answer was ultimately surprising even to us. The school under study was successful in its pro-inclusive efforts not primarily because one or the other processes were at work, but because these processes were working in consonance. Only this harmony allowed all the school actors to be successful in their efforts.
Thus we are able to discover a principal characteristic of the situation under study, i.e., the school in question. We found a way to visualize and then analyse the abstract space in which the self-organizing processes can be more readily recognized and grasped. Moreover, we identified the general key function that enables the school to set self-organizing processes. If there is consonance among relationships of mechanisms, an institution in its environment is able to coordinate most (if not all) of the challenges facing it, and to thus resolve multiple, often intersecting issues. If this consonance is not developed, the institution simply fails. The consonance of mechanisms is both a sign of self-organization as well as a way self-organization is accomplished.
Figuratively expressed, the entire school under research was able to move in one congruous direction to achieve its goals. When this high rate of coordination is not achieved, the parts of a school begin moving in divergent directions, eventually failing to cohere entirely. The investigated school was successful in creating a pro-inclusive environment primarily because it achieved a high degree of mutual consonance between its most important interrelations between elements, thus also a high degree of coordination of all individual processes. As was shown in our test case, with the help of the spatially extended relational map, researchers can decide which interrelations are key to a given institution and whether these interrelations are working in consonance with each other or not. Investigators are thus enabled to enter into an abstract sphere of a school self-organization processes while never losing the anchoring and specificity provided in the empirical data.
Our research has thus traced a similar arc to and built on the work of Thelen and Smith (Smith & Thelen, 2003; Thelen et al., 2001; Thelen & Smith, 1994), who were able to discover a more plausible and justifiable principle regarding the cognitive shift of toddlers. Through the coordination of many factors and through the representation of this shift in a three-dimensional representation, Thelen and Smith uncovered a general principle of human development that goes beyond the results of the A-not-B error experiment.
We believe that our innovation has great potential in institutional research, as it addresses a number of the demands placed on research by the concept of institutions. The model provides a methodological reduction of data made possible by the transition to an abstract level in which the emergence of self-organizing processes is apparent, but which at the same time does not lose contact with the empirical level.
Incorporating Dark Data
The discussion regarding the necessity of data reduction in the process of mapping multi-causal systems opens up the problem of dark data, the resolution of which has not yet been articulated adequately in qualitative methodology. The concept of dark data has recently been discussed, for example, by Hand (2020). Although as a statistician the author primarily considers quantitative data, a similar principle can be applied to qualitative data. Dark data is information that is somehow found or made available to researchers, but is not (or cannot be) applied to the research question/s of a particular study even though it is relevant to the problem under consideration. Hand describes the different types of dark data, the different ways in which this data is obtained and the different reasons why it does not enter into further analysis and decision-making processes.
In our case, within the spatial representation of the qualitative data we were able to capture the functioning of a pro-inclusive school as a dynamic institution. This work has also opened the way to shed more light on dark data (and thus at least partially reduce the darkness) within qualitative methodology. The data we collected during ethnographic inputs in the school are robust, but potentially meaningful representations of this data that would lead to deeper and more comprehensible interpretations were limited. If investigators focus on one particular aspect and describe one or two mechanisms in detail (a constraint compounded by the limited space in scientific journals), the rest of the data are thrown into the dark, further impoverishing the analysis of the mechanism originally described. The abstraction ascent of the spatial map allows the inquirer to not only perceive all the data in synergy with each other, but also to interpret them in such a way that data that would remain dark in other ways of representation are also illuminated. This succeeds in reducing the overall size of the dark data of a data collection in a way that, while working with the necessary degree of reduction, is able to highlight the multiplicative effect of the self-organizing principle of dynamical systems.
Conclusion
The critical importance of data visualization and how it can be enhanced is the main focus of this paper. In this article, we introduce our innovation in situational analysis (SA) in the form of a new type of analytical representation of data by means of a spatial map. The spatial map both reinforces and expands SA.
SA is based on visualisation through maps. To understand the critical importance of visualization in any type of research study, we documented its revolutionary potential with two examples: a new visualization of geometric space, and a new visualization of the A-not-B error experiment. In the first example, visualization led to a fundamental epistemological re-framing of the issue under investigation, while in the second case it will almost certainly lead to such a re-framing.
We hope that our innovations will facilitate a similarly significant frame shift. With the use of the abstraction ascent, the spatial map facilitates the analysis of the consonance or dissonance of forces (mechanisms) that are important for the situation under study. The consistency (coherence) and continuity (in space and time) of these forces determines whether the self-organizing principle is functional and well-structured. Using the example of one of our own research projects on inclusive schools in which the spatial map was used, we have traced the steps and detailed the reasons that led us to this innovation. Correspondingly, we used this example to document the principles of working with a spatial map as well as the potential implications of this innovation in the Art of Seeing for qualitative research in general.
Footnotes
Acknowledgements
The authors thank the reviewers for their comments and recommendations, which have contributed to a significant improvement of the manuscript.
Declaration of Conflicting Interests
The author(s) declared no potential conflicts of interest with respect to the research, authorship, and/or publication of this article.
Funding
The author(s) disclosed receipt of the following financial support for the research, authorship, and/or publication of this article: The research, authorship, and publication of this article was supported by Tomas Bata University in Zlín; project number: FSR FORD 5-6/2022-23/FHS/001.