
Abstract
Transition to adulthood is a multi-faceted, complex process that affects all areas of an adolescent’s internal and external world. Prior methodologies to assess the medical facet of this transformative time have focused on objective, quantitative analysis of transition practices to facilitate a productive transfer to an adult care provider, without considering the more nuanced context. Transition Design (TD) is an under-utilized, novel methodology that can holistically investigate transition to adulthood by generating insight into the current framework for transition both within and outside of the medical field, and by conceptualizing possible interventions for a more sustainable and equitable future -- all from the perspective of constituent groups who have expertise and a vested interest in transition. Participants within four such constituent groups (young adults, young adult caregivers, healthcare providers, and social services providers) completed a day-long workshop consisting of the six-activity sequence of TD, including 1) Mapping the Problem, 2) Mapping Constituent Relations, 3) Mapping the Evolution of the Problem, 4) Co-Creating Long-Term Future Visions, 5) Designing for the Transition, and 6) Designing Systems Interventions. TD is a promising approach for evaluating complex problems such as the transition to adulthood that thrive on the engagement of specific constituent groups. This methodology allows these groups to engage with and subsequently help solve wicked problems using their own experience.
Keywords
Introduction
Adolescents are on the precipice of adulthood, independence, and the ability to contribute fully to society. Transition to adulthood is a multi-faceted, complex process that affects all areas of life and shapes one’s inner and outer world (Fussell & Furstenberg, 2005; Waters, 2011). The process occurs across multiple domains, including health, education, employment, finances, and community, and encompasses legal, social, and emotional components (Billari et al., 2019). Significant structural barriers and social inequities exist on this pathway but are often ignored (Eilenberg et al., 2019; Ketcher et al., 2022; Schoon, 2015). These inequities directly relate to the historical and current distribution of social, political, economic, educational, and environmental resources (Bishop et al., 2020; Mary, 2014; Wray-Lake et al., 2020). Additionally, such social influences on health impact adolescent development into adulthood in a profound way by shaping the lifestyle, experiences, and accessible opportunities for a young adult (Huang & Sparks, 2023; Meisel et al., 2022; Yazdani et al., 2022).
Taking these complexities into account, the American Academy of Pediatrics, a leading professional organization of pediatricians and health care providers caring for children and adolescents, suggests a biopsychosocial, integrative framework to understanding the adolescent. They place particular emphasis on access to healthcare and resources, relationships, community, and belonging aspects of transition, and socioeconomic disparities across the young adult population (Alderman et al., 2019). This holistic approach can help to inform how a broad range of professionals including health care and social services providers, educators, and legal representatives can facilitate an adolescent’s transition to adulthood.
Despite recognition as best practice in clinical settings, holistic views of the adolescent transition to adulthood are rarely captured in existing research and research approaches. Most prior investigations of the pediatric to adult healthcare transition have focused on objective, quantifiable metrics of transition care activities within healthcare settings and how these can better serve adolescents (Ellison et al., 2022; Jones et al., 2019; White et al., 2018). Rarely do studies include considerations of an adolescent’s world and relationships outside healthcare. Adolescents and young adults who have lived experience of transition, and other integral constituent groups such as caregivers and healthcare and social services providers who interact with adolescents, hold key perspectives about the transition to adulthood. While some prior work explores diverse viewpoints, they have generally included only one or two of these groups, and narrowly focus on the medical aspect of transition (Ghanouni & Seaker, 2022; Sonneveld et al., 2013; Thomsen et al., 2022).
Moreover, the existing body of literature utilizes more traditional qualitative methodologies to collect these viewpoints, such as interviews and focus groups (Ghanouni & Seaker, 2022; Ladd et al., 2022; Peters et al., 2022; Thomsen et al., 2022). These methodologies have some substantial limitations. Interviews allow access to only one perspective at a time and are not dynamic in considering other viewpoints simultaneously (Ruslin et al., 2022; Swain & King, 2022; Von Soest, 2023). Focus groups can include multiple perspectives but remain static regarding data collection, with no interactions between groups (Jones et al., 2019; Vaughn et al., 1996). Interviews and focus groups also do not widely make use of alternative representations of data apart from the written word, such as the visual format (Savin-Baden & Major, 2023). Most importantly, they do not generally have participants guiding the investigation. Instead, the facilitators or researchers are the leaders of the conversation and, while they may be trained in good facilitative practices to encourage dialogue with participants, they concentrate the focus of the topic based on what information they want to obtain (Parker & Tritter, 2006). The participants do not often lead their own discussion or expand outside the current context of the topic. What is lost is their vision and planning for their own future or interventions based on their experience.
A multidisciplinary group of health-related professionals sought to explore the barriers to a successful transition to adulthood holistically using the novel Transition Design (TD) methodological approach developed by Irwin and Kossoff (Irwin & Kossoff, 2022). This paper describes the TD methodology and how we adapted it to engage young adults, their families, healthcare providers, and social services providers - key constituent groups with a vested interest and expertise in transition - in visually mapping the challenges associated with adolescent transition to adulthood. Study participants co-created long-term future visions and designed systems interventions that accurately and positively reinforce the benefits of multi-system efforts to improve transition, both within and outside of the medical context. Through analysis of the results of this formative research, we intend to break apart the existing silos between constituent groups and areas of discipline to support adolescent transition holistically and equitably.
Using TD to Address the Wicked Problem of Adolescent Transition to Adulthood
The TD Approach
TD is an interdisciplinary, methodological approach to address those problems in our society which are all-encompassing and highly resistant to simple solutions, such as climate change, lack of access to affordable housing, global pandemics, and more (Irwin & Kossoff, 2022). These complex problems are referred to as “wicked,” (Rittel & Webber, 1973) meaning that they are long-standing, systemic challenges which affect and operate at many levels of society and involve multiple constituent groups with different aims (Kossoff & Irwin, 2021). The aim of TD is to address intractable problems by identifying a set of strategies and leverage points for their implementation. Those engaged in a TD process achieve this aim by engaging in a series of six mind mapping exercises (which are each described in detail in the Workshop Activities section of this paper):
Mapping the Wicked Problem
Constituent groups list issues related to the wicked problem in five broad categories to create a visual representation.
Mapping Constituent Relations
Constituent groups list their fears/concerns and hopes/desires relative to the problem and the perceived hopes and fears of the other constituent groups.
Mapping Problem Evolution Over Time
Constituent groups list factors that they believe contributed to the rise and evolution of the wicked problem to explore how insights from the past inform the presentation of a problem in the present and what might progress into the future.
Developing Visions of the Future and Assessing the Present
Constituent groups document a future in which the wicked problem has been resolved.
Designing a System of Interventions
Constituent groups draft a progressive system of strategies for realizing desired change.
Within the TD framework, participants work to 1) understand the scope of the identified wicked problem and how it affects layers of society, and 2) solve the wicked problem through solutions meant to secure a long-term future that is equitable, sustainable, and harmonious for all parties involved. Because transition to adulthood is a multi-faceted process that reaches across the societal domains of the adolescent and includes inputs from their caregiver(s), healthcare provider(s), social services provider(s), and their peers, it can be defined as a wicked problem; therefore, it lends itself to being addressed through the TD approach.
Recruitment and Data Collection
Since our project involves human subjects, prior to beginning recruitment and data collection we received ethical approval through the University of Pittsburgh Institutional Review Board (STUDY22080028). We recruited all participants (adolescents, social services providers, healthcare providers, and adolescent caregivers) via snowball sampling. To adapt the TD approach to focus on the adolescent’s world specifically and reach adolescents and families less likely to be engaged in research, we contacted local adolescent and young adult care clinics, pediatric specialty clinics, LGBTQIA + youth programs, and young adult advocacy organizations. We contacted identified individuals and encouraged them to recommend other individuals who would be interested in participating. Participants gave verbal consent. We sorted participants into four constituent groups: young adults, caregivers, social services providers, and healthcare providers. Participants often held identities of multiple groups (i.e., a healthcare provider as well as the parent of an adolescent or young adult); participants selected the group with which they most clearly identified for the workshop.
We asked participants to engage in the six TD mapping exercises during a day-long workshop. The workshop took place in-person, in a conference room equipped with four stations. Each station contained a large computer screen, a keyboard and mouse for content entry, and a microphone for audio recording purposes. The workshop lasted 7 hr.
After watching a brief, pre-recorded power point presentation explaining each of the six activities, study participants worked collaboratively in their constituent group teams, using templates to create a total of six mind maps. We assigned two trained facilitators to each group. One facilitator acted as a guide for each activity, while the other filled out the activity maps on behalf of the participants. Facilitators were trained to type participants’ words verbatim. Prior to the workshop, the facilitators met with the research team to walk through the structure and goals of each activity and be trained in how to use Miro, a web-based whiteboard tool, to edit interactive templates of the maps. We recruited 8 individuals (four physicians, two social services providers, one clinical research coordinator, and one medical student) to serve as facilitators. We introduced facilitators to the Transition Design methodology in a 1.5 hr training and also provided a facilitator’s guide customized to our workshop activities. Following the workshop, facilitators completed brief electronic surveys providing Likert-type responses to measures assessing perceived acceptability and appropriateness of the Transition Design methodology for studying transition to adulthood using the Acceptability of Intervention measure (AIM) and the Appropriateness of Intervention measure (IAM), and qualitative free-text responses assessing the facilitation experience.
Participants spent 45 min on each activity, prefaced by a 5-min explanation of the activity and followed by 10-min breaks. We also gave the participants 1 hr for lunch provided at no cost. For their time, participants received US$300. At the conclusion of the workshop, we archived the six maps each constituent group created for evaluation. Below we describe an in-depth description of the goals and procedure for each of the activities.
Workshop Activities
Activity 1: Mapping the Problem
Problem mapping is a process in which workshop participants collaborate within their constituent groups to develop a visual representation of a wicked problem, and then comprehensively identify interdependencies and interconnections within it. This first exercise facilitates an understanding of the wicked problem according to the constituent group in five domains of society: economic and financial, social, environmental, political/legal, and health/wellness.
In the workshop, we instructed participants to respond to the prompt, “What are the issues related to the transition to adulthood?” in each of these different areas, and then asked, “Does this issue cause or lead to another issue in a different domain?” to make connections between societal sectors. We drew dotted lines on the map to make connections between different statements that participants noted as connected to one another. Our map for this activity is a replica of the map designed by Drs. Irwin and Kossoff (Irwin & Kossoff, 2022). Figure 1 highlights the template map for this activity. Template map for Activity 1-Mapping the Problem. Caption: The facilitator typed participant responses verbatim into the boxes corresponding to societal areas by workshop facilitators. Facilitators added dotted lines to represent connections that participants made between statements. Text and dotted lines included on this template map serve as examples of how the map was filled out and are not real responses from participants.
Activity 2: Mapping Constituent Relations
In the second exercise, constituent groups identified their fears and concerns related to the problem, and their hopes and desires that are connected to the resolution. We asked participants to speak about their fears/concerns and hopes/desires, and then asked, “Is this viewpoint in alignment or in opposition with other viewpoints?” We drew red (opposition) and green (alignment) lines on the map to connect statements that participants noted as aligned or opposed with one another. We also asked participants to rank the importance of each constituent group (young adults, social services providers, healthcare providers, and caregivers) including their own from most to least powerful in terms of their impact on transition. This activity enables the identification of points of optimism and conflict in the transition process, which are bolsters of and barriers to resolution of the wicked problem. Thus, solutions that can build trust among constituent groups and may garner broader constituent support become more easily identifiable.
We adapted the map for this activity from one designed by Drs. Irwin and Kossoff (Irwin & Kossoff, 2022) (Figure 2). Instead of having participants list all constituent groups involved in the wicked problem that is being addressed, we limited our exercise to the groups present in the study due to the constrained time frame of our workshop. Additionally, our ranking system of constituent groups is not visible on Irwin and Kossoff’s version of the map, although they do discuss this idea of relative power in their version of this activity. We felt that the ranking system was an interesting point of data, and we therefore included it on the map. Finally, we had red and green boxes already visible to participants at the beginning of the activity to guide their responses and provide a sense of structure. Template map for Activity 2- Mapping Constituent Relations. Caption: The red boxes correspond to fears and concerns of each constituent group, the green boxes correspond to hopes and dreams of each constituent group, and the yellow circles correspond to the ranking of importance given by participants for each constituent group (1 = most important, 4 = least important). The red lines correspond to statements that participants denoted as in opposition with one another, and the green lines correspond to statements that participants denoted as aligned with one another. The lines, numbers, and text shown here are not real responses given by participants.
Activity 3: Mapping the Evolution of the Problem
Template Map for Activity 3- Mapping the Evolution of the Problem.

Caption: Figure 3 shows the visual map representation for Activity 3 and Table 1 shows the questions that we asked participants for this activity; each prompt was grouped within a color category. Participants’ responses were placed in boxes directly on the map corresponding to the color of the prompt they were answering.

Template map for Activity 3- Mapping the Evolution of the Problem. Caption: Figure 3 shows the visual map representation for Activity 3 and Table 1 shows the questions that we asked participants for this activity; each prompt was grouped within a color category. Participants’ responses were placed in boxes directly on the map corresponding to the color of the prompt they were answering.
Our map for this activity differs from the approach used by Dr Irwin and Dr Kossoff; for this part of the TD approach, they utilize a Multi-Level Perspective Framework (MLP) that looks at the evolution of the wicked problem in three layers: the Landscape level, where large, collective events are placed, such as pandemics or world disasters, the Regime level, where historic events or current ways of living are placed, such as the government’s response to the COVID-19 crisis, and finally the Niche level, where novel innovations such as a Universal Basic Income (UBI) are placed, which arise from the previous two levels (Irwin & Kossoff, 2022). For example, discussions around a UBI arose from the pandemic and the government’s subsequent response to it. We amended this framework and focused our study on the simpler language of the past, present, and future of the problem due to the time constraints of our workshop and for ease of understanding for our participant groups. We adapted questions that we asked participants from prior TD work (Irwin, 2019). Figure 3 and Table 1 summarize the map for this activity and the prompts utilized.
Activity 4: Co-Creating Long-Term Future Visions
This activity encourages participants to create compelling visions of long-term, lifestyle-based futures in which problems have been resolved and most constituent needs have been met. We instructed participants to envision ways of living that are sustainable, equitable, and desirable, and to describe how and why the wicked problem was resolved at the micro and macro level, zooming in on the household and zooming out to the nation. Figure 4 shows the map for this activity. Participants responded to prompts which are shown in Table 2. Template map for Activity 4- Co-Creating Long-Term Future Visions. Caption: Figure 4 shows the visual map representation for this activity, and Table 2 shows the questions that we asked participants. These questions in Table 2 correspond to a color on the map that represents a societal level, zooming out as the activity progresses from the smallest scale of Household to the largest scale of Nation. Participant responses were placed directly on the map in the color boxes matching the prompt they were answering. Template Map for Activity 4- Co-Creating Long-Term Future Visions. Caption: Figure 4 shows the visual map representation for this activity, and Table 2 shows the questions that we asked participants. These questions in Table 2 correspond to a color on the map that represents a societal level, zooming out as the activity progresses from the smallest scale of Household to the largest scale of Nation. Participant responses were placed directly on the map in the color boxes matching the prompt they were answering.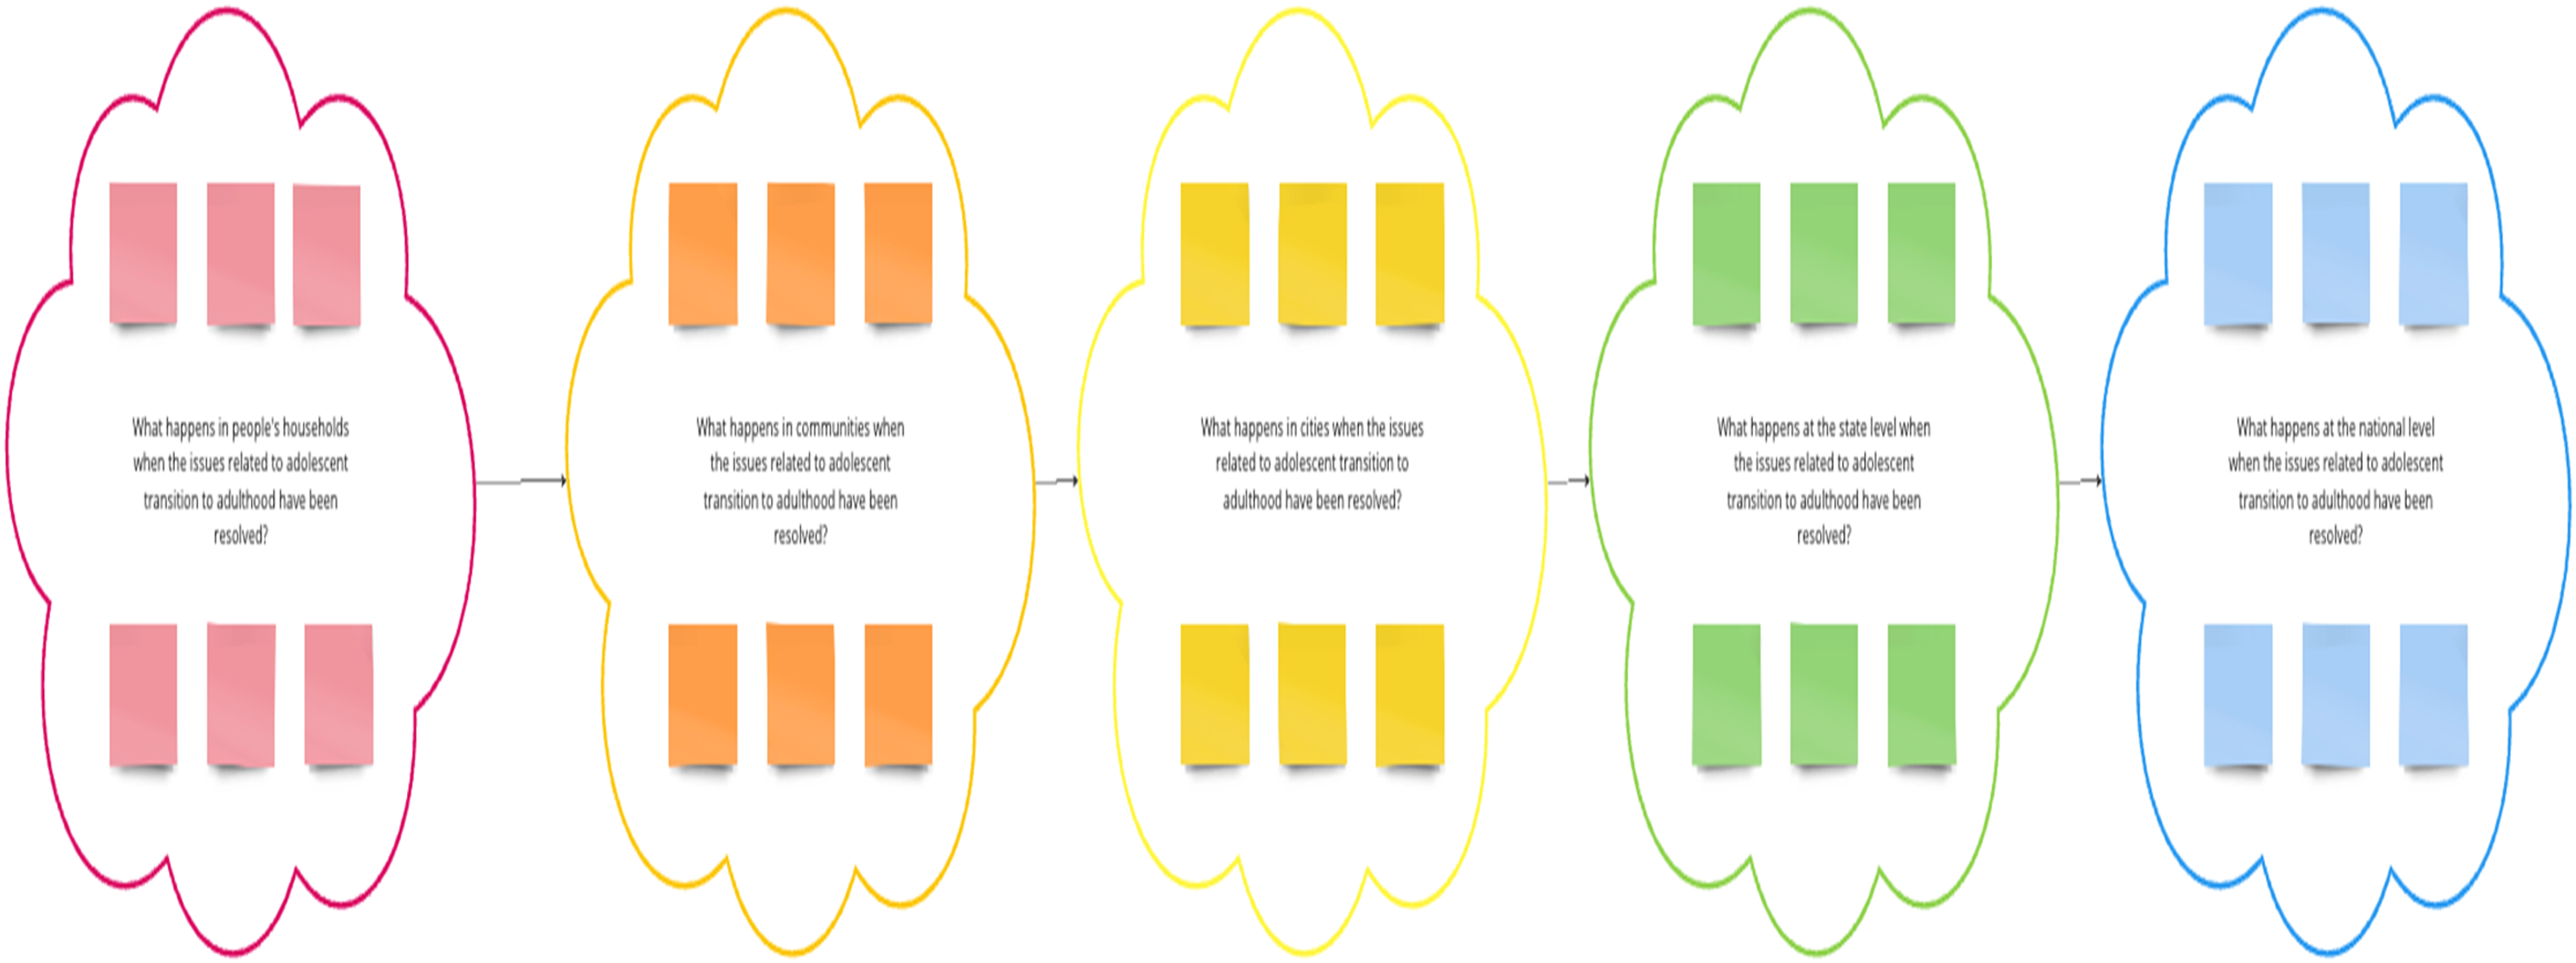

The responses collected here show researchers where constituent groups identify changes at many levels of society in a more ideal world, and how these groups may agree or disagree about these changes, allowing insight into implementation of these ideas in the present, starting from even the small scale of individual households. We adapted Irwin and Kossoff’s map for this activity and used a linear, horizontal model rather than concentric circles to represent the different levels of scale (Irwin & Kossoff, 2022).
Activity 5: Designing for the Transition
In this activity, participants assess aspects of the present in relation to the desired future envisioned in the previous exercise. Participants must collectively decide what parts of the present should be kept and what parts should be left behind to realize that desired future. Participants must also brainstorm what improvements or new interventions could combine with existing elements to lead society toward their future vision. Figure 5 highlights the map template for this activity and Table 3 summarizes participants prompts. Template Map for Activity 5- Designing for the Transition.

By assessing what is valuable and not valuable about the current state of transition, constituent groups completed the three-fold problem framing process that they began in Activity 3 and considered transition in the context of the past (Activity 3), future (Activity 4), and present day (Activity 5). Therefore, researchers can begin to understand the context of the problem and subsequently potential solutions across these timeframes as well.
Activity 6: Designing Systems Interventions
In the final activity, participants translated their ideas for how to move society toward their desired future vision into a sequence of interventions. Building off responses from Activity 5, participants identified best practices for implementation of their ideas and assembled them into a concrete, deliverable strategy for jumpstarting and stewarding a system that produces better outcomes for youth transitioning into adulthood. We instructed participants to place their responses from Activity 5 onto the current map for Activity 6, within a societal domain category that references Activity 1 (economic and financial, social, political/legal, environmental, health/wellness) and within a level of scale that references Activity 4 (household, community, city, state, nation). Moreover, participants discussed the order of sequences in which their ideas should be implemented, moving from first priority (denoted with a “1”) to lower priorities. Participants drew arrows on the map to indicate the level of priority and the sequence. Multiple ideas could be listed as the same level of priority if needed.
Our map for this activity differs somewhat from Drs. Irwin and Kossoff’s approach. We had participants place their responses from the previous activity directly onto this map in the agreed upon level of scale and societal domain, versus having participants consider interventions during this activity that did not have to directly originate from the prior discussion (Irwin & Kossoff, 2022). We created this sequential process to fit within the timeframe of our workshop, and to increase accessibility, as societal interventions can be difficult to conceptualize abstractly without a framework for guidance. Figure 6 summarizes the process for this activity. Template map for Activity 6 - Designing Systems Interventions. Caption: Participants looked back at all their responses from Activity 5 and placed each of these responses directly in the boxes on the template map for Activity 6, within the societal domain (horizontal rows) and the level of scale (vertical rows) that they felt was appropriate. Participants also collectively decided the order of importance of these interventions and denoted their sequential ranking with numbers and arrows (“1” meaning “should be addressed first,” 2 meaning “should be addressed second,” and so on). An example of this sequential ordering system is shown on the template map for clarity of explanation and does not consist of real participant responses.
Data Analysis
We analyze the data generated from these activities in two ways. First, we use a qualitative, iterative coding process (Linneberg & Korsgaard, 2019) to generate themes from the words and language of the participants using Dedoose, a web-based coding software which allows for the application of codes to images. Initially, the first coder independently codes each constituent group’s data, and develops a first set of codes from a thematic review of that group. This coder applies a code to each excerpt added by participants, and these four sets of codes are combined into one codebook encompassing all four groups. The second coder applies this master combined codebook to the data, and the first and second coders meet to discuss discrepancies. We utilize the fully coded data based on the master codebook to understand areas of convergence and divergence more deeply. We identify points of convergence across all groups as they represent places of immediate, collaborative action. Areas of divergence highlight the different perspectives of each constituent group and understanding where these differences occur can be used to facilitate collaborative interventions.
The second qualitative method of data analysis involves sensemaking, affinity mapping, and diagramming. Each process is carried out using the Miro virtual whiteboard platform. The sensemaking methodology aggregates and identifies emergent themes within the content of each set of maps. Sensemaking is an iterative process of identifying patterns within or categories of inputs to arrive at contextual insights (Holt & Cornelissen, 2014). To engage this process, coders work together to tag and sort the content generated during the workshop by participant group. Coders then create new consolidated diagrams representing each participant group’s answers for each activity, as well as the common, emergent themes across groups for each activity. Affinity mapping, also known as the KJ or Kawakita Jiro method, is used to document the “sense” or meaning made from the emergent themes identified (Scupin, 1997). A breakdown for each map showing the emergent themes is created. These breakdowns use the color codes for each participant group to show which and how many groups identified each theme with their answers. As with the coding process, particular attention is paid to areas of affinity and alignment, as well as areas of disagreement and conflict between participant groups. The diagrams created through affinity mapping show the patterns identified, reflect which groups identified which themes, present the insights captured, and depict the conclusions drawn from the data collected during the workshop.
This method of data analysis creates new visual data sets, in addition to the maps generated through the TD workshop process itself. Taken together, the visual and textual analysis of data attempts to preserve the perspectives and insights of each participant group. This two-part approach contributes to the study’s aim of detailing a constituent-informed understanding of the challenges associated with adolescent transition to adulthood and constituent generated solutions by ensuring that the participant voice remains near the analysis.
Facilitator Feedback
From the facilitator responses, the mean score for the Acceptability of Intervention Measure (AIM) was 4.71 ± 0.68 and the mean score for the Appropriateness of Intervention Measure (IAM) was 4.67 ± 0.47 (out of a maximum score of 5, indicating high acceptability and high appropriateness). Qualitatively, facilitators commented that Transition Design is an innovative way to engage the community with one noting that, “Overall [Transition Design is] a very interesting model for providing rich data regarding the issue of transition to adulthood.”
Discussion
In summary, TD is a novel methodology well suited to generate narrative data about transition to adulthood, therefore facilitating a nuanced, multi-faceted understanding of the “wicked problem.” TD has some strengths that set it apart from other qualitative methodologies, such as traditional interviews and focus groups. Overall, the methodology utilizes visual maps to track the data, which provide a novel, easily digestible format for dissemination of thematic data. The visual maps allow for both verbal, iterative coding of the data and visual analysis, enabling a flexible and nuanced analysis of the data collected. Additionally, the group exercises to produce the maps are dynamic and interactive, with multiple constituent groups participating in data collection simultaneously. Participants work within their groups to lead their own discussion and produce their own vision of a better future, and thus the solutions gathered are formulated by those most affected by the problem.
Other visual mapping frameworks, such as the concept mapping methodology and photograph incorporation, have been utilized in prior studies. Concept mapping is well-documented as an effective methodology for gathering qualitative data in the literature (Burke et al., 2005; Ligita et al., 2022; Vaughn et al., 2017); it involves the creation of a visual guide to organize and disseminate the collected data, as opposed to the more traditional textual format. This methodology helps to bring clarity and ease of understanding of the data through the visual format, and centers participant responses, as participants join in the interpretation of collected data and created maps (Kazmerski et al., 2019). Additionally, the incorporation of photographs into scholarly investigations can help to encourage a diversity and richness in participant responses, by offering another type of medium besides text for increased participant engagement (Catalani & Minkler, 2010; Stransky et al., 2023). TD takes these existing visual frameworks a step further, by not only providing the ability for visual analysis and centering participant responses as concept mapping and photographs do, but also facilitating unique, participant-developed interventions. The six workshop activities build on each other and tell a cohesive, sequential narrative through the maps, ending in a real-time intervention design for an improved transition to adulthood. This methodology is not just about mapping or framing a conceptual problem; participants seek to understand and subsequently solve the problem through the maps, using their own experience.
As with all methodologies, this approach has several limitations. The design of the workshop for data collection requires resources, including a room that can accommodate all the groups, and facilitators that are trained in this particular methodology and general qualitative and focus group facilitation skills. A researcher who is well-versed in TD needs to train the facilitators prior to the workshop day and ensure that they know how to facilitate a conversation that encourages dialogue. Reassuringly, after the completion of both their training and the workshop itself, 83.3% of our facilitators “strongly agreed” and 16.7% “agreed” with the statements “I felt comfortable facilitating the workshop exercises” and “I felt prepared to facilitate the workshop exercises.” Moreover, the participant groups cannot consist of too many or too few participants, so that everyone has a chance to contribute; there is a balance between having diverse perspectives represented, and inability to have a productive conversation due to too many voices. Furthermore, this methodology generates an enormous amount of data through the six activities for each of the four constituent groups. This data is extremely valuable when conceptualizing a massive, all-encompassing framework for transition that is not constrained by societal level or affected group; however, the amount may present a challenge for digestible and meaningful analysis and synthesis. An organized and systematic approach to data analysis is necessary, coupled with flexibility. We also recognize that the transcription of participant statements verbatim may be a source of bias with errors or oversights by facilitators. Previous projects that utilized TD have had participants guide themselves through the mapping activities and write down their own thoughts (Irwin & Kossoff, 2022); however, we felt that teaching participants how to use the maps and the Miro software may be overwhelming in the timeframe of this workshop. We recognize that this more direct method has value and the merits of it should be considered.
In conclusion, we demonstrate that the TD framework has utility for brainstorming solutions to societal issues that are far-reaching and complex and thrive on the engagement of specific constituent groups with experiential knowledge. We encourage the use of this visual mapping methodology for further investigations into the transition to adulthood as well as analysis of other “wicked” problems. We also believe in the utility of this approach for research with adolescent populations in general, as the workshop framework gathers data in an approachable, hands-on way that can be exciting for young people specifically. We look forward to engaging with further adaptations of TD and applying such principles in other settings in healthcare research.
Footnotes
Acknowledgements
We would like to thank our workshop participants, and Drs. Laura Kirkpatrick and Colleen Mathews who assisted with facilitating our Transition Design workshop.
Declaration of conflicting interests
The author(s) declared no potential conflicts of interest with respect to the research, authorship, and/or publication of this article.
Funding
The author(s) disclosed receipt of the following financial support for the research, authorship, and/or publication of this article: This work was supported by the University of Pittsburgh Momentum Funds (PI: Kazmerski).