A Systematic Approach to Improving the Transparency of Interview Refinements and Data Sufficiency in Semi-Structured Interviews: An Illustration Using the Mass Atrial Fibrillation Screening Study
Open accessResearch articleFirst published online December, 2023
A Systematic Approach to Improving the Transparency of Interview Refinements and Data Sufficiency in Semi-Structured Interviews: An Illustration Using the Mass Atrial Fibrillation Screening Study
Semi-structured interviews allow progressive interview refinements to gain an in-depth understanding of a research question, but interview refinements affect the stopping point. This paper aims to describe a method that provides transparency in interview refinements and helps researchers decide on a stopping point.
Methods
We established systematic and practical methods to document interview refinements and visualize novel and duplicate interview codes. We illustrated the methods using a case study called the Mass Atrial Fibrillation Screening Study, a real-world clinical trial. Interviews were audio recorded and transcribed progressively. Two researchers established the initial coding into a predefined framework with reference to the Medical Research Council Guidance of Process Evaluation. Final codes were reached by discussion and consensus. NVivo v12 software was utilized to manage the qualitative data.
Results
We developed an open-access software package for the ‘R’ statistical programming language called ‘novelqualcodes’ and a video demonstrating the application. Our package converts NVivo coding matrices into graphs of the trends of novel and duplicate codes. Our package also enables users to document interview refinements as fieldnotes, providing a visual guide to help researchers decide on a stopping point. In the case study, one researcher (KCW) conducted 48 one-to-one in-depth semi-structured interviews with participants from September 2021 to July 2022. Interview refinements were identified and reported to provide transparency to the readers. The novel code graphs and examination of the code sufficiency in the predefined framework demonstrated the stopping point at which we were satisfied with the richness and insights of the interviews in answering our research question.
Conclusions
We illustrated a new paradigm of systematic and practical methods and shared an open-access software package and a video to describe, document and visualize the path to the stopping point. This approach can be applied in other qualitative research using different predefined frameworks.
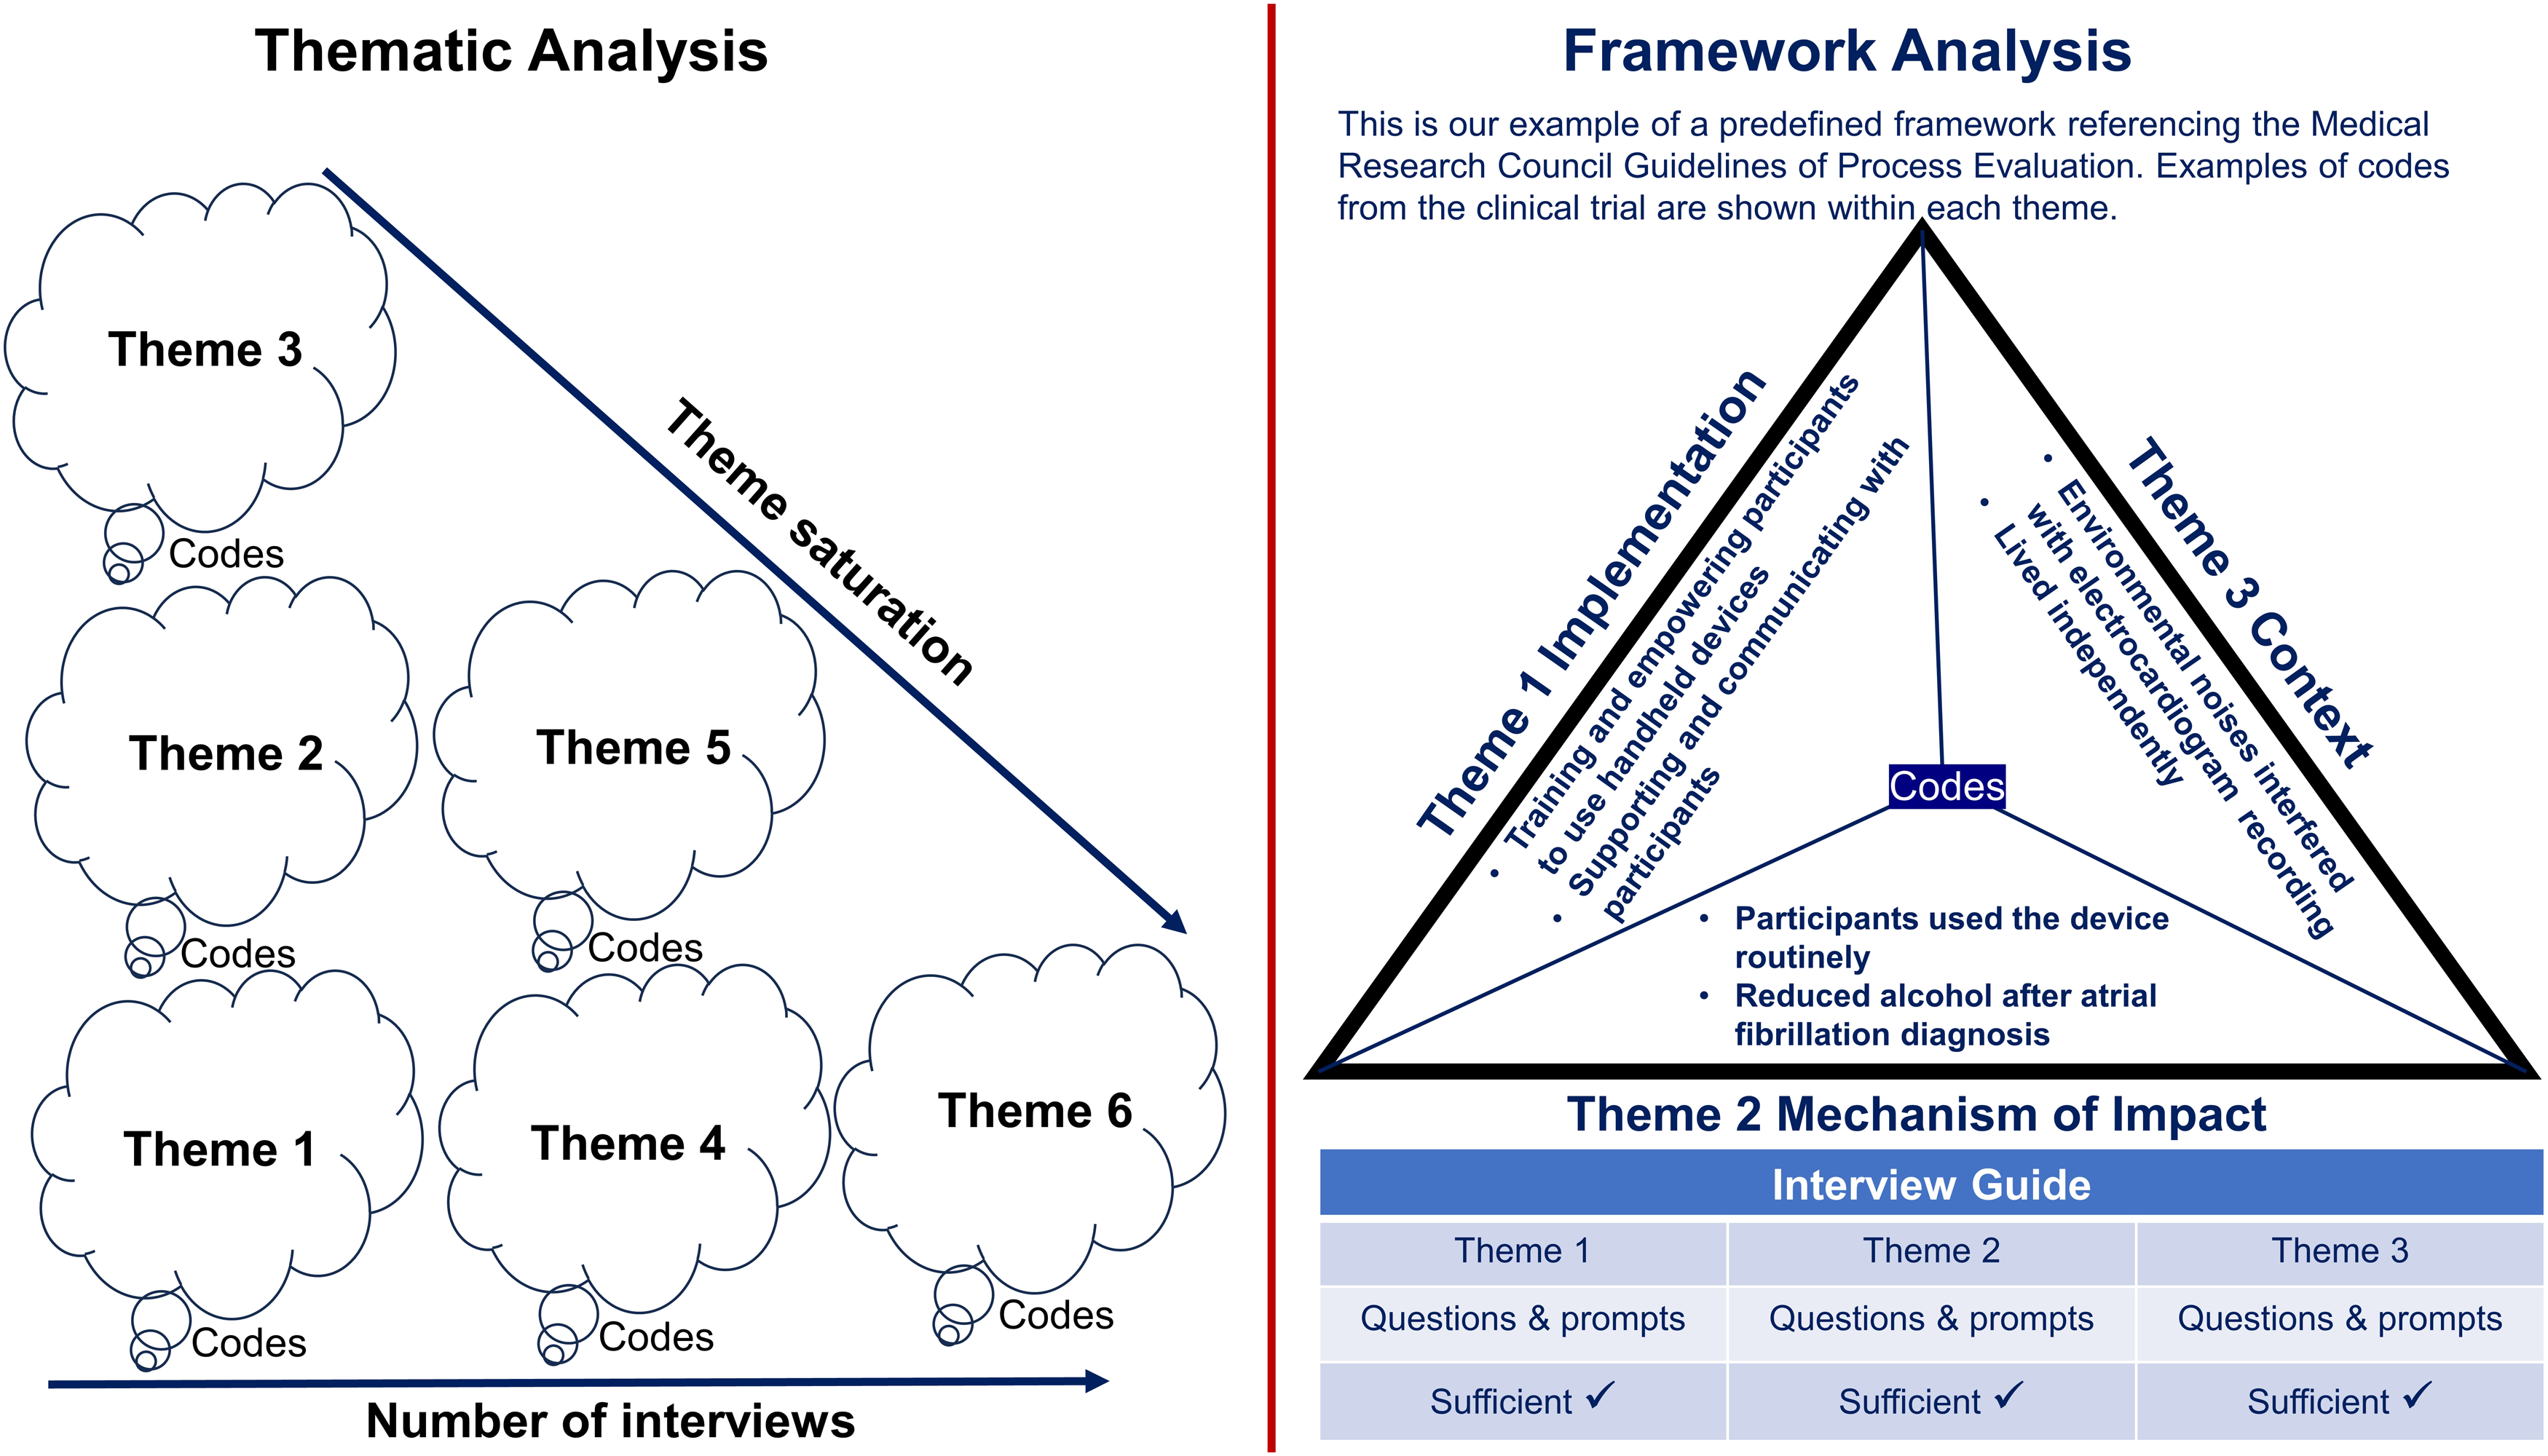
Qualitative research using semi-structured interviews typically employs an iterative process in which data collection and analysis occur concurrently to refine questions and add new prompts to explore relevant topics inspired by participants in previous interviews to gain an in-depth understanding of the research question (DeJonckheere & Vaughn, 2019). The additional prompts and refined interview questions generate new information and affect the decision of when to stop recruiting participants for interviews (Braun & Clarke, 2021). In thematic analysis, interview transcripts are inductively coded (i.e. content-driven from participants). Codes are then categorised to form themes (Braun & Clarke, 2021; Patton, 2014). Some researchers define code saturation as the point at which the codebook stabilises (i.e. new interviews produce little or no change to the codebook), and theme saturation is conceptualised as the point when new interviews produce no novel concept (theme) to the research question (Saunders et al., 2018). Generally, as the number of interviews increases, the number of new novel themes decreases if there is no new question added to the interviews (Figure 1). Researchers acknowledge the assertions that data saturation (i.e. the stopping point) for a qualitative study depends on the research question, purpose and interpretative process and is typically determined by the judgement and experience of researchers (Guest et al., 2006; Guest et al., 2020). However, there needs to be more transparency regarding interview refinements and the decision paths to the stopping points in qualitative studies.
An illustration of data sufficiency in thematic analysis and framework analysis.
Framework analysis is a method of analysing qualitative data using a predefined framework that outlines the themes related to the research question (Gale et al., 2013; Trankle et al., 2019). The framework can be established using inductively- and deductively-derived themes from the literature (Goldsmith, 2021) or referenced from published guidelines such as the Medical Research Council Guidance of Process Evaluation (Moore et al., 2015). Using framework analysis in semi-structured interviews, researchers code interview transcripts within the predefined framework, that is, to a priori collection of main themes relevant to the research question. Coding is a data-driven process in which researchers synthesise what the data tell them, and codes are the outputs of the process (Patton, 2014). Codes are then categorised into the predefined framework. Code saturation is defined as the point when researchers are satisfied with the richness of the data, providing insights into each predetermined theme (Figure 1) (Hennink et al., 2017).
There is a need for published practical methods about the process of deciding on the stopping point in semi-structured interviews analysed using the framework method. We aim to address this need by describing a novel method of documenting this process using a case study.
Methods
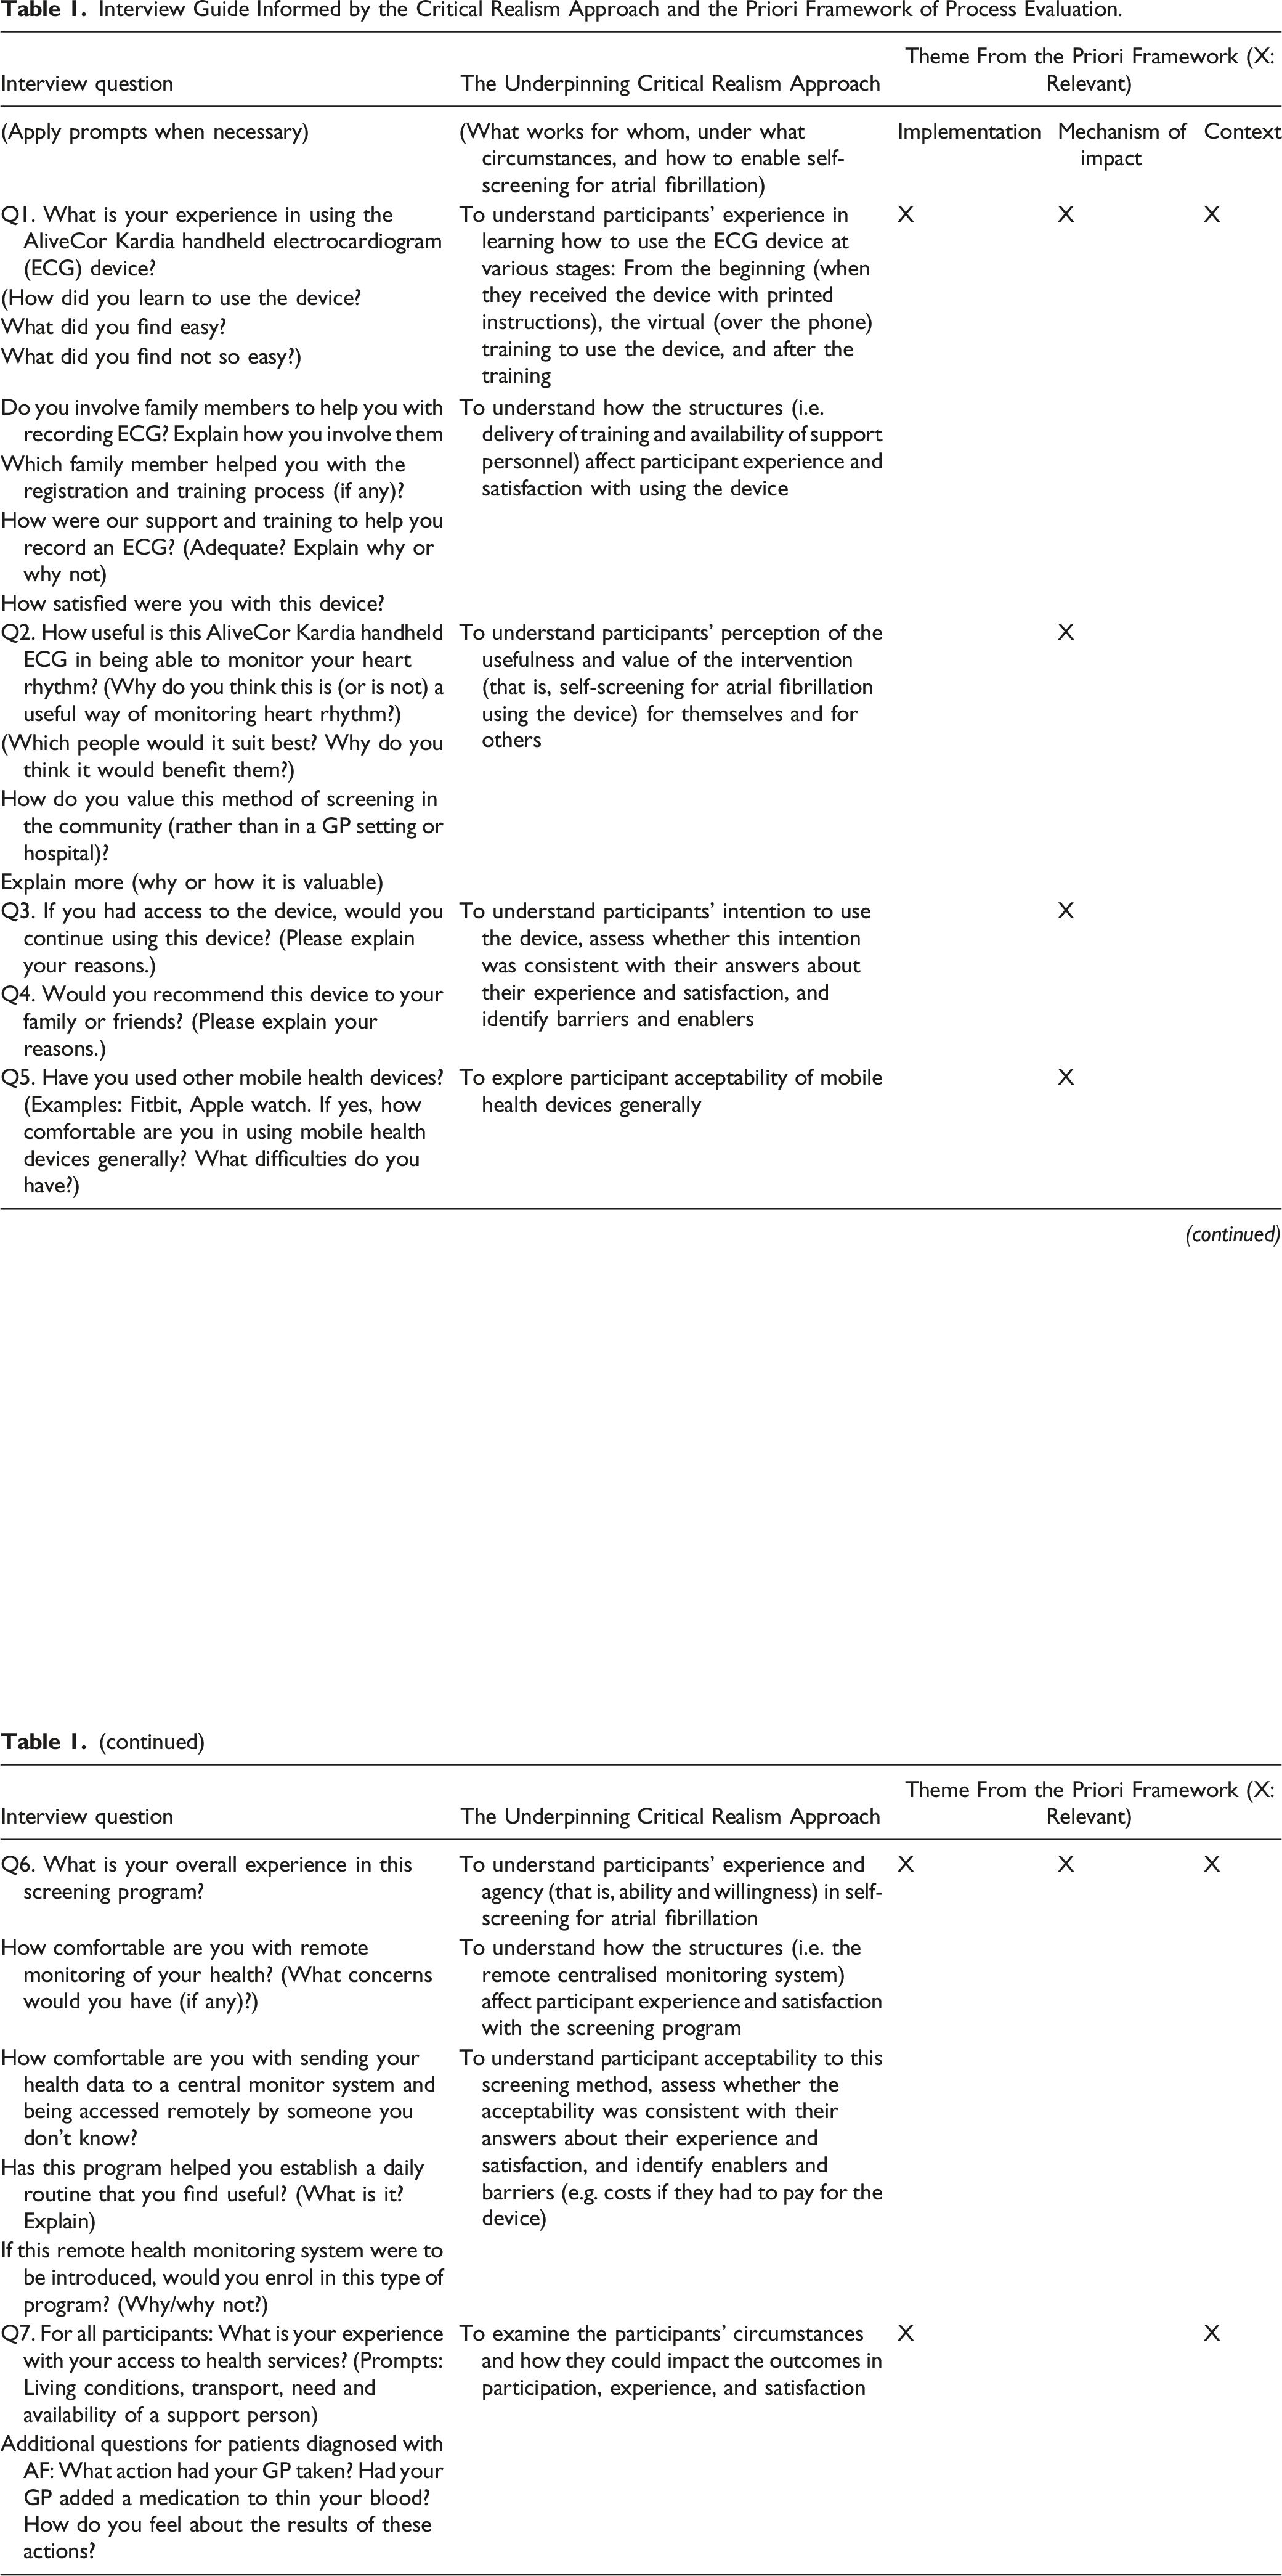
The case study was a real-world clinical trial called “Mass Atrial Fibrillation Screening Study (MAFS)” registered with the Australian New Zealand Clinical Trials Registry (ACTRN12621000184875) (Wong et al., 2022). In the MAFS trial, 200 community-dwelling participants aged ≥75 years were trained to use a handheld electrocardiogram (ECG) device to self-record ECG rhythm traces by placing their fingers of both hands on a touchpad, which is smaller than a credit card, for 30 seconds. Their rhythm traces were automatically transmitted to a remote central monitoring system checked by clinicians. The participants were notified of atrial fibrillation (AF), an irregular heart rhythm that increases the risk of strokes. Participants in the intervention group used the device once daily on weekdays for 12 months. Participants in the waitlist control group waited six months before commencing the program in the remaining six months. During the waiting period, the control group received the usual care from their general practitioners (GPs) when needed. We purposively invited male/female and urban/rural participants to one-to-one semi-structured interviews after using the devices for at least three months. We used a purposeful approach aiming to achieve participation from men and women (in an approximate ratio of one to one) and urban and rural participants (in an approximate ratio of two to one) to reflect the participants of the clinical trial (Palinkas et al., 2015). The Critical Realism approach informed the interview questions to explore participants’ perceptions, experiences, and interactions with contextual factors (i.e., what works for whom and under what circumstances, and how to enable self-screening for AF). The interview guide was published in the protocol paper and framework analysis was applied to evaluate the feasibility of the trial intervention (Wong et al., 2022). The UK Medical Research Council Guidance of Process Evaluation (Moore et al., 2015) was selected as the predefined framework, which consisted of three main domains that are equivalent to themes, i.e., Theme 1 Implementation, Theme 2 Mechanism of Impact, and Theme 3 Context. The formulation of interview questions underpinned by the Critical Realism approach and the priori framework of process evaluation are illustrated in Table 1.
Interview Guide Informed by the Critical Realism Approach and the Priori Framework of Process Evaluation.
Interview question
The Underpinning Critical Realism Approach
Theme From the Priori Framework (X: Relevant)
(Apply prompts when necessary)
(What works for whom, under what circumstances, and how to enable self-screening for atrial fibrillation)
Implementation
Mechanism of impact
Context
Q1. What is your experience in using the AliveCor Kardia handheld electrocardiogram (ECG) device?
To understand participants’ experience in learning how to use the ECG device at various stages: From the beginning (when they received the device with printed instructions), the virtual (over the phone) training to use the device, and after the training
X
X
X
(How did you learn to use the device?
What did you find easy?
What did you find not so easy?)
Do you involve family members to help you with recording ECG? Explain how you involve them
To understand how the structures (i.e. delivery of training and availability of support personnel) affect participant experience and satisfaction with using the device
Which family member helped you with the registration and training process (if any)?
How were our support and training to help you record an ECG? (Adequate? Explain why or why not)
How satisfied were you with this device?
Q2. How useful is this AliveCor Kardia handheld ECG in being able to monitor your heart rhythm? (Why do you think this is (or is not) a useful way of monitoring heart rhythm?)
To understand participants’ perception of the usefulness and value of the intervention (that is, self-screening for atrial fibrillation using the device) for themselves and for others
X
(Which people would it suit best? Why do you think it would benefit them?)
How do you value this method of screening in the community (rather than in a GP setting or hospital)?
Explain more (why or how it is valuable)
Q3. If you had access to the device, would you continue using this device? (Please explain your reasons.)
To understand participants’ intention to use the device, assess whether this intention was consistent with their answers about their experience and satisfaction, and identify barriers and enablers
X
Q4. Would you recommend this device to your family or friends? (Please explain your reasons.)
Q5. Have you used other mobile health devices? (Examples: Fitbit, Apple watch. If yes, how comfortable are you in using mobile health devices generally? What difficulties do you have?)
To explore participant acceptability of mobile health devices generally
X
Q6. What is your overall experience in this screening program?
To understand participants’ experience and agency (that is, ability and willingness) in self-screening for atrial fibrillation
X
X
X
How comfortable are you with remote monitoring of your health? (What concerns would you have (if any)?)
To understand how the structures (i.e. the remote centralised monitoring system) affect participant experience and satisfaction with the screening program
How comfortable are you with sending your health data to a central monitor system and being accessed remotely by someone you don’t know?
To understand participant acceptability to this screening method, assess whether the acceptability was consistent with their answers about their experience and satisfaction, and identify enablers and barriers (e.g. costs if they had to pay for the device)
Has this program helped you establish a daily routine that you find useful? (What is it? Explain)
If this remote health monitoring system were to be introduced, would you enrol in this type of program? (Why/why not?)
Q7. For all participants: What is your experience with your access to health services? (Prompts: Living conditions, transport, need and availability of a support person)
To examine the participants’ circumstances and how they could impact the outcomes in participation, experience, and satisfaction
X
X
Additional questions for patients diagnosed with AF: What action had your GP taken? Had your GP added a medication to thin your blood? How do you feel about the results of these actions?
Semi-structured interviews were audio recorded and transcribed using the Microsoft Word transcribing application. At the pilot stage, two researchers (KCW and SAT) checked the first two interviews to ensure that the interview questions focussed on the study aims and research questions and were user-friendly for participants. The first author (KCW) checked the accuracy of and coded the transcripts, while another author (SAT) independently coded the initial eight transcripts. Codes were inductively generated and then fitted into predefined themes in the priori framework. This set up the initial coding frame for KCW to code the remaining interviews. Consensus on the initial and final codes was reached by discussion. The codes were managed using NVivo software (version 12). The full results of the qualitative interviews and the policy implications of the findings will be reported elsewhere. Novel codes were new information synthesized from the interviews. For example, the 20th interviewee mentioned a piece of new information (that is, a novel code) that was not mentioned by interviewees 1 through 19. Duplicate codes were information that previous interviewees had already mentioned.
We describe the steps to identify and visualize the trends of novel and duplicate codes as follows:
To explore codes by generating a matrix of codes for each participant.
To identify novel and duplicate codes of each participant and familiarize with the data.
To import the dataset of novel and duplicate codes into our open-access R package called novelqualcodes (Wong & Quintans, 2023).
To indicate refinements of interview questions in a cumulative frequency graph of novel codes and examine the trend.
To examine the trends of novel and duplicate codes using a stacked column chart. We defined code sufficiency in the priori framework as the point at which we were satisfied with the insights acquired from the codes within each theme.
Results
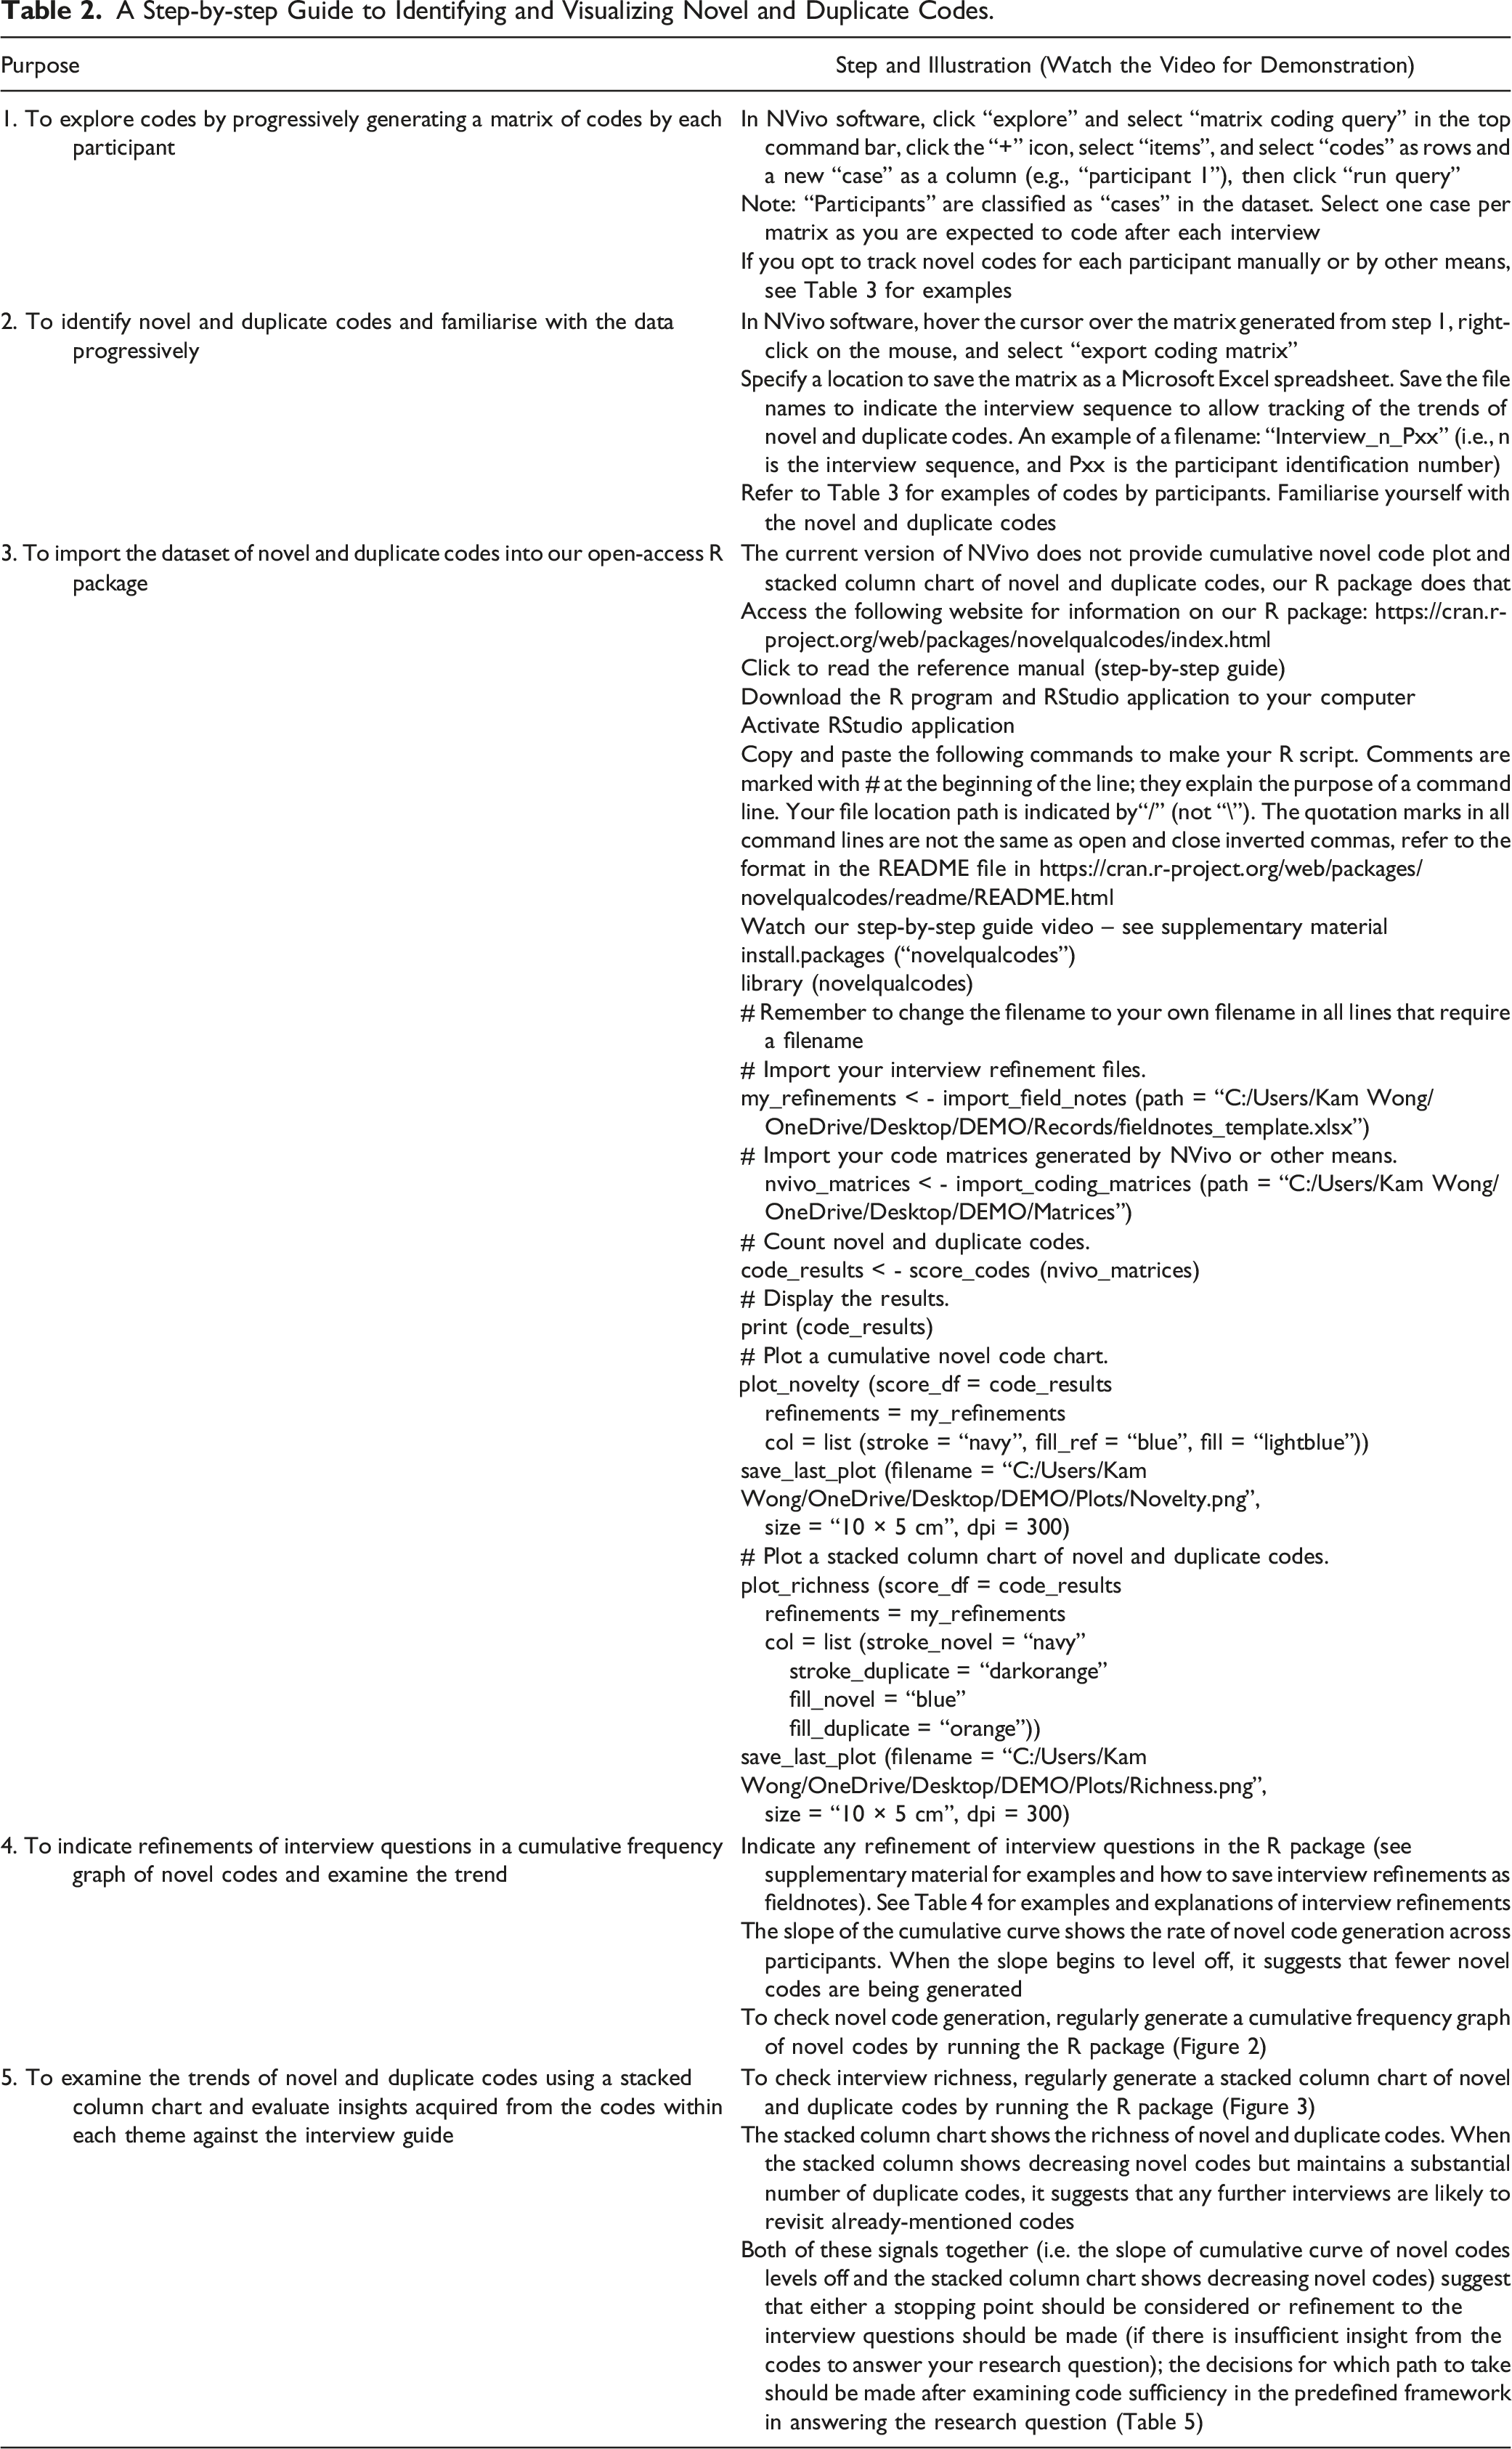
By applying the methods to our case study (MAFS study), we illustrated the process of identifying and visualizing the novel and duplicate codes as shown in Table 2 and provided some examples and explanations using the qualitative interview data from the MAFS study (Wong et al., 2022). We produced a video to demonstrate the systematic approach (Supplementary material).
A Step-by-step Guide to Identifying and Visualizing Novel and Duplicate Codes.
Purpose
Step and Illustration (Watch the Video for Demonstration)
1. To explore codes by progressively generating a matrix of codes by each participant
In NVivo software, click “explore” and select “matrix coding query” in the top command bar, click the “+” icon, select “items”, and select “codes” as rows and a new “case” as a column (e.g., “participant 1”), then click “run query”
Note: “Participants” are classified as “cases” in the dataset. Select one case per matrix as you are expected to code after each interview
If you opt to track novel codes for each participant manually or by other means, see Table 3 for examples
2. To identify novel and duplicate codes and familiarise with the data progressively
In NVivo software, hover the cursor over the matrix generated from step 1, right-click on the mouse, and select “export coding matrix”
Specify a location to save the matrix as a Microsoft Excel spreadsheet. Save the file names to indicate the interview sequence to allow tracking of the trends of novel and duplicate codes. An example of a filename: “Interview_n_Pxx” (i.e., n is the interview sequence, and Pxx is the participant identification number)
Refer to Table 3 for examples of codes by participants. Familiarise yourself with the novel and duplicate codes
3. To import the dataset of novel and duplicate codes into our open-access R package
The current version of NVivo does not provide cumulative novel code plot and stacked column chart of novel and duplicate codes, our R package does that
Click to read the reference manual (step-by-step guide)
Download the R program and RStudio application to your computer
Activate RStudio application
Copy and paste the following commands to make your R script. Comments are marked with # at the beginning of the line; they explain the purpose of a command line. Your file location path is indicated by“/” (not “\”). The quotation marks in all command lines are not the same as open and close inverted commas, refer to the format in the README file in https://cran.r-project.org/web/packages/novelqualcodes/readme/README.html
# Import your code matrices generated by NVivo or other means. nvivo_matrices < - import_coding_matrices (path = “C:/Users/Kam Wong/OneDrive/Desktop/DEMO/Matrices”)
# Count novel and duplicate codes.
code_results < - score_codes (nvivo_matrices)
# Display the results.
print (code_results)
# Plot a cumulative novel code chart.plot_novelty (score_df = code_results
refinements = my_refinements
col = list (stroke = “navy”, fill_ref = “blue”, fill = “lightblue”))
save_last_plot (filename = “C:/Users/Kam
Wong/OneDrive/Desktop/DEMO/Plots/Novelty.png”,
size = “10 × 5 cm”, dpi = 300)
# Plot a stacked column chart of novel and duplicate codes.
plot_richness (score_df = code_results
refinements = my_refinements
col = list (stroke_novel = “navy”
stroke_duplicate = “darkorange”
fill_novel = “blue”
fill_duplicate = “orange”))
save_last_plot (filename = “C:/Users/Kam
Wong/OneDrive/Desktop/DEMO/Plots/Richness.png”,
size = “10 × 5 cm”, dpi = 300)
4. To indicate refinements of interview questions in a cumulative frequency graph of novel codes and examine the trend
Indicate any refinement of interview questions in the R package (see supplementary material for examples and how to save interview refinements as fieldnotes). See Table 4 for examples and explanations of interview refinements
The slope of the cumulative curve shows the rate of novel code generation across participants. When the slope begins to level off, it suggests that fewer novel codes are being generated
To check novel code generation, regularly generate a cumulative frequency graph of novel codes by running the R package (Figure 2)
5. To examine the trends of novel and duplicate codes using a stacked column chart and evaluate insights acquired from the codes within each theme against the interview guide
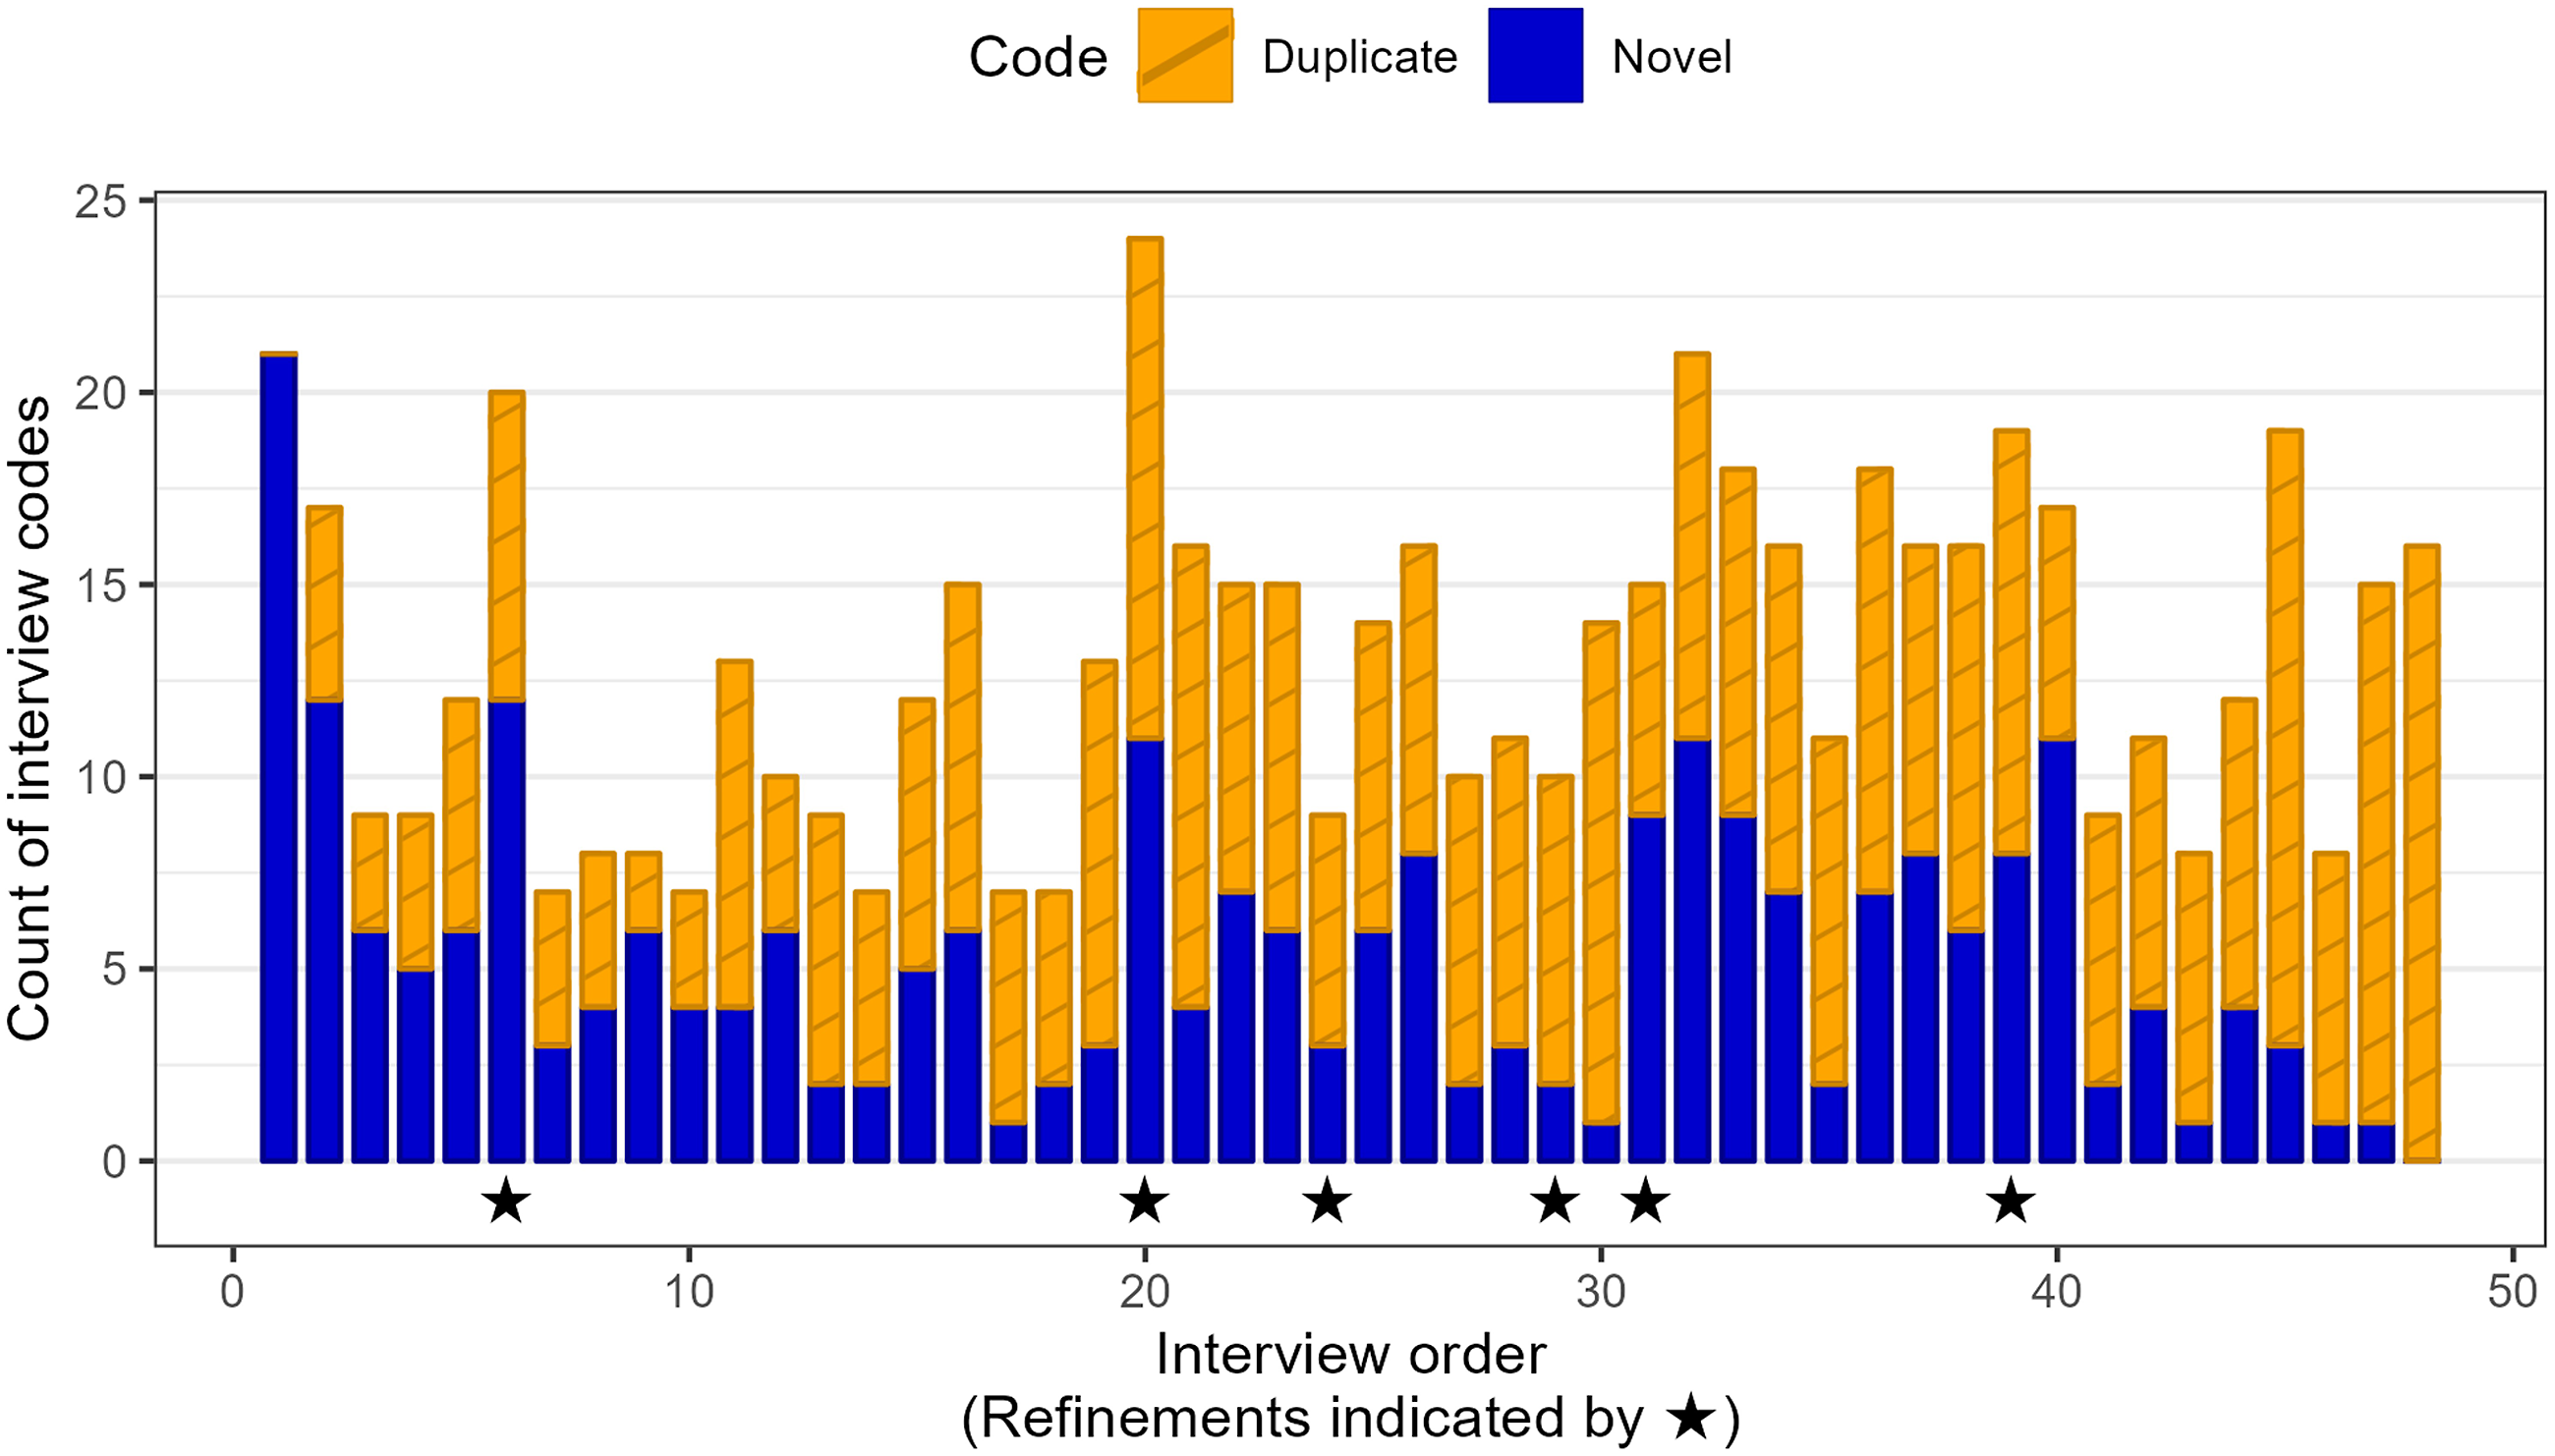
To check interview richness, regularly generate a stacked column chart of novel and duplicate codes by running the R package (Figure 3)
The stacked column chart shows the richness of novel and duplicate codes. When the stacked column shows decreasing novel codes but maintains a substantial number of duplicate codes, it suggests that any further interviews are likely to revisit already-mentioned codes
Both of these signals together (i.e. the slope of cumulative curve of novel codes levels off and the stacked column chart shows decreasing novel codes) suggest that either a stopping point should be considered or refinement to the interview questions should be made (if there is insufficient insight from the codes to answer your research question); the decisions for which path to take should be made after examining code sufficiency in the predefined framework in answering the research question (Table 5)
We show some examples of participant quotes and researcher codes from the clinical trial in Table 3. To make the illustration easy to understand, the participants’ quotes were assigned to two arbitrary participants named Participant A and Participant B. Code frequency was recorded by NVivo software as “references”, which included within-participant duplicate codes. In our approach, within-participant duplicate codes were excluded. We only counted between-participant duplicate codes. In the cumulative curve (Figure 2) and stacked column chart (Figure 3), we presented the novel and duplicate codes instead of NVivo code frequency.
Examples of Matrices of Participant Quotes and Researcher Codes.
Participant Quote
Researcher Code
Explanation
Code Frequency
Novel/Duplicate Code
Participant A
“I could certainly distribute Flyers[of the screening study]. I could give it[the flyer] to the health and wellbeing teams, and they might know people too.” [Participant A]
Participant introduced the screening study to peers
Participant A was the first interview participant. Thus, all the codes were novel
1
1 novel
This code was fitted in theme 1 implementation
“I think the instructions are good. I think that the way that xx[research officer] went through[the instructions] is also very good.” [Participant A]
Personal training to use the electrocardiogram (ECG) device was helpful
This was Participant A’s novel code
1
1 novel
This code was fitted in theme 1 implementation
“I find it[the ECG device] very easy to use.” [Participant A]
The ECG device was easy to use
The researcher coded two quotes to the same code
2
1 novel
“I don’t have any difficulty using it[the ECG device] whatsoever.” [Participant A]
This was Participant A’s novel code
This code was fitted in theme 2 mechanism of impact
Participant B
“xx[The research officer] ran through it[the ECG device] with me, and I found it was quite simple. And he running through it step by step so that we set the whole thing up. And really, I didn’t have a problem after that.” [Participant B]
Personal training to use the electrocardiogram (ECG) device was helpful
Since this code was mentioned in a previous interview, this was a duplicate code
1
1 duplicate
“I do not have any problem in the ECG system, and I understood it very easily.” [Participant B]
The ECG device was easy to use
Participant B’s quotes were coded thrice to a previously mentioned code. Therefore, this was counted as one duplicate code of Participant B
3
1 duplicate
“Well, it[the ECG device] is very, very easy to use. Very effective.” [Participant B]
“It[the ECG device] is very straightforward to use” [Participant B]
“I did it [ECG recording] for seven days [per week]. I was asked to do it five days. I do it seven days. I thought well might keep it going all the time.” [Participant B]
The participant used the ECG device daily
This was participant B’s novel code because it was not mentioned previously
1
1 novel
This code was fitted in theme 2 mechanism of impact
“I just went off all the sugary things, give up my sugar and bread, actually 90% of my alcohol is gone.” [Participant B]
Participant improved his lifestyles after being diagnosed with atrial fibrillation
This was Participant B’s novel code because it was not mentioned previously
1
1 novel
This code was fitted in theme 2 mechanism of impact
“There was one time, a couple of weeks ago, when there was thunder[and] heavy rain, suddenly the (ECG) recording all gone haywire.” [Participant B]
Environmental noises interfered with ECG recording
Participant B’s quotes were coded twice to the same novel code
2
1 novel
“That[environmental noises] can be hard to avoid[because] birds and everything around[the property]” [participant B]
This code fitted in theme 3 context
Cumulative frequency graph of novel codes and the time points corresponding to interview refinements generated by our R package called novelqualcodes.
A stacked column chart of novel and duplicate codes of each participant generated by our R package called novelqualcodes.
Description of the case study
From September 2021 to July 2022, 48 participants were interviewed: 26 (54%) were males, with a mean age of 79 years. Among the participants, 34 (71%) were from urban areas, and 14 (29%) were from rural areas. The median interview duration was 22 minutes. All interviews were conducted by one researcher (KCW).
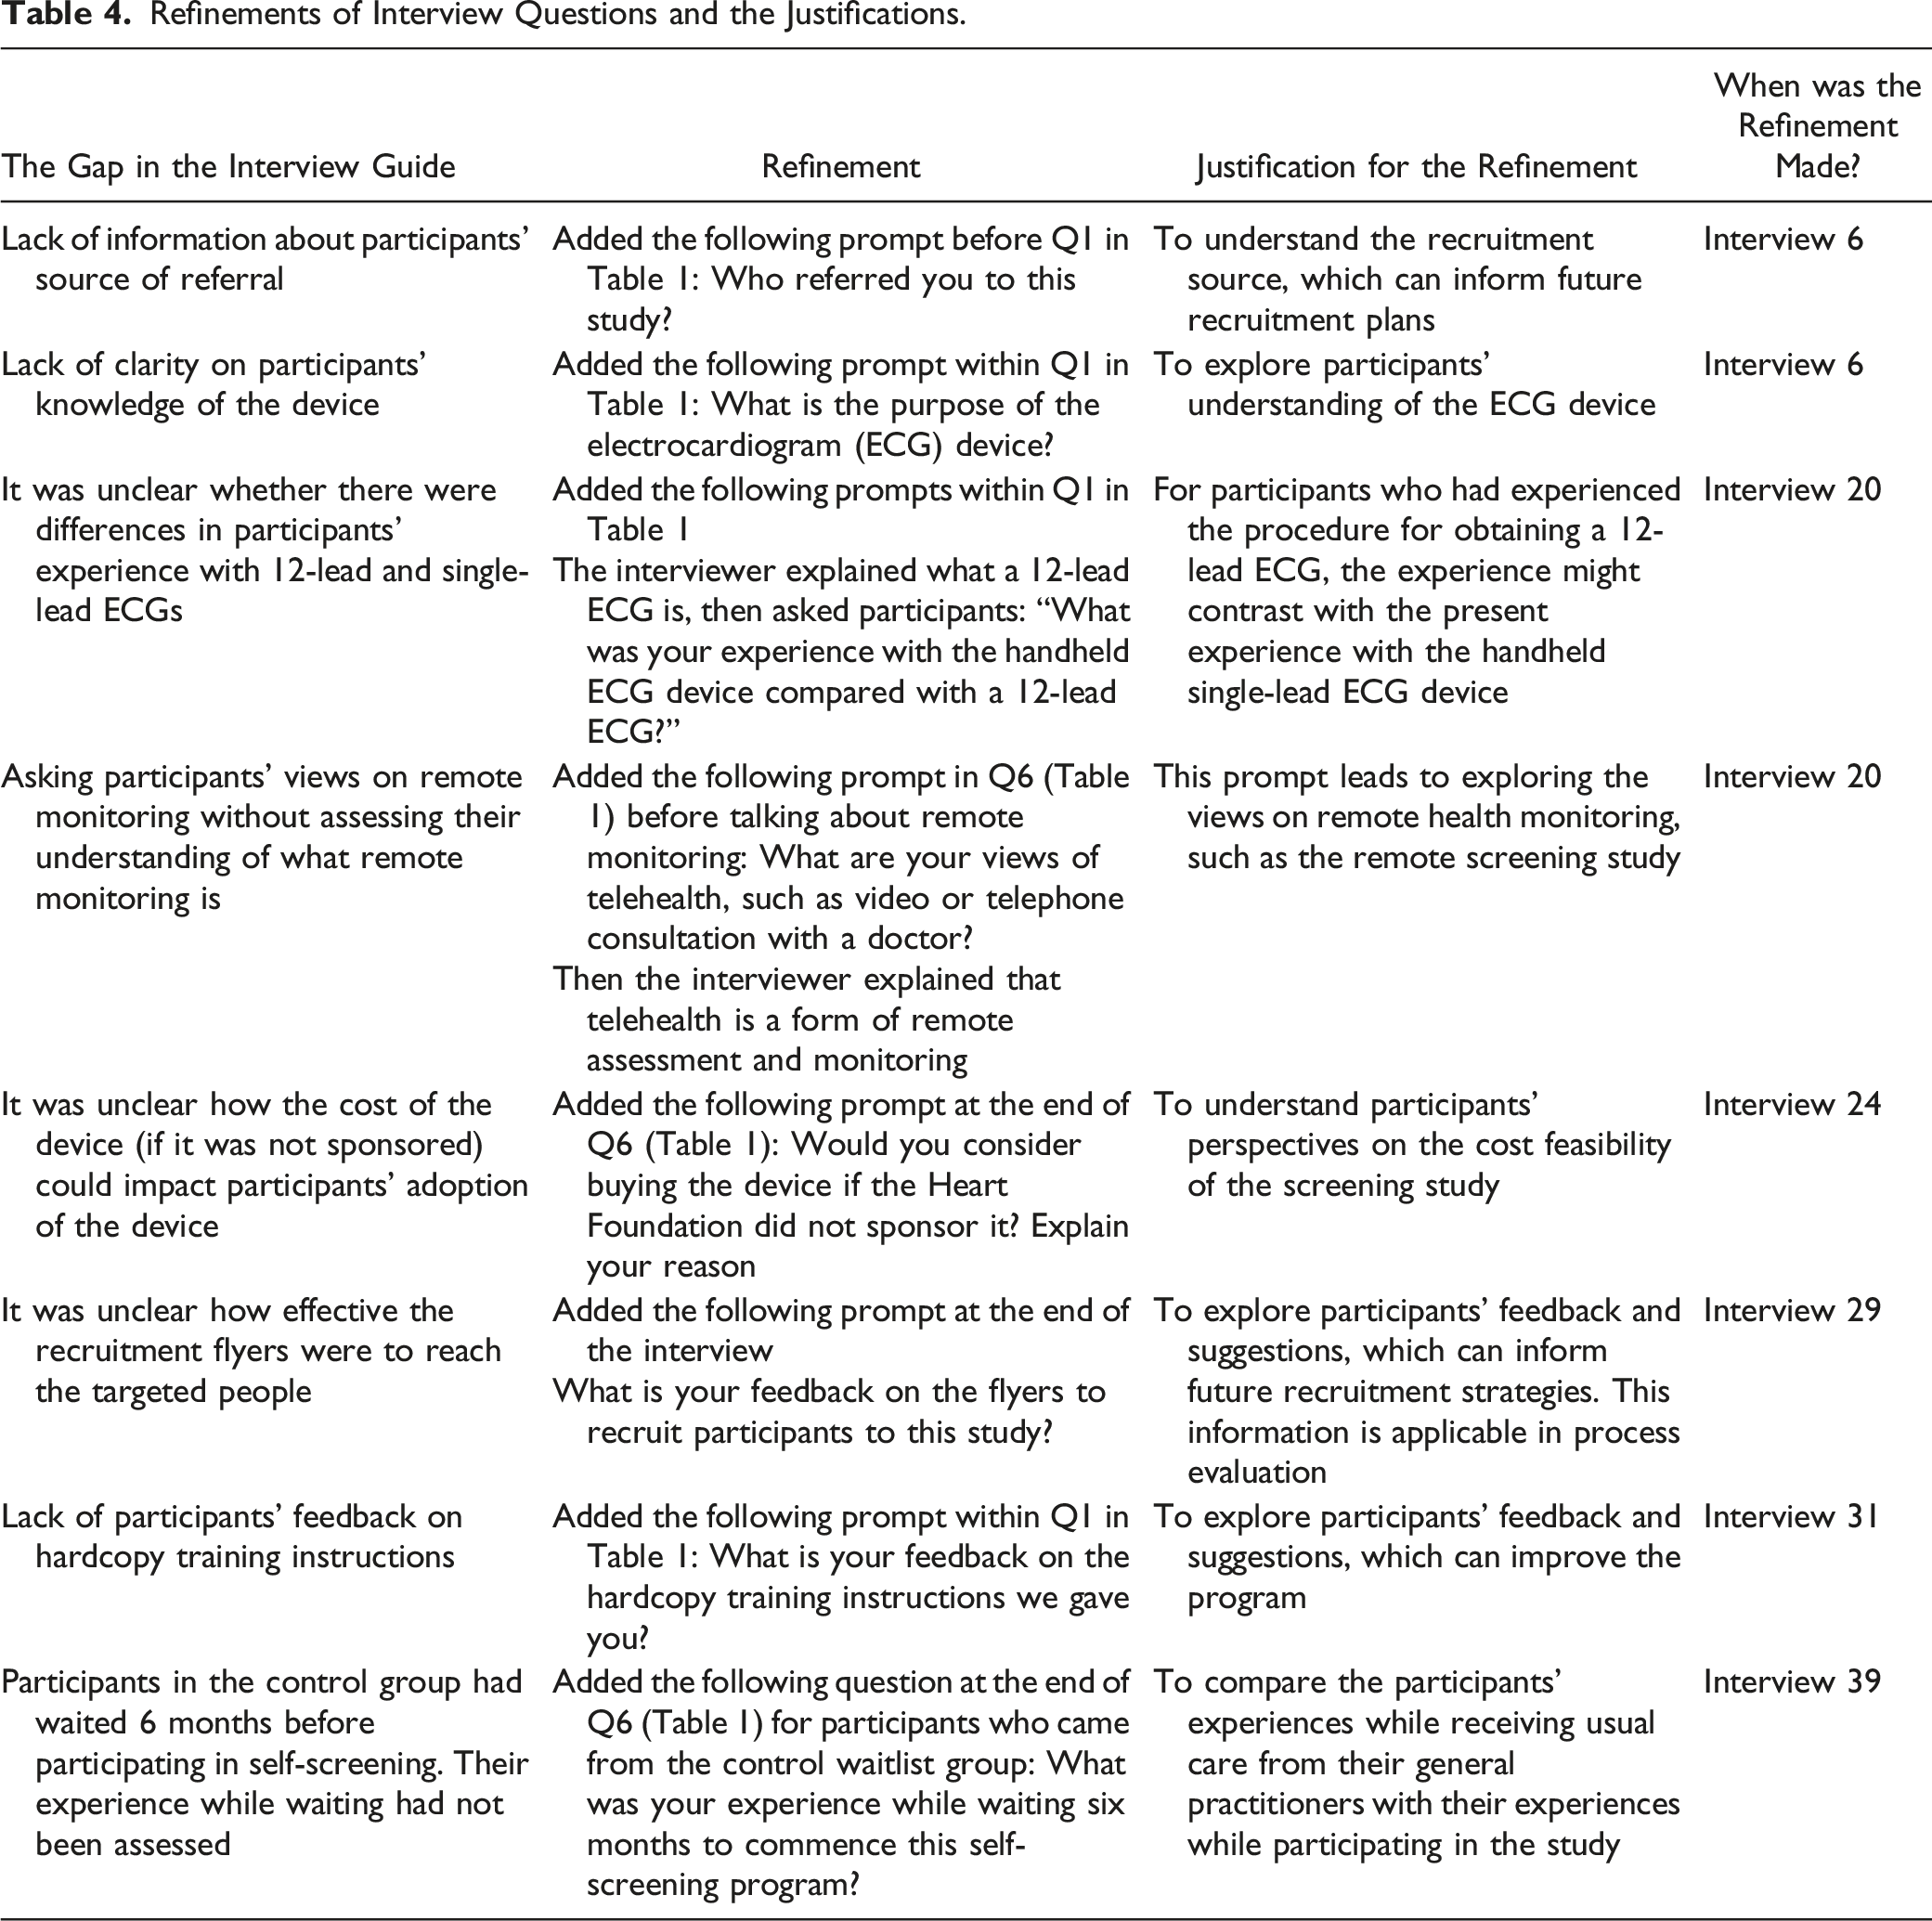
The interview questionnaire was refined on six occasions to include new prompts to elicit an in-depth understanding of some questions and to address the gaps in the Interview Guide (Table 4). The first five refinements were at the 6th, 20th, 24th, 29th and 31st interviews, while the final refinement was at 39th interview targeted at participants coming from the waitlist control group, that is, from 39th to 48th interviews. The refinements and justifications are reported in Table 4. The cumulative frequency graph of novel codes plateaued at the 48th interview (Figure 2).
Refinements of Interview Questions and the Justifications.
The Gap in the Interview Guide
Refinement
Justification for the Refinement
When was the Refinement Made?
Lack of information about participants’ source of referral
Added the following prompt before Q1 in Table 1: Who referred you to this study?
To understand the recruitment source, which can inform future recruitment plans
Interview 6
Lack of clarity on participants’ knowledge of the device
Added the following prompt within Q1 in Table 1: What is the purpose of the electrocardiogram (ECG) device?
To explore participants’ understanding of the ECG device
Interview 6
It was unclear whether there were differences in participants’ experience with 12-lead and single-lead ECGs
For participants who had experienced the procedure for obtaining a 12-lead ECG, the experience might contrast with the present experience with the handheld single-lead ECG device
Interview 20
The interviewer explained what a 12-lead ECG is, then asked participants: “What was your experience with the handheld ECG device compared with a 12-lead ECG?”
Asking participants’ views on remote monitoring without assessing their understanding of what remote monitoring is
Added the following prompt in Q6 (Table 1) before talking about remote monitoring: What are your views of telehealth, such as video or telephone consultation with a doctor?
This prompt leads to exploring the views on remote health monitoring, such as the remote screening study
Interview 20
Then the interviewer explained that telehealth is a form of remote assessment and monitoring
It was unclear how the cost of the device (if it was not sponsored) could impact participants’ adoption of the device
Added the following prompt at the end of Q6 (Table 1): Would you consider buying the device if the Heart Foundation did not sponsor it? Explain your reason
To understand participants’ perspectives on the cost feasibility of the screening study
Interview 24
It was unclear how effective the recruitment flyers were to reach the targeted people
Added the following prompt at the end of the interview
To explore participants’ feedback and suggestions, which can inform future recruitment strategies. This information is applicable in process evaluation
Interview 29
What is your feedback on the flyers to recruit participants to this study?
Lack of participants’ feedback on hardcopy training instructions
Added the following prompt within Q1 in Table 1: What is your feedback on the hardcopy training instructions we gave you?
To explore participants’ feedback and suggestions, which can improve the program
Interview 31
Participants in the control group had waited 6 months before participating in self-screening. Their experience while waiting had not been assessed
Added the following question at the end of Q6 (Table 1) for participants who came from the control waitlist group: What was your experience while waiting six months to commence this self-screening program?
To compare the participants’ experiences while receiving usual care from their general practitioners with their experiences while participating in the study
Interview 39
The total number of novel and duplicate codes for all participants was 632 (median per participant= 13, range 7–24). The total number of duplicates was 375 (median per participant= 8, range 0–16), and the total number of novel codes was 257 (median per participant=5, range 0–21). The insights acquired from the codes against the interview guide are shown in Table 5, and the richness of the novel and duplicate codes is shown in the stacked column chart in Figure 3.
Examples of Insights Acquired From Codes Within the Predefined Framework Specified in the Interview Guide.
Theme and Questions in the Interview Guide (Table 1)
Interview Codes
Insights From the Codes
Sufficiently Answered the Questions in the Interview Guide? Explain
Theme 1 implementation, Q1, Q6, Q7
Characteristics of participants (reach)
Participant characteristics, participant motivation, and participant value of their health
Yes, insights were acquired from responses to questions about their demographic background, living conditions and access to health services
Personal training to use the ECG device
Participant’s confidence (or lack of confidence) in using digital technology and availability of a support person
Yes, insights from participants with and those who lack confidence in using technology
Participant self-recording ECGs
Training and support to self-record ECGs
Yes, identification of enablers for and barriers to self-recording ECGs
Theme 2 mechanism of impact, Q1 to Q6
Participant empowerment
Participant autonomy, convenience, and ability to self-record ECGs
Yes, participants illustrated their ability to self-record ECG and their appreciation of the autonomy and convenience of self-recording
Use of the ECG device
Participants were able to use the device, integration into daily routines, interruptions to participation (e.g. overseas travel), emotional response to the automatic ECG report, and factors affecting the quality of ECG recording
Yes, insights into enablers of and barriers to the use of the ECG device
Participant perception of the values of the screening program
Participants’ judgement of the usefulness of the screening program to self and others, participants trust the credibility of the screening program, and participants’ opinion on the device costs if it was not sponsored by the Heart Foundation of Australia
Yes, insights into perceptions of positive and negative values of the screening program
Participant experience with the screening program
Participant satisfaction (participants’ affective response to the experience with the screening program, the ECG device and atrial fibrillation diagnosis), comparison with the experience of routine standard care, and environmental interferences with ECG recording caused frustrations
Yes, insights into participation satisfaction and frustration with the screening program
Theme 3 context, Q1, Q6, Q7
Participant morbidities
Participant’s ability (or disability) to handle the ECG device (e.g. arthritic fingers), access to (or lack of access to) health services
Yes, insights into participants’ physical abilities to participate and their access to health services
Participant living environment
Availability of internet connection and interferences with ECG recording (interferences from environmental noises and other electronic devices)
Yes, participants identified the enablers of and barriers to self-recording ECGs
Participant’s support-person
Availability of a family member or peer support
Yes, insights into the role of a support person as an enabler
Discussion
We have established and elaborated a systematic approach to improve the transparency of interview refinements and suggested documenting the refinements and the justifications as fieldnotes which can be tracked and graphically displayed using our data visualisation methods, which include identifying and visualizing novel and duplicate interview codes (Table 2 summarizes the steps, and Table 3 shows examples of matrices, participants' quotes and researcher codes). We illustrated the systematic approach and step-by-step utilization of our methods in a video (Supplementary material). We have written an open-access R package called ‘novelqualcodes’ that is freely available to the readers (Wong & Quintans, 2023). Although we used NVivo and Microsoft Excel software to manage our qualitative dataset, the steps illustrated in this article can be adopted and applied using other qualitative management software. We chose R software to generate the graphs for the trends of novel and duplicate interview codes because the R software can read and analyze Microsoft Excel datasets by simply running it when a new dataset is available, and R software is free, easily installed and applied.
Progressive coding is common in a study using semi-structured interviews to collect data; that is, interviews and transcript coding occur concurrently and progressively. This process allows researchers to familiarise themselves with the data while identifying novel codes. Researchers could take note of the contexts under which a novel code is generated, e.g., “environmental interferences with ECG recording”, and address and document remedial action to help participants address the issues of a clinical trial if required and feasible.
Semi-structured interviews provide flexibility to refine interview questions and add new prompts to subsequent interviews (DeJonckheere & Vaughn, 2019). These flexibilities are necessary to elicit an in-depth understanding of the research question. Our methods provide transparency and reasons for interview refinements. The final refinement was in the 39th interview because it was necessary to add new prompts to assess participants in the control group who came on board to the study six months later than the intervention group as per the study’s design (Wong et al., 2022). Hence, the study’s design affected the time point at which refinement of interview questions was necessary and justified. Figure 2, Figure 3 and Table 4 show the refinements of interview questions and the reasons. The refinements can be adopted and incorporated into future studies.
All interview codes fit into the predefined framework (Moore et al., 2015) consist of the main themes Implementation, Mechanism of Impact, and Context. Table 3 showed some example codes from the participants’ interviews: “Participants introduced the screening study to peers” and “Personal training to use the electrocardiogram (ECG) device was helpful” fit in Theme 1 Implementation; “Participant reported that the ECG device was easy to use”, “Participant used the ECG device daily” and “Participant improved lifestyle after being diagnosed with atrial fibrillation by the study” fit in Theme 2 Mechanism of Impacts; and the code “Environmental interferences to ECG recording” fit in Theme 3 Context.
We examined the diminishing trend of novel codes as the number of interviews increased as shown in the cumulative frequency graph of novel codes (Figure 2) and the trends and richness of the novel and duplicate codes in the stacked column chart (Figure 3) and reviewed the insights of codes fitted into the predefined framework (Table5). We were satisfied with the richness of data, i.e., the insights acquired from the codes in answering the interview questions set in the Interview Guide (Table 5). With the graphical visualisations and code sufficiency within the framework, we addressed our research question and objective, i.e., evaluation of the feasibility of implementing the intervention in the MAFS study (Table 5); hence, we decided to stop at the 48th interview. We acknowledged that the decision of the stopping point is contextual and subjective to the research question and objective. We defined code sufficiency as the point when researchers were satisfied with the insights of the codes, i.e., the interviews had sufficiently answered questions in the Interview Guide. However, if there are limited insights from the codes for a question, the researcher should declare the insufficiency and make it transparent whether the insufficiency has any impact on the decision to stop interviewing. Guest G and colleagues used data from a study involving 60 in-depth interviews and analysed the data using thematic analysis. They reported that after analyzing the first batch of 30 interviews, they generated 109 codes, of which 92% were found in the first 12 interviews. In their second batch of 30 interviews, they generated 114 codes and found 5 new codes (Guest et al., 2006). However, our approach was different in two ways: (a) we applied a predefined framework, coded interviews into the framework, examined the trends of novel and duplicate codes and the insights provided by the codes in each theme, and (b) we included refinements of interview questions and examined the impacts of the refinements on the trends of novel and duplicate codes.
Strengths
This methodology provides transparency to readers on several aspects: (a) the underpinning Critical Realism approach and the Medical Research Council Guidance of Process Evaluation informed the formulation of our Interview Guide, (b) time points when refinements of interview questions occurred and the justifications (Figure 2), and (c) visualization of the trends of novel and duplicate codes (Figures 2 and 3). With the review of the richness and insights of the codes fitted in the predefined framework (Table 5), this methodology could help researchers decide the stopping point. Researchers who do not want to use the software to generate graphical illustrations can track the novel and duplicate codes using other means (Table 3) and summarise the insights of the novel codes in answering their research questions as in Table 5.
Caveats
The methodology applied in this paper is restricted to semi-structured interviews analyzed using the framework method. The quantification of novel and duplicate codes and the graphical presentations help researchers in deciding when to stop recruiting participants to interview. However, this article does not aim to propose an approach to determine the sample size for semi-structured interviews, and the methodology does not provide a definite indication of code or theme saturation, which is contextual and subjective to the research purpose and interpretative process (Braun & Clarke, 2021).
Conclusions
In a progressive coding process, we have illustrated a new paradigm of systematic and practical methods to identify and visualize the trends and richness of novel and duplicate interview codes and provide transparency of interview refinements. Our open-access R package called novelqualcodes and the illustration video help users to generate cumulative frequency graphs of novel codes and stacked column charts of novel and duplicate codes; these visualizations, coupled with a review of the richness and insights of interview codes fitted in the predefined framework, help researchers to decide the stopping point of interviews.
Supplemental Material
Supplemental Material - A Systematic Approach to Improving the Transparency of Interview Refinements and Data Sufficiency in Semi-Structured Interviews: An Illustration Using the Mass Atrial Fibrillation Screening Study
Supplemental Material for A Systematic Approach to Improving the Transparency of Interview Refinements and Data Sufficiency in Semi-Structured Interviews: An Illustration Using the Mass Atrial Fibrillation Screening Study by Kam Cheong Wong, Steven A Trankle, Desi Quintans, Tu N Nguyen, Tim Usherwood, and Clara K Chow in International Journal of Qualitative Methods.
Supplemental Material
Footnotes
Acknowledgements
We would like to thank the “Mass Atrial Fibrillation Screening Team” at Westmead Applied Research Centre, University of Sydney, for their assistance in implementing the study.
Declaration of Conflicting Interests
The author(s) declared no potential conflicts of interest with respect to the research, authorship, and/or publication of this article.
Funding
The author(s) disclosed receipt of the following financial support for the research, authorship, and/or publication of this article: We would like to thank the Heart Foundation of Australia for funding the “Mass Atrial Fibrillation Screening” study (Vanguard Grant number 102936). The study was approved by the Human Research Ethics Committee, University of Sydney (project number 2020/680) and registered with the Australian New Zealand Clinical Trials Registry (ACTRN12621000184875).
ORCID iDs
Kam Cheong Wong
Desi Quintans
Supplemental Material
Supplemental material for this article is available online.
References
1.
BraunV.ClarkeV. (2021). To saturate or not to saturate? Questioning data saturation as a useful concept for thematic analysis and sample-size rationales. Qualitative Research in Sport, Exercise and Health, 13(2), 201–216. https://doi.org/10.1080/2159676X.2019.1704846
2.
DeJonckheereM.VaughnL. M. (2019). Semistructured interviewing in primary care research: A balance of relationship and rigour. Family medicine and community health, 7(2), Article e000057. https://doi.org/10.1136/fmch-2018-000057
3.
GaleN. K.HeathG.CameronE.RashidS.RedwoodS. (2013). Using the framework method for the analysis of qualitative data in multi-disciplinary health research. BMC Medical Research Methodology, 13(1), 117. https://doi.org/10.1186/1471-2288-13-117
GuestG.BunceA.JohnsonL. (2006). How many interviews are enough? An experiment with data saturation and variability. Field Methods, 18(1), 59–82. https://doi.org/10.1177/1525822x05279903
6.
GuestG.NameyE.ChenM. (2020). A simple method to assess and report thematic saturation in qualitative research. PLoS One, 15(5), Article e0232076. https://doi.org/10.1371/journal.pone.0232076
7.
HenninkM. M.KaiserB. N.MarconiV. C. (2017). Code saturation versus meaning saturation: How many interviews are enough?Qualitative Health Research, 27(4), 591–608. https://doi.org/10.1177/1049732316665344
8.
MooreG. F.AudreyS.BarkerM.BondL.BonellC.HardemanW.MooreL.O’CathainA.TinatiT.WightD.BairdJ.Author (2015). Process evaluation of complex interventions: Medical Research Council guidance. BMJ, 350, h1258. https://doi.org/10.1136/bmj.h1258
9.
PalinkasL. A.HorwitzS. M.GreenC. A.WisdomJ. P.DuanN.HoagwoodK. (2015). Purposeful sampling for qualitative data collection and analysis in mixed method implementation research. Administration and policy in mental health, 42(5), 533–544. https://doi.org/10.1007/s10488-013-0528-y
10.
PattonM. Q. (2014). Qualitative research and evaluation methods (4th ed.). Sage Publications.
11.
SaundersB.SimJ.KingstoneT.BakerS.WaterfieldJ.BartlamB.BurroughsH.JinksC.JinksC. (2018). Saturation in qualitative research: Exploring its conceptualization and operationalization. Quality and Quantity, 52(4), 1893–1907. https://doi.org/10.1007/s11135-017-0574-8
12.
TrankleS. A.UsherwoodT.AbbottP.RobertsM.CramptonM.GirgisC. M.RiskallahJ.ChangY.SainiJ.ReathJ.ReathJ. (2019). Integrating health care in Australia: A qualitative evaluation. BMC Health Services Research, 19(1), 954. https://doi.org/10.1186/s12913-019-4780-z
13.
WongK. C.NguyenT. N.MarschnerS.TurnbullS.BurnsM. J.NeJ. Y. A.GopalV.IndrawansaA. B.TrankleS. A.UsherwoodT.KumarS.LindleyR. I.ChowC. K.Author (2022). Patient-led Mass screening for atrial fibrillation in the older population using handheld electrocardiographic devices integrated with a clinician-coordinated remote central monitoring system: Protocol for a randomized controlled trial and process evaluation. JMIR Research Protocols, 11(2), Article e34778. https://doi.org/10.2196/34778
14.
WongK. C.QuintansD. (2023). Novelqualcodes: Visualise the path to a stopping point in qualitative interviews based on novel codes. R Package Version 0.13.0. https://cran.r-project.org/package=novelqualcodes
Supplementary Material
Please find the following supplemental material available below.
For Open Access articles published under a Creative Commons License, all supplemental material carries the same license as the article it is associated with.
For non-Open Access articles published, all supplemental material carries a non-exclusive license, and permission requests for re-use of supplemental material or any part of supplemental material shall be sent directly to the copyright owner as specified in the copyright notice associated with the article.