
Abstract
Videos are ubiquitous and have significantly impacted our communication and information consumption. The video, as data, has helped researchers understand how human interactions and relationships develop and change, and how patterns emerge in various circumstances and interpretations. Given the expanding relevance of video data in social science and medical research and the constant introduction of new formats and sources, it is critical to be able to conduct a thorough analysis of this multimodal data. However, the few methodologies (e.g., Actor Network Theory, Picture Theory) appropriate to video data analysis lack detailed guidelines on how to select, organize, and examine the multimodality of video data. This article aims to overcome this practice or methodological gap by proposing and demonstrating the Visual-Verbal Video Analysis (VVVA) method, a six-step framework adapted from Multimodal Theory and Visual Grounded Theory for organizing and evaluating video material according to the following dimensions: general characteristics of the video; multimodal characteristics; visual characteristics; characteristics of primary and secondary characters; and content and compositional characteristics including the transmission of messages, emotions, and discourses. This article also looks at the theories underlying video data analysis, focusing on Grounded Theory and Multimodality Theory, and provides multiple examples of coding and interpretive processes to deepen understanding and comprehension. The VVVA data extraction matrices provide a systematic coding approach for verbal, visual, and textual content, allowing for structured, coherent extraction that supports the discovery of patterns and links among disparate types of information. The VVVA method may be applied to a wide range of video data in social and medical sciences that vary in length and originate from different sources (e.g., open access web sources, pre-recorded organizational videos and recordings created for research purposes). The VVVA method effectively tracks the ongoing research process, and can manage data sets of various sizes.
Introduction
Video technologies in today’s global, videocentric environment massively influence modes of communication and information consumption (Carlow University, 2021; Cuesta-Valiño et al., 2022; Panarello et al., 2019; Rynyk, 2021). Smartphones, laptops, tablets, even smart watches connect people to social media platforms like Facebook, TikTok, Snapchats, Instagram, and Twitter (eMarketer, 2021; Montag et al., 2021). Social media videos support entertainment (Rieger & Klimmt, 2019), newscasts and general information (Lowenstein-Barkai & Lev-on, 2021; Rieger & Klimmt, 2019; Stancheva, 2022), quests for new products (Curran, 2020), and shared moments in daily life. With at least one “smart TV (or smart something)” in American homes, the number of TV households worldwide will likely surpass 1.8 billion by 2026 (Digital TV Research, 2021).
Video users increased from 2.78 billion in 2019 to 3.37 billion in 2022, and the number of worldwide viewers is continuously increasing (eMarketer, 2021). Moreover, three billion people streamed online or downloaded video material at least once a month during this period, using different devices, while North American rates were around 50% for daily, and 28% for weekly, streaming (Jacobs Media, 2021). In all, one billion hours of video content were consumed daily on YouTube, two billion videos on Twitter, and 210 million Snapchats (Rynyk, 2021).
Videos surpass other types of information in popularity due to their accessibility on demand and the sheer volume of videos available (Liu et al., 2021). Many people prefer videos for their visual cues like facial expressions and body language in addition to vocal nuances, which helps storytelling (Medinger & Brodsky, 2018). In fact, 1 minute of video footage is equivalent to 1.8 million words (Marketwired, 2014).
Yet, not only do people heavily consume video content, they also generate their own videos (Carlow University, 2021). Amateur film makers are using digital technologies to create personal narratives, opening their everyday realities, challenges and struggles to public view and sometimes documenting emotional experiences related to physical or mental illnesses (Baldwin, 2007; Boltanski & Burchell, 1999; Ferrari et al., 2022; Hőijer, 2003; Koike et al., 2017; Sampogna et al., 2017). Digital stories support emotional growth and help individuals “…come to terms with disgrace around sensitive personal issues and marginalization while providing hope and encouragement to others” (Ferrari et al., 2022: p.8). However, these stories also serve the more intentional purpose of raising public awareness about issues. With the capacity to promote widespread reactions and interactions, even to challenge cultural standards, these first-person narratives may also provide material for marketing campaigns or fundraisers (Jerslev, 2016; Khamis et al., 2016; Marwick, 2015; Törhönen et al., 2020). Defined as “a short, first-person video-narrative created by combining recorded voice, still and moving images, and music or other sounds” (Center for Digital Storytelling, n.d.), digital stories include live videos or clips captured on cellphones (called “cellphilms” (Shutsko, 2020)), personal cameras or digital devices, and shared on social media platforms (MacEntee et al., 2016).
In effect, videos, as forms of video data gleaned from all these devices, not to mention public events and places (e.g., public security cameras) or educational and healthcare settings are revolutionizing research prospects in the social sciences (Nassauer & Legewie, 2022; Rosenstein, 2002) and medicine (Asan & Montague, 2014; Guerlain et al., 2004; Topor et al., 2017). Social science researchers use video data to evaluate teaching and learning environments (Jewitt & Price, 2012; Lacković, 2018; Ramey et al., 2016; Rosenstein, 2002; 2013; Walker & Boyer, 2018), courtroom proceedings (Bannon & Adelstein, 2020) and in ethnographic research (Hackett et al., 2015), whereas researchers in the medical sciences have focused more on observation, teaching and training, for example, research on doctor-patient interactions (Kazmi, 2013; Pearce et al., 2010), training of medical personnel (Topor et al., 2017), surgical training and patient safety protocols (Guerlain et al., 2004; Topor et al., 2017). Video-based research and analysis thus offer opportunities to look beyond spoken text and capture the many dimensions of human life and social activity in various fields (Ramey et al., 2016).
Qualitative video data analysis is an interpretive endeavor encompassing many modalities of engagement that aims to reach an integrated understanding of social situations that occur in, and contribute to, video settings in particular (Knoblauch, 2006), as well as the purposes for which videos were made and shared (Ramey et al., 2016). Video data provide a starting point for understanding how human interactions and relationships develop and evolve, and how patterns emerge within various frameworks and interpretations (Goldman & McDermott, 2014). A comprehensive evaluation of the methods used to evaluate this type of visual data is of critical importance, given the increasing relevance of video data for social science and medical research and the regular emergence of new types and sources of video data.
A vast body of literature exists on the analysis of visual data in qualitative research, using content analysis, thematic, and discourse analysis, among other approaches to visual data management. Researchers have also provided guidance on the use of visual data to support and complement other forms of qualitative analysis, and on how to ensure ethical data collection and analysis. For example, Collier and Collier (1986) discussed the use and analysis of photographs in visual anthropology to better understand cultural practices and social processes. Pink (2013) explored the use of photography and video in ethnographic research for capturing and analyzing social interactions and cultural practices. Other analysts (Knowles & Cole, 2007; Rose, 2001, 2022) provided a comprehensive overview of arts-based and visual research methods that includes qualitative approaches to the analysis of visual materials. This literature demonstrates the importance of visual data as sources of information in qualitative research and provides some rigorous and systematic guidance on the analysis and interpretation of visual data, particularly still images and photographs. Yet, despite considerable availability of information and guidelines on the use and analysis of still images and photographs as visual data in qualitative research, little research to our knowledge has relied on specific processes to assess, organize, and analyze video data qualitatively (Ramey et al., 2016; Trombeta & Cox, 2022). This paper proposes a comprehensive method for video analysis, outlining a series of concrete steps involved in video analysis, and explaining in detail how to extract and present video data in ways that maximize evaluation of the content. The Visual-Verbal Video Analysis (VVVA) method provides a complete set of guidelines for researchers pursuing visual analysis in the social sciences, humanities, and medicine.
The following section reviews the most common theoretical frameworks for gathering and analyzing visual data, evaluating their strengths and limitations. The second section of the article presents the VVVA method created specifically for visual data, particularly short videos, as a practical alternative.
Analysis of Visual Data: An Overview of Relevant Theories
Actor Network Theory, Picture Theory, Grounded Theory and Multimodality Theory offer insights on visual data analysis. However, not all of them focus specifically on video data or provide clear guidelines on how to organize, describe and interpret video content. Actor Network Theory, for instance, encourages research into human and non-human factors in countless networks, valuing the complexity of interrelationships. But the approach has been critiqued for lack of clarity on how actors should be perceived or how their actions should be studied and evaluated (Kaghan & Bowker, 2001; Law & Hassard, 1999; Wacker, 1998; Williams & Edge, 1996). Picture Theory promotes visual representation over words (Mitchell, 1995), making a significant contribution to visual analytical approaches. Yet this theory focused on still pictures and images has yet to be applied to video analysis.
Grounded Theory and Multimodality Theory have both been used with content and visual analysis of video data in the social sciences and medicine. As described below, these theories present important advantages for working with visual data, but also disadvantages. Theories like Actor Network Theory, Picture Theory, and Multimodality Theory present ways to “make sense of” certain aspects of the empirical/visual world; whereas Visual Grounded Theory offers an overall perspective for seeing and interpreting the world (Abend, 2008).
Grounded Theory locates emergent theory in data collected from empirical studies, rather than pre-existing theory, giving Grounded Theory its name. Developed originally by Glaser and Strauss (1967), later theorists discovered a third dimension within the postmodern paradigm (Charmaz, 2005; 2006; Clarke et al., 2017). Grounded Theory assumes that reality encompasses multiple constructions with the knower subjectively linked to what can be known, leading to a set of principles and practices that allow for flexibility in theorizing around people’s experiences in constructing their realities (Charmaz, 2009). Grounded theory has influenced various disciplines, such as psychology, nursing, medicine, social work, social sciences, and education (Creswell & Poth, 2016; Glesne & Webb, 1993; Holton & Walsh, 2017; Timmermans & Tavory, 2012).
Researchers, notably Konecki (2011), have viewed Grounded Theory as well suited for interpreting visual concepts of individuals and groups within various cultural settings and environments, establishing interconnections among them (Clarke & Keller, 2014; Clarke, 2005; Gold, 1997). Photographs, photo albums, video recordings, paintings, graffiti, photo blogs, video blogs, etc. are windows into these “lived” experiences. Visual Grounded Theory, an offshoot of Grounded Theory, has successfully combined textual and visual data analysis, relying on visual data for constructing categories, describing their properties, and generating hypotheses (Konecki, 2019; Mey & Dietrich, 2017). Adele Clarke (2005) made an initial attempt to link visual data with grounded theory in conceptualizing Situational Analysis. Before undertaking analysis, Clarke proposes four steps: deciding, locating, collecting and tracking the materials best suited to the research situation (Clarke, 2005). The analysis of images may entail use of analytical memos, and specifically three types: “locating” (who produces an image, for what audiences and social world); “the big picture” (writing the narrative description of the image, dividing the picture into a smaller part to describe details); and “specification” (deconstructing the image by observing it in different ways) (Clarke, 2005: p.223).
Using some of Clarke’s (2005) recommendations, Konecki (2011) developed a comprehensive framework for Visual Grounded Theory based on “multislice imagining” (Konecki, 2019: p.8), a concept recognizing multiple layers in visual data that must be examined to fully comprehend visual courses (Konecki, 2011). In this approach, the first step is to assess whether visual data are the main, or an auxiliary, source of material for analysis. Konecki (2011) proposes four steps for describing the multilayered context of visual data: 1. Analysis of the context of creation, the act of creating pictures and images; 2. Participation in demonstrating/communicating visual images; 3. Communication of the visual product, its content and stylistic structure (perceived differently by different recipients, who are active co-creators of visual images); 4. Reception of an “image” and visual aspects of presenting/representing something (“slices” of the visual dimension of the psycho-social processes). Finally, the steps in traditional Grounded Theory, including open coding, memo writing, selective coding, theoretical memo writing, and comparative analysis, are employed for moving from the visual data to theory creation. Theoretical sampling, an iterative process of analysis and data gathering, emerges as the final step in the analytical process of coding and writing memos, to identify the conceptual properties and saturate the category.
There are various advantages to employing Visual Grounded Theory as a research method for managing and analyzing visual data. Of significance is the ability of this theory to provide a constructive understanding of the background in visual production as well as how images are represented and interpreted. Multislice imagining provides clear steps and procedures for visual analysis and theory creation. Moreover, Visual Grounded Theory embraces the totality of a scenario and embedded visual processes, adding structure and broader applications than those permitted by examining text only (Konecki, 2019). Despite the benefits of Grounded Theory in qualitative research, Visual Grounded Theory has not been used extensively in visual data analysis (Konecki, 2011), as visual data are often auxiliary to the project and involve still images rather than videos.
Multimodality Theory, originated by Gunther Kress, is a crucial perspective for conducting social communication research at the interface of language and visual factors (Hodge & Kress, 1988; Kress, 2010). This theory examines how individuals communicate and engage with one another in modes other than writing, such as speech, gestures, looks, or other visual forms (Kress & Van Leeuwen, 2001). Mode refers to the “information exchange form between human brain and the environment” (Hong, 2012: p.212). Other modes may be needed in interpersonal communication before the meaning presented by a speaker is sufficiently clear and detailed for the listener (Hong, 2012).
Given the strong foundations of Multimodality Theory for simultaneously interpreting and comprehending visual and non-visual data, this theory is used for examining different modes of communication through pictures (still or moving), video, audio, and three-dimensional materials (Dicks, 2019). Multimodality theory has greatly influenced the creation of multimodal frameworks in discourse analysis, situational sociology, and perceptual anthropology. Each area has developed particular conceptions of the research topic, distinct concepts for describing essential analytical processes involving background and context, and distinct analytical languages (Dicks, 2019). Multimodality Theory has a particular lineage drawn on studies of interpersonal communication in sociology, anthropology, and psychiatry (Jones, 2021), but has been applied in disciplines that use multimodal and visual data sets, e.g., media archaeology, education, information design, ethnography, anthropology, sociology and psychiatry (Hiippala, 2021).
Multimodality Theory offers significant benefits for data analysis, ranging from text, to gesture, posture and gaze, to color and font selections, to images and, most crucially, videos, as advances in technology provide multiple ways of communicating in everyday interactions (Dicks, 2019; Kress, 2000; 2010). Rose, for example, offers three distinct types of modalities (technological, compositional, and social), each making a unique contribution to understanding different forms of visual data (Rose, 2001). Technical modalities include television, internet, and paintings, all of which intend to be viewed by, or to augment, natural eyesight. Formal compositional modalities include content, color, and structure used in creating applicable images. Finally, social modalities take in various economic, social, and political interactions, assessed by Multimodality Theory in terms of how they are viewed and utilized.
There are, however, disadvantages to Multimodality Theory, including the complexity of multimodal analysis which has limited theoretical development in dynamic media such as video, film and interactive digital media (O'Halloran, 2016). Other researchers suggest that the multimodal approach may be overly time-consuming and lengthy and, as such, inadequate for managing large data sets, while leading to unjustified conclusions or conclusions based on limited samples (Bateman, 2008; O'Halloran, 2016). With numerous beneficiaries, Multimodality theory does, however provide a unique foundation for researching and analyzing visual data, particularly videos.
Visual-Verbal Video Analysis: A Comprehensive Analytical Method
We developed the VVVA method to provide social science and medical researchers with a new perspective for managing video data analysis more efficiently while fully exploiting the information embedded in these data. Based on Multimodality and Visual Grounded Theories, VVVA is a multilayered, qualitative approach to content analysis featuring a structured, detailed analytical process that is easy to follow.
VVVA identifies distinct analytical principles particular to video data that support an in-depth and interpretative analysis of both verbal and visual content. Our method employs a comprehensive approach for identifying relations between words and visuals, enhancing comprehension, and developing accurate knowledge by digging deeply into the content and analyzing the many layers and features of video data, then identifying connections between them. VVVA brings together all the elements represented in video data, such as setting, goals and objectives, perceptions, relevance, and multimodal characteristics into a step-by-step analytical process.
Evaluation of Video Data Using the VVVA Framework
Video data reveal a variety of dialogic modalities (Ramey et al., 2016) through which individuals appearing in videos share information on language, gestures, facial expressions, looks, body posture, motion, decorations, objects, and settings where the videos were recorded (Goodwin, 2013; Hall, 1999; Ramey et al., 2016). Like verbal and textual data, visuals provide a wealth of information that should be incorporated into the data analytical process (Pink, 2013). However, systematically capturing all this information poses challenges for analysis.
While the VVVA method follows the same core structure as other qualitative approaches (Braun & Clarke, 2006; Elo & Kyngas, 2008) for data collection, extraction, coding, and reporting (inductive design), VVVA emphasizes the management of video data according to six steps: 1. Collecting, organizing and reviewing data; 2. Transcribing verbal data; 3. Choosing units of analysis; 4. Extracting and coding data; 5. Organizing, describing and interpreting extracted data; and 6. Reporting findings (Figure 1). VVVA also relies on abductive research designs in establishing the main analytical categories for video data in social sciences and medicine. Table 1 describes six steps for analyzing video data using the VVVA framework, organizing the data into five categories The six steps of Visual-Verbal Video Analysis (VVVA). Six Steps for Analyzing Video Data Using the VVVA Framework.

Collecting, Organizing and Reviewing Data
Drawing on Visual Grounded Theory, visual data may be collected through video recording (Konecki, 2011), or by “locating” (Clarke, 2005) the visuals and saving them as a digital file for later analysis and display. Researchers may work with different types and sources of video data involving a range of characteristics and durations. Video data used in social science and medical research vary from recorded research interviews (Walker & Boyer, 2018), teaching and learning videos (Jewitt & Price, 2012; Lacković, 2018; Rosenstein, 2002; 2013), courtroom proceedings (Bannon & Adelstein, 2020), movies, documentaries or TV shows (Burghardt et al., 2020), to personal videos (e.g., digital stories, social media videos) (Ferrari et al., 2022) or those produced in other research settings (Alam et al., 2020; Nassauer & Legewie, 2022) including cellphilms (MacEntee et al., 2016), and instructional videos in medicine (Guerlain et al., 2004; Kazmi, 2013; Pearce et al., 2010). Sources probed by researchers include open access web sources, pre-recorded organizational videos, and recordings from previous studies.
Regardless of source, video data need to be properly downloaded, stored, organized, shared with other researchers (if applicable), and backed up to lessen the risk of data loss, particularly for data collected on the Web. The data must be identified with simple labels, tags, and collection dates for easy access. Data storage should be in a secure location accessible to all researchers working with the data. When collecting and sharing video data for research purposes, it is especially important to consider the ethical implications of data storage, as well as the selection of secure and appropriate platforms for data sharing. Video data for research projects may be stored in various ways depending on size and format of the data. Common storage methods include external hard drives, cloud-based storage services (e.g., institutional servers, Dropbox or Google Drive), but the chosen storage method must be secure, and comply with all relevant data protection regulations. The ethical sharing of video data and related screenshots requires, above all, that the privacy and confidentiality of participants in the video are protected. Several programs and platforms allow for sharing videos and images ethically, including password-protected websites, secure file-sharing platforms, or data repositories specifically designed for research data. It is important to select a platform that provides appropriate security measures for the protection of data being shared.
After properly collecting, organizing, and storing the video data, researchers need to become well acquainted with the video content. Two researchers working independently for enhanced accuracy need to watch the video several times, focusing separately on: 1. spoken text (textual data), and 2. visual data (character(s), settings, motions and gestures, objects, gaze of the characters, camera angles, colors, etc.), then review the video in its entirety.
Transcribing Verbal Data
References in the literature to video transcription generally refer to the entire video, presenting content as a narrative but including both visual aspects and spoken language. Various aspects of a single video record may be transcribed and used in response to different research questions and approaches (Ramey et al., 2016).
The VVVA approach, drawing on Konecki (2011) and Clarke (2005), emphasizes the importance of providing a comprehensive description of the visual data (Konecki, 2011) or, as Clarke (2005) suggested, “the big picture,” calling for a verbatim transcription of all spoken language in the video as an accurate record, whether generated by manual transcription or using software (e.g., SpeechTexter). This transcription would aid in identifying all significant details from the video that may be important for future analysis. By transcribing (verbally describing) the video data, we become more aware of their features and structural aspects (Konecki, 2011). Transcriptions must be carefully reviewed and checked for accuracy. Researchers will need to return to the transcribed verbal data, possibly numerous times, as they extract and code further verbal/textual data from the video narratives for analysis.
Choosing Units of Analysis
As video data vary considerably in type, characteristics and duration, the units of analysis need careful selection. This task mainly involves decisions around whether to examine the entire video as one piece, or segmentation of the video in terms of duration, characteristics of the video data and the research questions (Clarke, 2005). For short videos (less than 5 minutes) the entire footage may be examined as a single unit, whereas lengthier videos like recorded interviews, training sessions, movies, and documentaries need to be broken down for easier and more thorough coding and data analysis.
Depending on the theoretical framework and research question(s), the units of analysis may be based on: 1. time (brief segments), 2. mode (speech or gestures) (Lacković, 2018), 3. visual features (scene, frame or camera shot), 4. themes or common threads (similar patterns, events or ideas), or 5. some combination of these factors. Once the unit of analysis has been established, the next phase focuses on data extraction and coding within the chosen units, followed by comprehensive analysis.
Extracting and Coding Data
In the VVVA method, as in multimodal content analysis, data extraction and coding acknowledge both verbal and visual information for the formation of meaning (Drew & Guillemin, 2014; Pink, 2013; Trombeta & Cox, 2022) and must be performed in such a way that the two are brought together, grouped, classified, and relationships established in order to understand and uncover meanings for later interpretation. The process of content analysis should be followed for data extraction and coding.
Content Analysis
Content analysis is a basic and effective approach for examining text and visuals (Burnard, 1996; Cole, 1988; Tesch, 1990). Content analysis can be utilized inductively (from the particular to the general) (Chinn & Kramer, 1991) or deductively (grounded in a prior theory or model) (Burns & Grove, 2008), depending on research goals (Elo & Kyngas, 2008). Inductive content analysis involves coding, grouping, classifying, and abstracting data, without using a pre-established data classification matrix; whereas in deductive content analysis the researcher develops a classification structure or matrix based on theories, models, conceptual maps or literature assessments for more profound and structured data collection and coding processes (Hsieh & Shannon, 2005; Polit & Beck, 2004; Sandelowski, 1995). Depending on study objectives, paradigm and methodology, researchers select an inductive or deductive approach before initiating the project. Regardless of approach, content analysis mainly concerns the classification of data into categories small enough to uncover information and meanings (Burnard, 1996). In utilizing the VVVA method, we recommend the development of matrices and extraction tables for each unit of analysis, attending to every aspect of the video data suggested by Multimodality Theory (Kress, 2010).
Data Extraction and Coding Matrices
As sifting through hours of video content may become overwhelming (Ramey et al., 2016), researchers need structures for gathering maximum information as quickly and concisely as possible. The VVVA framework, drawing on Clarke’s “specification” memo (2005) that examines and analyzes the image from various perspectives and angles, proposes a classification of extraction matrices for coding video data based on the following core characteristics: 1. General characteristics: date of video production, language, duration, etc.; 2. Multimodal characteristics: modes of communication, participant gestures and postures (including screenshots of each gesture), music and sound, etc.; 3. Visual characteristics: colors, settings, camera angles and shot sizes, objects and backgrounds, etc.; 4. Characteristics of primary and secondary characters (charted separately): personal information, e.g., name, sex, gender identification, occupation, ethnicity, etc.; and 5. Content and compositional characteristics including messages, emotions, and discourses of the characters (based on the video transcriptions) and on the project-specific research questions.
Extracting and Coding Data Using Matrices
Before extracting and coding the data, researchers should revisit the video and review the transcribed data as often as necessary, then fill out the matrices in as much detail as possible to capture all the verbal and non-verbal information. To reduce error, at least two trained researchers or research staff should complete the matrices following the same procedures, e.g., size and content of screenshots, documenting them with quotations and using consistent terminology and acronyms. Researcher training should include an examination of some videos as a group to become acquainted with the data extraction matrices. They should extract one or two videos independently, then compare their results and use of the data extraction forms for consistency. Once the data entry process is completed, documentation of the matrices by multiple researchers should be verified for potential discrepancies, resolving any problems by consensus. The following section presents data extraction matrices for two short video testimonials, as examples of the data extraction and coding processes.
Examples of the Extraction Matrices and Coding Process
The “Alexis Lahorra Testimonial” (https://www.youtube.com/watch?v=pQE-wpOnRDs) was produced by the 2017 Bell Let’s Talk campaign and is available on Bell Canada’s YouTube channel (https://www.youtube.com/watch?v=ZojDyMjWBP0). “#HAVEHOPE Danielle Smith” was produced for the “Have Hope” campaign of the Waypoint Centre for Mental Health Care in 2018 and is available on their YouTube channel (Figures 2 and 3). These testimonials were used in the “Learning to Care” project, which examined how video testimonials and digital narratives related to mental illness and recovery may help viewers feel empathy and compassion while reducing stigma (Ferrari et al., 2022). The matrices shown below were developed based on the research questions and objectives of this project. Each two-minute video was treated as a single unit of analysis, and distinct matrices for data extraction and coding were developed for each video based on the study question: “How do digital narratives (video testimonies in social marketing and fundraising campaigns) influence empathy and compassion?” (Ferrari et al., 2022: p.3). In the following matrices for VVVA, the video data were categorized as: 1. General characteristics; 2. Multimodal characteristics; 3. Visual characteristics; 4. Characteristics of primary and secondary characters; and 5. Emotional experiences of the main and secondary characters involving empathy and compassion. The core characteristics retained in developing extraction matrices for the model are marked with an asterisk (*), as distinct from those that would be modifiable or adaptable in other studies with different types of video data and research objectives/questions. Screenshot of “Alexis Lahorra Testimonial” (https://www.youtube.com/watch?v=pQE-wpOnRDs) produced by the “Bell Let’s Talk” campaign (2017). Screenshot of “#HAVEHOPE Danielle Smith” (https://www.youtube.com/watch?v=ZojDyMjWBP0) produced by the Waypoint Centre for Mental Health Care’s “Have Hope” campaign (2018).

In these examples, two researchers working separately extracted and coded the data by watching the video, pausing it repeatedly and capturing the screen images multiple times to ensure that no information was overlooked. The data reflect a consensus between the two researchers on what was spoken or presented in the videos.
1. General Characteristics

2. Multimodal Characteristics (Modes of Communication)

3. Visual Characteristics

4. Characteristics of Primary Character

5. Messages, Emotions, and Discourses of Primary Character (examples related to emotional experiences of empathy and compassion)

Characteristics of Secondary Character

Messages, Emotions, and Discourses of Secondary Character
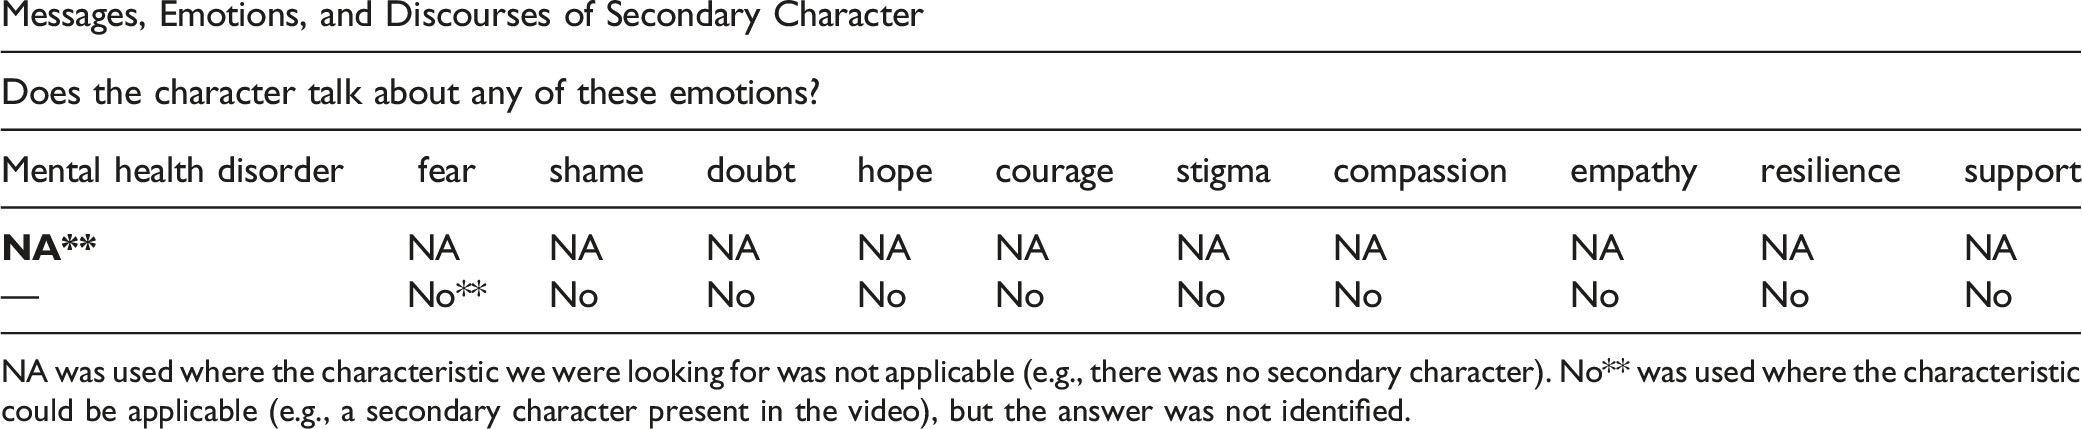
NA was used where the characteristic we were looking for was not applicable (e.g., there was no secondary character). No** was used where the characteristic could be applicable (e.g., a secondary character present in the video), but the answer was not identified.
Organizing, Describing and Interpreting Extracted Data
The overall aim in organizing the data within the proposed matrices is to identify smaller groups, and link various categories and sub-categories for describing and interpreting the coded data (Polit & Beck, 2004). Researchers should establish comprehensive sub-categories rather than merely grouping similar or linked information. Verbal data must be distinguished from other modalities within groupings (Dey, 1993), linking the mutually informing verbal and visual data categories based on the research objectives and questions. Detailed groups and sub-groups should then be created and linked, categories summarized, themes or meanings extracted, and patterns and connections in the data (textual, verbal and visual) identified, followed by description and interpretation of the findings to improve comprehension and create information (Cavanagh, 1997; Elo & Kyngas, 2008) (Figure 4). These steps are repeated until all possible connections have been discovered and interpreted, and the research questions are fully addressed. Visual-Verbal Video Analysis at a glance. Showcasing analytical matrices linking the extracted data to find patterns and relationships.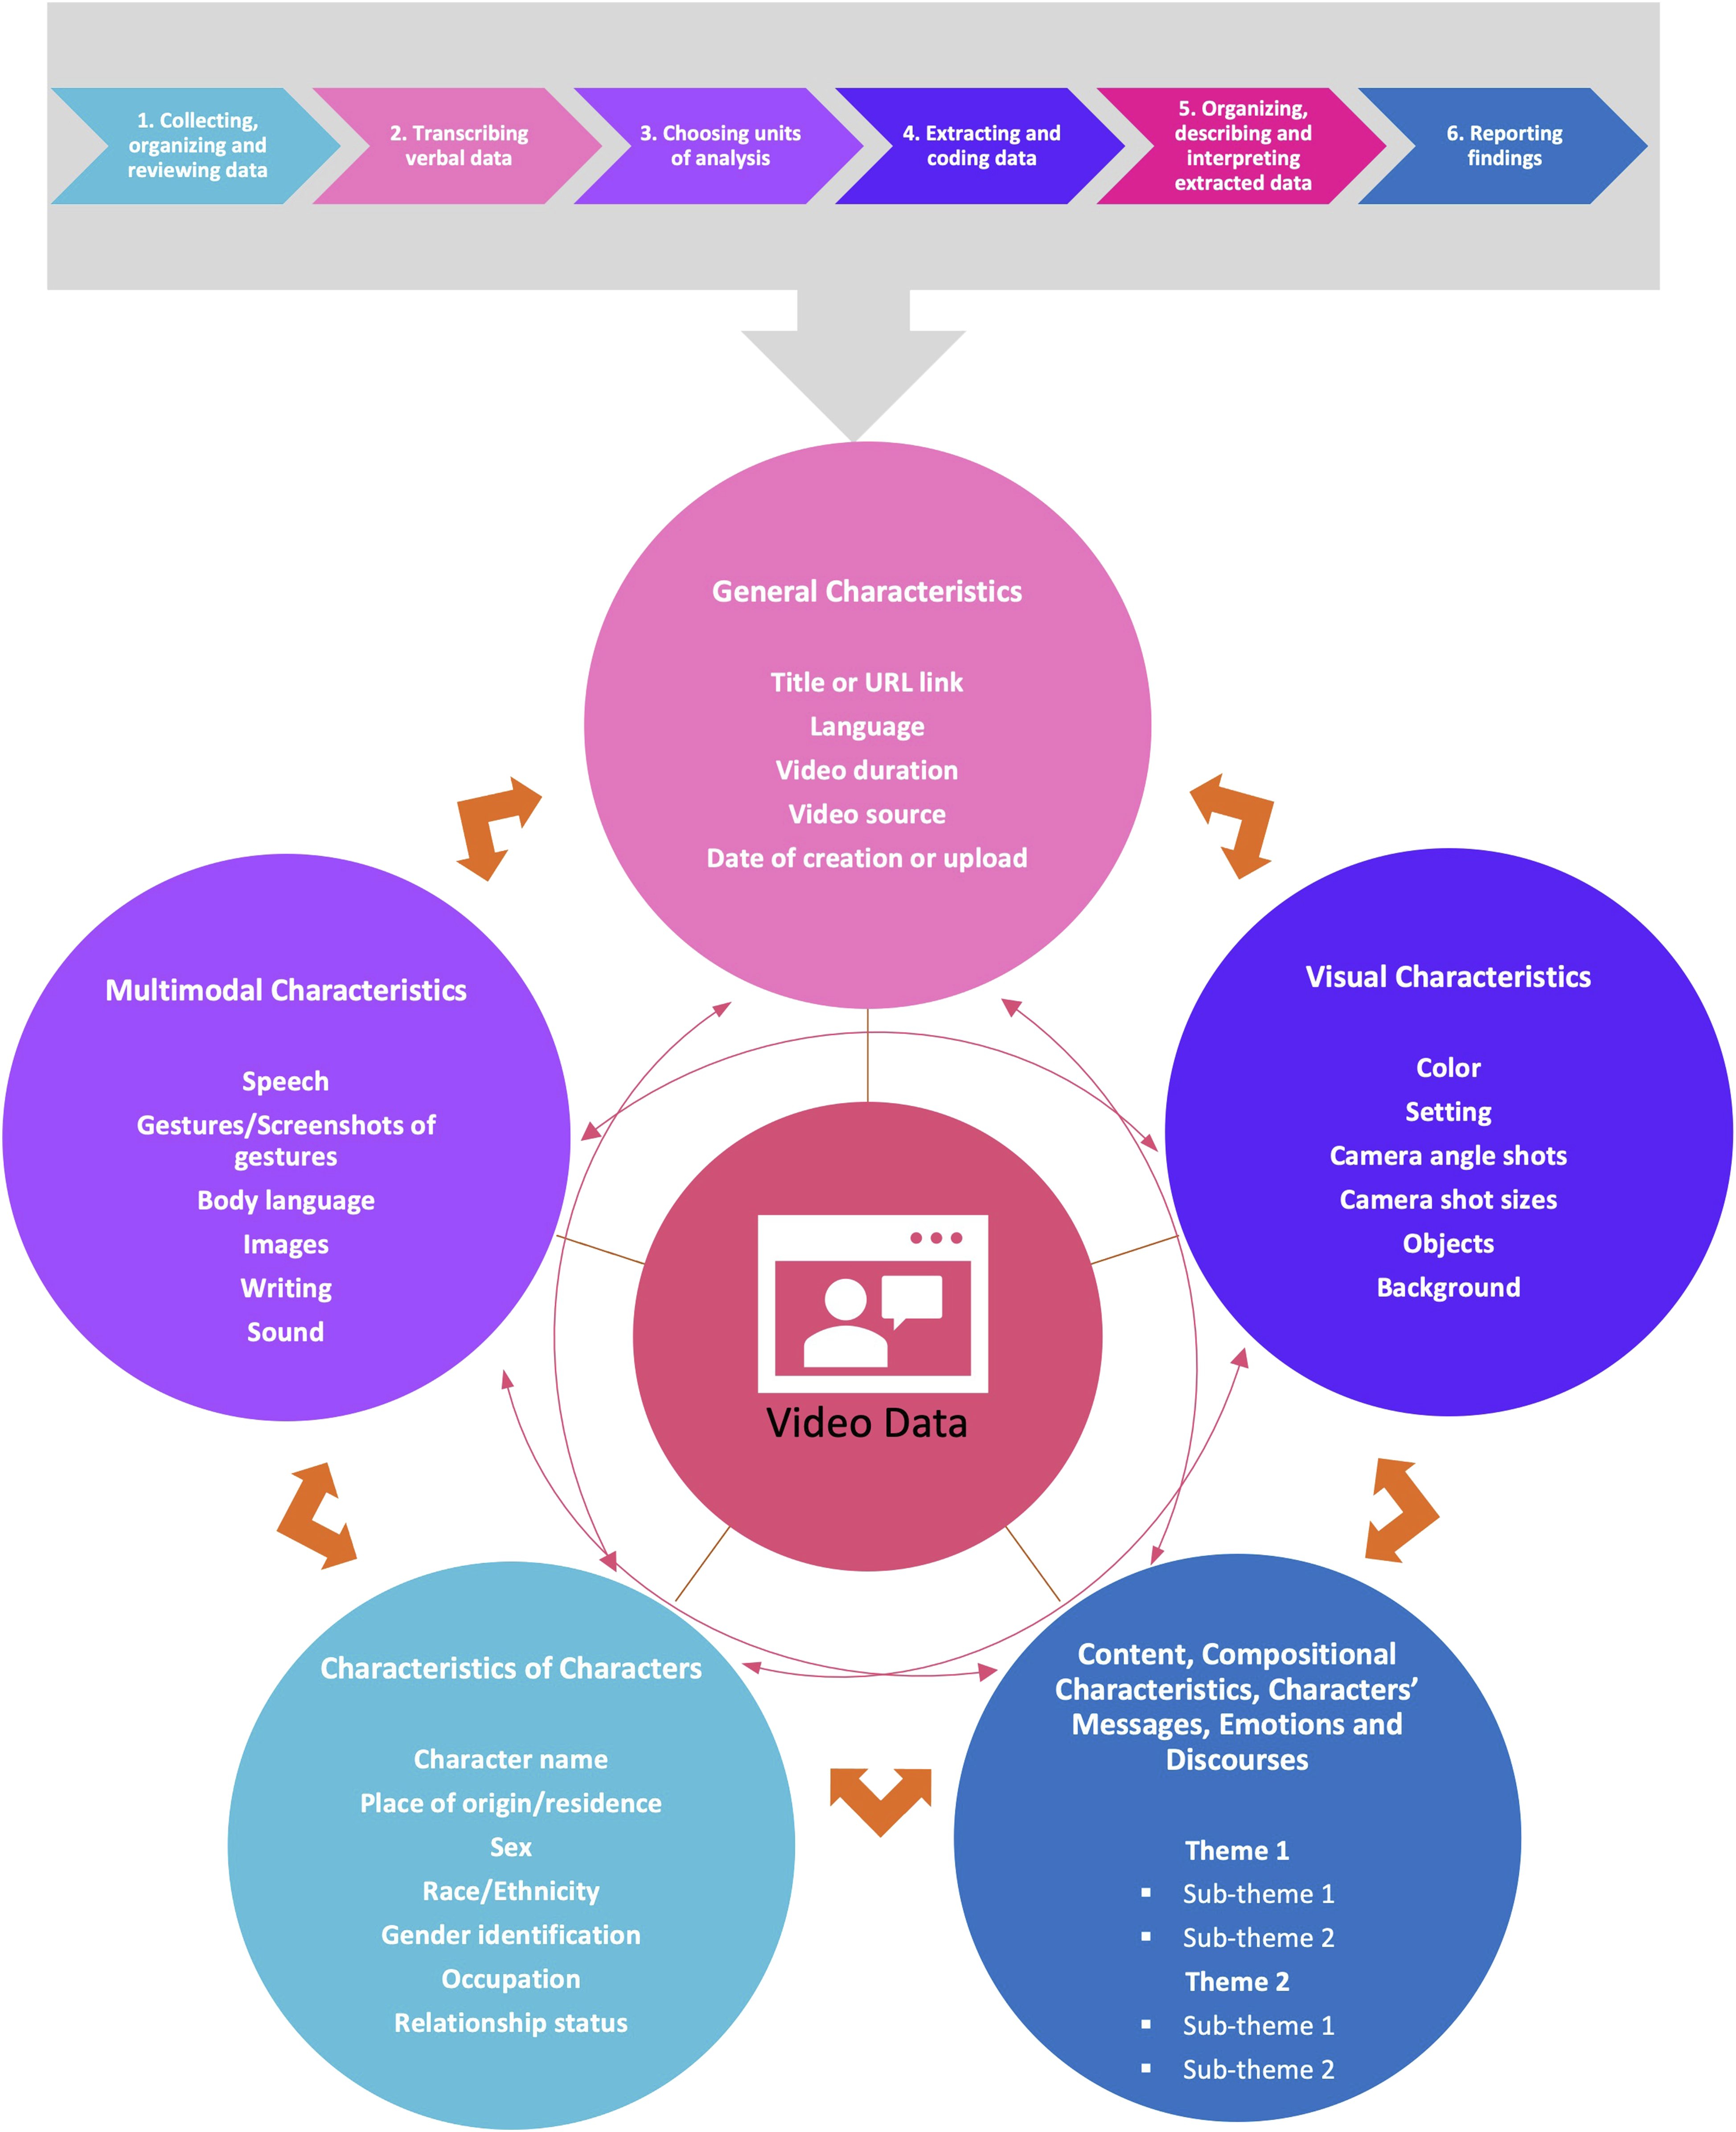
In sum, proper analysis of the coded data in this phase requires that the researcher perform two main steps: 1. explore the data extracted in the data-collection phase, summarizing the data descriptively in as many smaller groups as possible, and 2. explore all the emerging groups and sub-groups to identify relationships among them, and, specifically, between verbal and visual categories.
Some examples of subcategories from the extraction matrices would include the biological, psychological, and socio-ethnic characteristics of characters, subcategorized by sex, gender, race, social position/status, and further groupings for each category. Coded multimodal information like type of communication (spoken text or not), gestures, images, etc., could also comprise smaller groups based on types of gestures or images. Visual information, e.g., setting, camera shot sizes, etc., may be grouped into smaller categories based on various characteristics, for instance setting subdivided by location or setting characteristics (formal, informal, relaxed, etc.), and so on.
The next step, interpretive exploration, involves many possible avenues for exploring verbal and visual groups and sub-groups for patterns or associations. For example, relationships between groups and sub-groups may be explored based on visual data in terms of types of gestures, including what the characters were saying as they made a particular gesture; or between groups based on verbal data, e.g., possible associations between sex and social location for job status. Alternatively, researchers may explore the links between gestures and types of settings where testimonials are presented: for instance, whether more relaxed gestures and body movements occurred in informal settings (e.g., homes) versus formal settings (e.g., public places, offices); or relationships between camera shot sizes and the extent/types of visible gestures. These descriptive and interpretive steps must be followed for all categories and sub-categories until all conceivable relationships across the coded data are accounted for and the research questions answered.
Reporting Findings
The write-up, the final stage in qualitative video research, aims to convey findings in an understandable and impactful way for readers (Sandelowski, 1998). This phase entails summarizing results and categorizing findings in relation to the study objectives and research questions, using the data to generate findings that accurately and fully represent the topic at hand (Elo & Kyngas, 2008; Fazeli, 2022). No one style exists for qualitative research reporting, leaving researchers free to select their narrative and mode of communication based on their study aims, paradigm, methodologies, and data (Sandelowski, 1998). A good balance needs to be struck between research goals, analysis, description and the interpretation of data, while decisions must be taken on how much detail to provide, which aspects of a narrative to highlight, and why, in identifying outstanding viewpoints (Polit & Beck, 2004; Sandelowski, 1998) and in ensuring reliability of the report while covering the entire content (Graneheim & Lundman, 2004). In short, “a qualitative research report must always tell the story of the project, richly convey the views of others, and detail implications” (Drisko, 2005: p.589). In this regard, researchers might use various templates or structures to guide the presentation of findings, structure the write-up, and provide consistency and flow (Sandelowski, 1998). These templates may vary based on the field of research or research objectives, and may follow a structure based on time, theme, coding families, etc. For instance, a time-based template designates time as the primary or secondary organizing element in the report. Researchers may also start with the most prevalent or common topic in their data before moving on to outliers. Or they may choose to structure their write-up according to coding families, in developing theory (Sandelowski, 1998).
Regardless of structure, researchers need to communicate their findings using numerous verbatim quotations and examples, and by producing tables, graphs, and charts to enhance the communication of study findings. These provide simple ways of explaining the relationships between all components of the video data, the analytic process, and comprehensive outcomes of the study (Drisko, 2005; Fazeli, 2022).
Discussion
This article aimed to contribute to qualitative video data analysis in the social and medical sciences by defining and demonstrating use of the VVVA method, a six-step approach to the management of verbal/visual/textual video content and by evaluating extracted video data using a multimodal matrices framework. The article also offers a comprehensive examination of the theories underlying video data analysis as well as examples of the coding and interpretative process for a better understanding of what the proposed method involves.
The VVVA method may be applied to a broad range of video data, including video-recorded interviews, teaching or training sessions, digital stories and cellphilms, doctor-patient interactions, testimonials, segments of movies or TV shows, etc., that vary in duration and characteristics, and originate from open access web sources (e.g., internet), to pre-recorded organizational videos and recordings created specifically for research purposes. Regardless of video type or source, the VVVA method represents a consistent, straightforward, and simple approach to data management compared with existing methods described in the literature. Moreover, VVVA accommodates data sets of varying sizes, and provides a systematic coding procedure for verbal and visual content as well as textual data, using structured, coherent extraction matrices that facilitate the identification of patterns and links between distinct groups of information. Yet the approach also provides flexibility as a data collection and analytical method, allowing for the adaptation of core categories and following the research process as it unfolds. VVVA is a low-cost option that does not require special equipment or software. The steps described in this article can be performed using a computer and basic software (e.g., word processing, presentation, internet and multimedia tools).
Despite the advantages of the VVVA method for qualitatively assessing video data, this method, like others, has certain limitations or drawbacks. The multimodal approach requiring screenshots and minute descriptions may be particularly time-consuming, even compared with other qualitative methods, especially when videos are lengthy or the number of videos under investigation is large. As well, the VVVA method, as a deductive, multimodal theoretical approach to content analysis, is organized and easy to follow, but eschews taking an exclusively inductive analytical path.
The VVVA method is rigorous, producing rich data that draw out the specificity of video content in qualitative and quantitative terms (e.g., types of gestures in a video and the frequency of specific gestures across multiple videos). This type of information may help researchers organize different videos according to similar categories that can be used for experimental studies, or, for example, using constructivist and interpretivist paradigms to compare videos according to sources, format, and purpose. The findings generated by interpretative data processes may reveal new understandings related to patterns of human behavior, social interactions and practices, and social discourses grounded in accurate data identification and interpretive processes.
Conclusion
With the rapid evolution from text and print-based visuals to digital resources and multimodal data, especially videos, researchers need to reevaluate and revamp their analytical tools (Serafini & Reid, 2019). The value of video data cannot be overstated, especially in the fields of social science and medicine, and video data generated from multiple sources is flourishing. Yet research on how to actively merge visual and textual data, especially video data, is seriously lacking. Researchers will need to re-envision constructs for re-conceptualizing the textual, visual, and multimodal nature of video data, as the use of visual data expands in different research areas and new forms and sources of videos continue to emerge. The VVVA method outlined in this article provides a promising, step-by-step guide to structured and accessible video research using a robust but adaptable framework that responds to the challenges of finding adequate procedures for researchers. We believe this approach has the potential to motivate qualitative researchers to reconsider their current approaches to video data analysis and help fill the gaps in qualitative research around this topic.
Footnotes
Declaration of Conflicting Interests
The authors declared no potential conflicts of interest with respect to the research, authorship, and/or publication of this article.
Funding
The authors disclosed receipt of the following financial support for the research, authorship, and/or publication of this article: This work was supported by The Social Sciences and Humanities Research Council (SSHRC) of Canada, grant no. 430-2020-00673.