
Abstract
There is an increasing scholarly focus on how and why team dynamics develop over time. However, most of the used data-collection tools tend to be time-intensive and prone to biases. Hence, we developed Retrospective Team Events and Affect Mapping (R-TEAM): A longitudinal mixed-methods approach that yields a validated map of a team’s past events linked to affective team states. This paper illustrates, with an actual case, how the R-TEAM approach uses five well-known social-scientific methods: (1) the focus group method; (2) the life story interview; (3) the critical incidents technique; (4) visual elicitation and mapping; and (5) the survey method. Employing all five methods in a deliberate order, or ‘process of inquiry’, can curb the known limitations of each single method if used independently. R-TEAM can especially contribute to the systematic study of team dynamics because team-level data are collected and analysed through multiple means of stimulating recall among its members. Moreover, the R-TEAM approach stimulates team learning (via its inclusive and reflective orientation) and compared to prospective longitudinal approaches, it is less researcher-time consuming. The R-TEAM approach could particularly serve engaged scholarship, thereby enriching practically relevant theorizing on the time-sensitive and often fleeting team dynamics.
Keywords
Introduction
Many scholars try to understand how and why group/team dynamics develop over time. To unravel team dynamics, one typically applies process-research methods (Garud et al., 2020) often involving prospective longitudinal or ethnographic research designs (Langley et al., 2013). However, such designs are time-intensive and prone to researcher bias. Hence, Langley et al. (2013) called for further development of process research methodology by means of quantitative methods. Quantitative approaches in the social sciences are based on “linear thinking and chain-like cause-effect connections” (Navarro et al., 2015; Ramos-Villagrasa et al., 2018, p. 137). Despite the benefits of such methods, a positivistic approach seldom offers sufficient detail as to how and why organizational units evolve over time (Wheelan & Williams, 2003) “in-between arresting moments” (Helin & Avenier, 2016, p. 148). We developed a new approach, initially within a larger longitudinal study of work teams undergoing organizational change over a period of three consecutive years (Van Dun & Wilderom, 2021). Even after collecting and analysing diverse team-level data prospectively, we still lacked solid insights into how and why the team dynamics had evolved. So, we asked the team members to engage in retrospective reflections of their past team experiences. Consequently, we created the Retrospective Team Events and Affect Mapping (R-TEAM) approach.
Qualitative and interpretive methods are geared towards capturing the complexity of teams in the field (Burke, 2014; Kozlowski, 2015; Salas & Wildman, 2008; Shuffler et al., 2015). Clearly, reconstructing the dynamics occurring in an organizational unit over time requires an emic perspective as everyone in the team may interpret their team experiences differently (Hennink et al., 2020). Moreover, in line with the social constructionist lens, a team’s social reality is co-constructed through team members’ interactions (Endres & Weibler, 2017). Our newly developed approach essentially guides team members to co-construct a shared narrative about their past team experiences.
To truly understand a team’s dynamics, scholars can choose from a large palette of qualitative research methods including, e.g., focus groups (Morgan, 1996; Onwuegbuzie et al., 2009), the critical incidents technique (Flanagan, 1954), life story interviewing (Atkinson, 1998), and visual elicitation and mapping (Bell & Davison, 2013; Gutiérrez-Garcia et al., 2021). Although each of these four qualitative methods has its merits, their stand-alone use to capture team dynamics are prone to the well-known threats of validity and reliability: selective recall and researcher reactivity and/or bias (Denscombe, 2014; see the Online Supplementary Material which describes each method’s strengths and weaknesses). Hence, we combined them in a retrospective-longitudinal approach, together with the survey method. Each of these five methods’ limitations could be offset by the strengths of combining all five of them in the R-TEAM approach.
This approach entails five data-collection steps in which all team members are involved in reflecting on their shared past as a team, leading to a validated map of a team’s key events and its commensurate affective states. Our multi-method reflective field approach can offer broad and deep insights into the participants’ joint sensemaking of how and why particular team dynamics unfolded. R-TEAM thus also answers recent calls for societally impactful research that invests “time and effort in understanding a phenomenon, ideally through the eyes of the people who directly experience or are impacted by it” (Umphress et al., 2021, p. 1652).
The R-TEAM approach will first be illustrated with a real case (based on Van Dun & Wilderom, 2021). The Discussion section addresses R-TEAM’s methodological contributions and limitations, plus how the R-TEAM approach can advance (team) theorizing.
Methods
Sampling and Sample Description
The team that we analysed was embedded in a large health insurance firm which had implemented major changes in their strategy and structure (the sampling approach is reported in: Van Dun & Wilderom, 2021). The team consisted of 34 members who handled claims from healthcare providers while being engaged in continuous process improvement. The team had had two female team leaders, each employed on a part-time basis. The team member composition had hardly changed since the start of our study, i.e., the preceding 3 years. The non-managerial team members consisted mainly of women; most of them worked full time with an average team tenure of 4.3 years and had advanced vocational schooling and diplomas.
Data Collection
R-TEAM’s Data-Collection Steps and Possible Variations

Step 1 – key informant meeting
The first step is to gather initial insights into the team’s context and to organize access to collect the required mixed-methods data. This is done through contacting a so-called ‘key informant’: i.e., someone who plays a prominent role in the team and who can provide access to the team members. In our case, we held the first meeting with one of the two team leaders. During this (audiotaped) key informant meeting, the research goals and data collection process (i.e., steps #2–5) were clarified followed by gathering basic insights into the team’s context (past and present). See Appendix A for the interview guide. During this meeting, this team’s continuous customer-focused improvement strategy, and the implementation of a new Information Technology (IT) system, were noted as key events. The key informant also expounded on the team’s basic characteristics (size, gender ratio, tenure). Additionally, this meeting helped to create buy-in for the study; as noted by the leader: “The fact that we can also learn from this study, led me to approve our team’s participation”. At the end of the meeting, we gained approval to access the objective team productivity data from the previous 3-year study period.
Step 2 – team survey
The researchers then sent out a survey to all the team members, requesting them to describe: (1) the critical team events they had encountered in the past 3 years (inspired by Bott & Tourish, 2016); (2) demographical data; and (3) names of team members who they nominate to participate in the subsequent group interview (see Appendix B). The nomination section was added to find out who in the team had the best overview of how the team had developed over the last 3 years. The survey also clearly stated the research goal as well as the promise of confidential member participation and feedback to support the team’s learning. The survey’s response rate was 65% (22 out of the 34 team members).
Step 3 – selection of group interviewees
Based on the nominations obtained through the survey, the researchers selected three team members for the group interview. The team-member demographic data, obtained with the survey, was used to double-check whether they had worked long enough in the team to have sufficient knowledge of the past team events. We also checked for sufficient diversity in terms of team-member age, educational level, and job tenure/type. Our aim here was to curb selection bias and to include a broad range of memories and interpretations of the team’s past events. We did not invite team leaders to the group interview due to the risk of socially desirable responses in their presence. In the invitation email, the team representatives were informed about the group-interview goal and its required individual preparation (i.e., to write down key team events and/or arresting moments in the last 3 years).
Step 4 – group interview
The 2-hour group interview with the team representatives was audio-recorded and facilitated by two researchers (the main researcher assisted by a second one, as suggested by Krueger & Casey, 2015; Onwuegbuzie et al., 2009). It took place in a large meeting space with non-transparent walls because high-quality data-collection starts with creating a psychologically-safe atmosphere (Krueger & Casey, 2015; Onwuegbuzie et al., 2009). The chairs in the room were placed (without tables) in a half-moon shape facing one of the walls on which a large poster-sized blank page was hung horizontally. To help the team representatives’ recall process, we drew a 3-year timeline on the poster and placed icons of general events, such as holidays or the four seasons (see the bottom of Figure 1) (Bell & Davison, 2013; Gutiérrez-Garcia et al., 2021). We used sticky notes to depict the team’s past events, as these can be easily replaced and rearranged. Illustration of the visual output of the R-TEAM approach.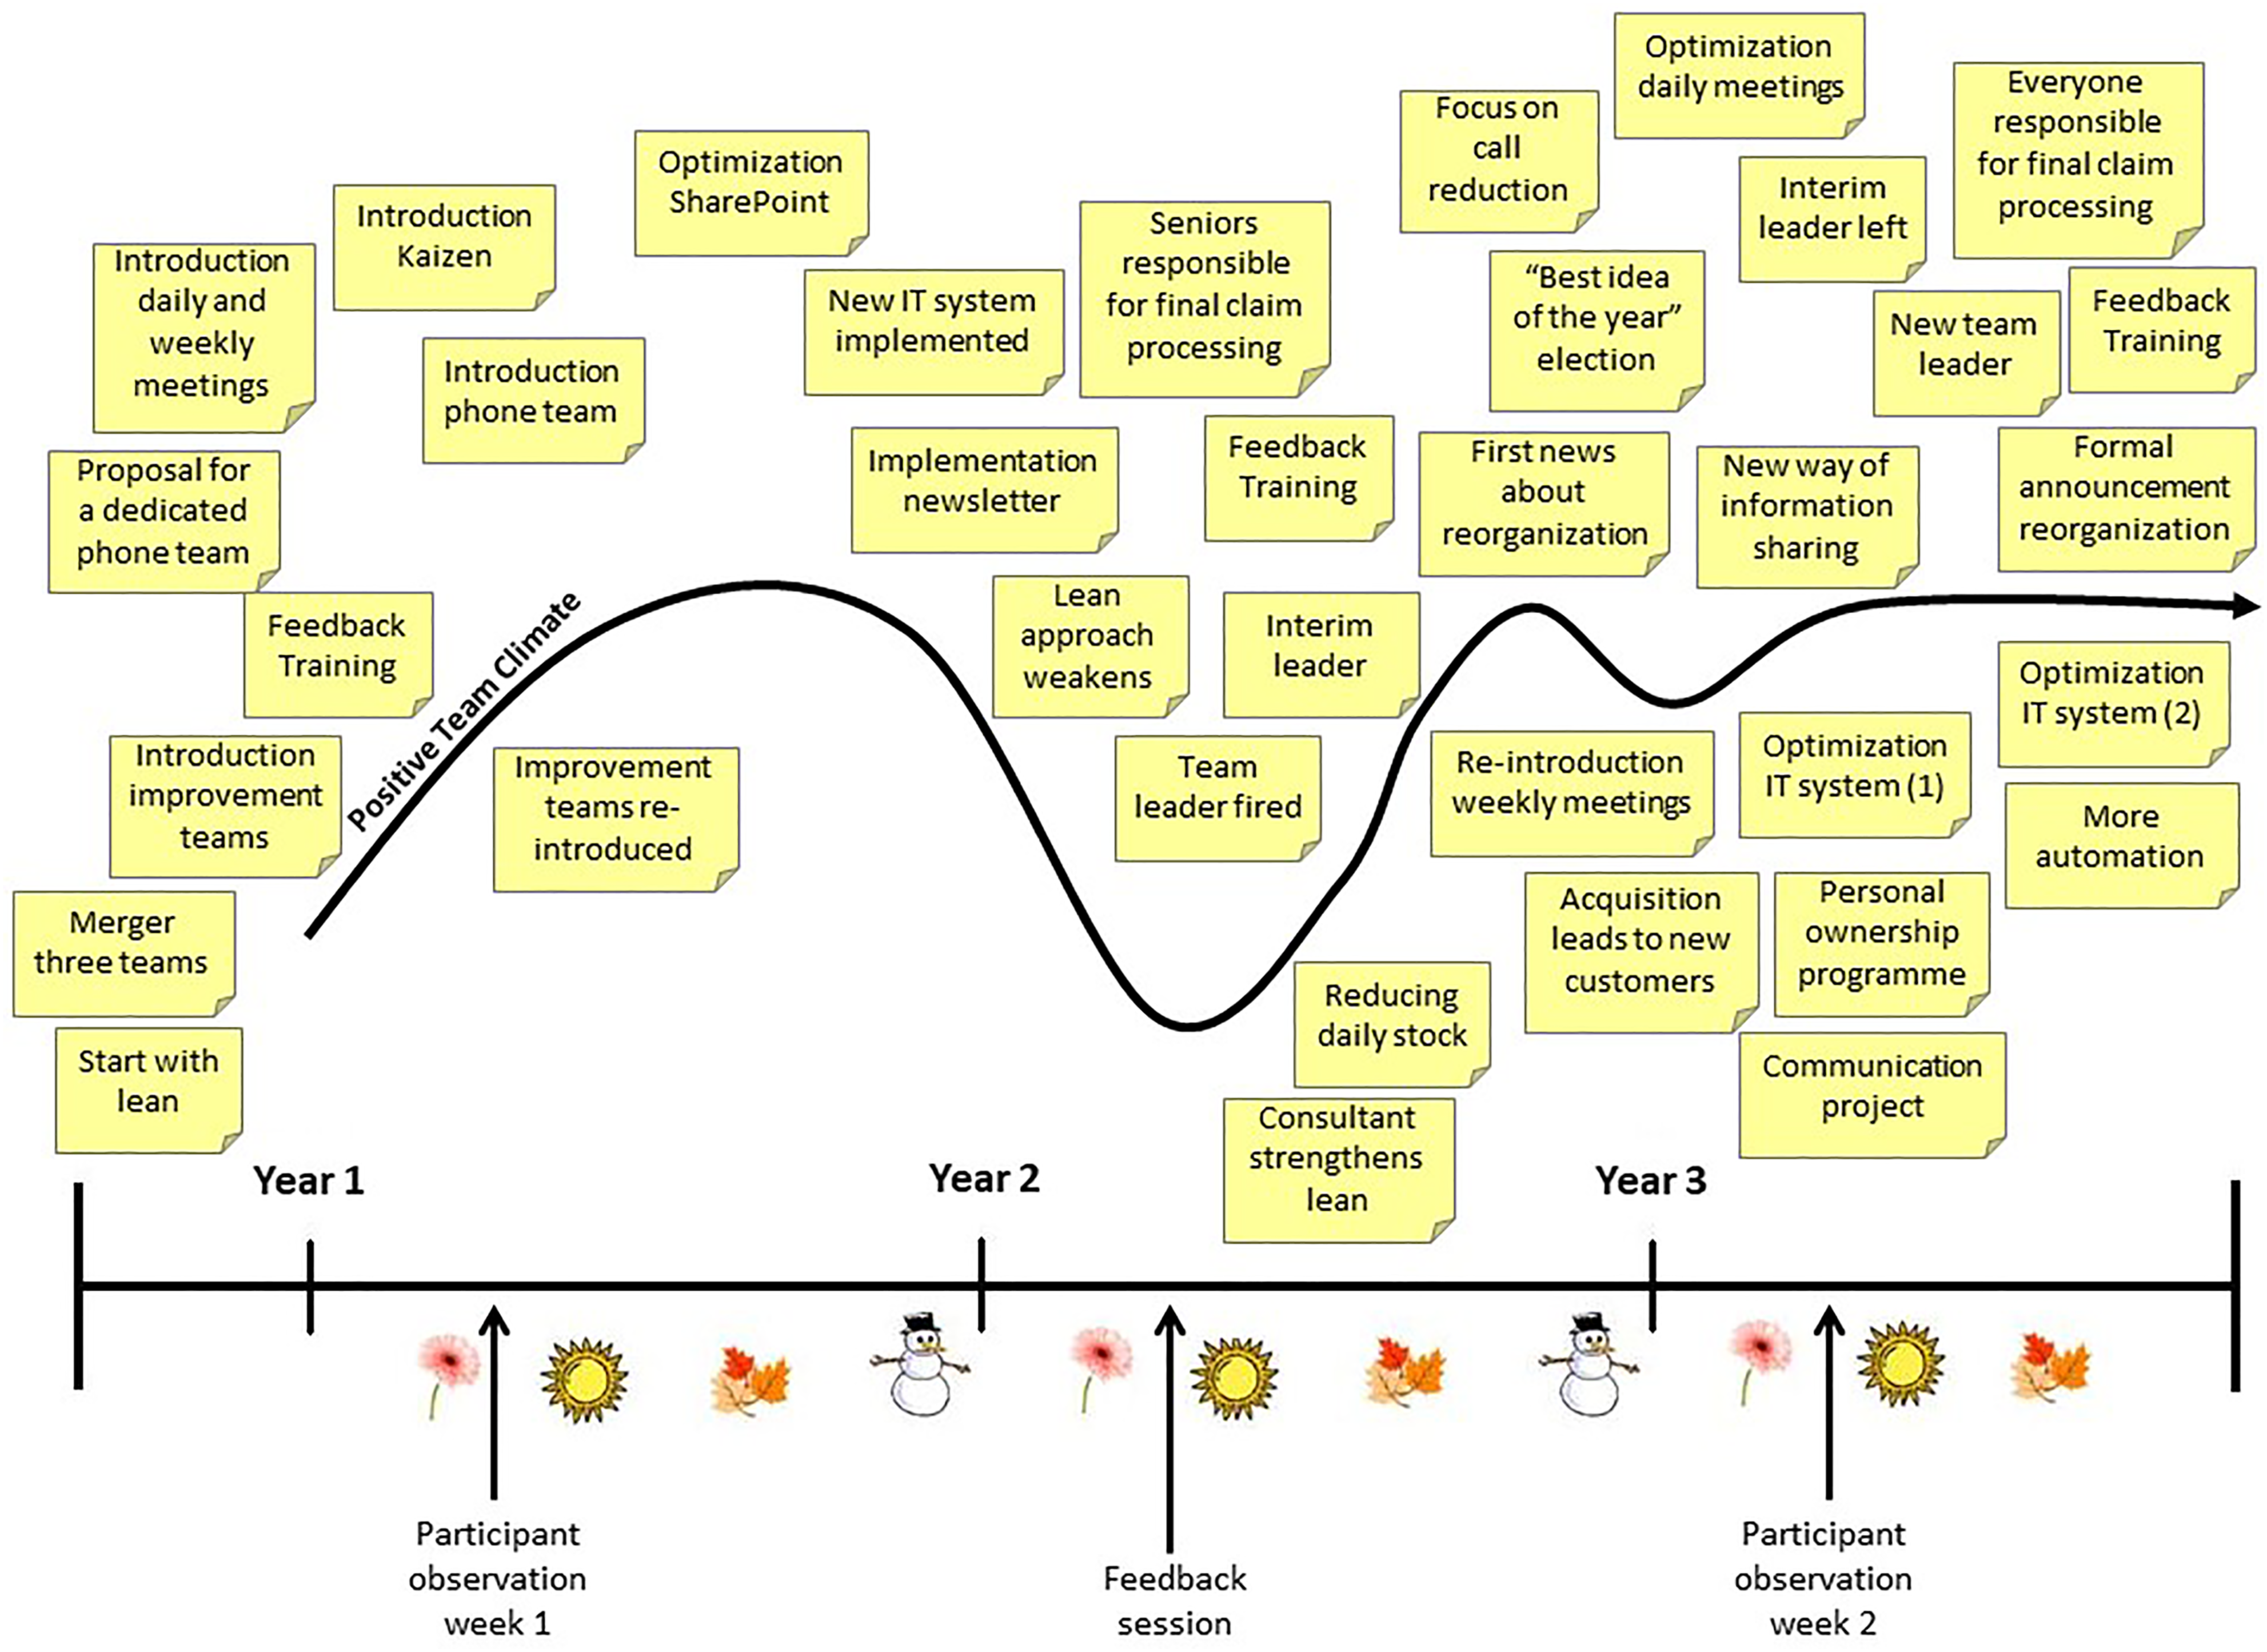
Appendix C provides the group interview guide. After explaining the goal of this interview, and a brief individual brainstorm, the main researcher opened the discussion by asking: “Who wrote down an event he/she would like to talk about?” Follow-up questions included: “Can you explain that event a bit more: What happened exactly?” “How did this reflect the team’s behaviour at the time?”, “How did this event impact the team?”, “Can you summarize the event so that we can write it on a sticky note?” and: “When did this event happen?”. While talkative representatives could help others to recall events, the two researchers aided the more silent ones by asking them directly or creating time for them to speak. We also double-checked the precise timing and phrasing of the events with the representatives. Then, the second researcher wrote the events on a sticky note (as a means not to overburden the participants) and patched it onto the poster’s timeline. Bias was curbed by asking open questions as well as referring to other data sources (e.g., documents). While taking stock of the past team events, the second researcher checked whether the events noted in the survey data had been mentioned. If some of them were missing, questions were being asked to stimulate the recall process (e.g., “Which other events occurred in the Winter of that year?”).
After most of the impactful team events had been placed on the poster, we solicited information about the team climate as an affective team state. We then asked the team: “If we were to draw a line on the poster to visualize your team climate, how would that line run?” The researcher took a pencil and, based on the group’s directions, started to slowly draw a line between the time-based events on the poster, depicting the development of the team’s climate over time (see, Figure 1). While drawing the line of interest, the researcher continuously asked for the group’s directions and asked the group to explain the ‘why’ behind the shape of the line and how it was related to the events.
Step 5 – validation of the mapped events and affective team states
The map, depicting the past team events and affective states with all its sticky notes, was then shared with all the other team members (including their two team leaders) for further validation during a regular (audiotaped) team meeting. Curbing researchers’ bias, in this step open team discussion took place around questions like: “To what extent does this map accurately capture what happened in the last 3 years?” and “To what extent do you agree with this interpretation?” During this discussion, the researchers acted as neutral process moderators (Krueger & Casey, 2015).
Data Analysis
The data entailed: (1) a poster containing the team-wide validated events, including a line depicting the development of the affective state over the last years (see Figure 1 for the digitized poster); (2) (group) interview transcriptions; and (3) objective team productivity data covering these years.
The data analysis could be done in an inductive or abductive way, depending on the state of the field and the purpose of the study (Bamberger, 2018; Edmondson & McManus, 2007). In this particular example, we took an abductive approach aiming to extend the available theory and identify new patterns (Bamberger, 2018). We started analysing the poster by color-coding the events on the sticky notes inspired by the theory-based antecedents of effective lean teams (based on: Magnani et al., 2019; Van Dun & Wilderom, 2012): top management support, strategic and structural clarity, human resource policy alignment, and resource allocation. The visual map was then enriched by adding a line representing the team’s annual average objective productivity, based on the team’s own performance database.
We then used temporal bracketing and pattern-matching techniques to verify and extend theory-based patterns (Barratt et al., 2011; Gehman et al., 2018; Yin, 2009). We connected the events on the timeline to both affective team climate and the objective productivity data. Drops in affective team climate and productivity were matched with the events that had been categorized according to the available theory. With this technique we identified three main episodes in all the examined events. Also, the interview transcriptions were content analysed through highlighting quotes about the events, team climate and/or productivity, followed by writing a team narrative describing the various team episodes (Gehman et al., 2018). The three episodes were labelled in a way which decomposes and simplifies the observed temporal flow of events (Gehman et al., 2018): to reflect and summarize the nature of the events during those episodes in the eyes of the team members.
Results
Interpretation of the R-TEAM Dataset
Three consecutive team episodes were identified (Figure 2): (1) flourishing, (2) struggling, and (3) healing. During those episodes, various related events had impacted the team’s team climate as well as their objective productivity. Content-analysed R-TEAM Output.
Episode 1 – flourishing
During the early phase of lean adoption, the team felt an increase in its positive team climate (Figure 2). Team members linked this to the clarified organizational ‘customer-centric’ strategy and streamlined structure after merging three units to improve customer contact. To this effect, top management had allocated various resources, including: an external consultant who implemented daily and weekly progress monitoring meetings, a continuous improvement team, ‘kaizen’ groups to solve more persisting and complex problems, and feedback trainings which helped employees to solve intra-team irritation constructively. The team members felt supported: “People did not have to work overtime any longer (…) we were being listened to more by the management (…) we could handle the claims with much more ease. (…) this enhanced the team’s climate.” Triggered by these new resources, the team’s productivity was also improving steadily as they worked on reducing backlog.
Episode 2 – struggling
Upon the introduction of a new, but malfunctioning, IT system, work started piling up leading to a fluctuating positive team climate. Soon afterwards, one of the two lean-supportive team leaders was suddenly fired by the management; half of the 22 survey respondents noted this as a critical event: “We were very fond of this team leader. We did not understand why she had to leave. This disconcerted us.” The group interviewees revealed that higher-level managers were vague about the reasons for her dismissal (“The truth was never shared”) which triggered an immediate major drop in team climate.
Top management tried to break through the negative spiral in various ways: by rehiring the external consultant to solve the IT issues and revive lean, by investing in feedback training to boost members’ conflict management skills, and by appointing an interim team leader. The positive effect of those countermeasures on the team climate was short-lived, because, although the higher-level leaders had originally guaranteed job security, a reorganization was announced. It consisted of relocation and automation of the team’s tasks as well as a strategic shift from being customer-focused towards reducing the number of customer calls. A team member mentioned: “The various organizational changes led to turmoil within the team.” Team members explained that senior managers’ absence during this uncertain time led to another drop in team climate. At the same time, the team’s productivity started to decline.
Episode 3 – healing
The appointment of yet another new (now supposedly permanent) team leader to replace the interim leader led to unclarity, as noted by a survey respondent: “Each [team leader] has different performance expectations.” And: “The change in terms of team leadership led to an increased focus on the performance figures and a more business-like relationship with the team.” Top management remained largely invisible; they did not provide any further clarification. Several group members complained about their team leaders’ increased task-performance monitoring. While the positive team climate had largely recovered, and management provided additional resources aimed at optimizing the IT system, a team member said: “People do not cooperate.” Another one commented: “You can easily hide in the group and pretend you are busy”. Another member summarized: “In the beginning, people gradually started to voice their improvement ideas and we began to actively implement them. After our team leader was fired, people learnt they could not share their ideas freely. Although we kept improving, our focus faded.”
How R-TEAM Provided New Insights
The sequential deployment of R-TEAM’s methods afforded clarity on this team’s dynamics. Certain important events had already been highlighted in the team members’ survey response; e.g., the majority of the team members had listed the changes in team leadership and the struggles due to the new IT system. They even provided exact dates but did not elaborate on how this had affected them or their team. The initial responses helped ignite an honest and open discussion of the events in the group interview during which the participants gradually reconstructed the events from the last 3 years and linked them to the team’s climate over time. The reflective why-questions (asked by the researcher while pencilling in the team climate line) solicited affective type insights from the participants, e.g. “That was a difficult period for me: I was afraid to speak up.” Another member explained “I think it has to do with how we provide feedback. (…) We tend to talk about people but not with them.” Flowing from these confessions, and after taking another look at the rich dataset, we noted that the positive team climate interacted with another team dynamic that had not crossed our minds: cross-hierarchical learning, triggered by the regular presence of the top leader on the work-floor (customary in lean teams). In this case, top management had become absent. This reduced their understanding of the work-floor needs while team members could neither understand the reasons for the team-leadership changes nor voice their concerns to the higher-level managers, which reduced their motivation for continuous work process improvement. What this implied for team effectiveness theory was published in Van Dun and Wilderom (2021).
Given that R-TEAM was deployed after the team’s key events had taken place, the respondents were able to provide additional meaning to them. In the final evaluative part of the group interview, a team member responded: “This [map] is very interesting. It really provides a good overview of how we survived the last 2 years.” Another said: “Memories started popping up in my mind again”. The joint discussion did not only revive team members’ memories, but also helped them to make sense of them.
In the validation session, we learnt that the map the team representatives had created was quite accurate as the rest of the team agreed with it. They recognized the events placed on the map and their links with the team climate fluctuations; a sign of face validity (Onwuegbuzie et al., 2010) and credibility (Tracy, 2010). This validation session stirred an open exchange of ideas that facilitated team learning regarding their past and the impact it had. Hence, the R-TEAM approach generated a reliable picture of the team’s previous 3 years within just 4 hours of meetings.
The group interview and validation session uncovered new knowledge about the team’s functioning, insights that had not surfaced during our prior observation weeks and earlier surveys (in year 1 and year 3), before R-TEAM’s deployment. The team members’ honest reflections on how they had experienced their team leader’s dismissal, the IT system’s effect on the team’s demoralization, and the decline of lean-tool usage provided team-dynamical insights. Although we had previously observed discomfort among some team members, the negative impact on the entire team’s climate and productivity proved to be much stronger than expected. In addition, R-TEAM identified how the team tried to bounce back over time and how their bosses’ actions had led the highly positive and performing team climate to fall apart.
Discussion
The R-TEAM approach uncovers the interaction between key team events at different organizational levels and a team’s affective states over time, and how the team’s performance is affected. R-TEAM’s novel integration of multiple methods does not only provide researchers with a valid and visual charting of team dynamics, but also enables concrete team learning for its members. The R-TEAM approach makes the following methodological contributions:
First, the particular order of the extant methods utilized in the R-TEAM approach generates added value. The relevancy of sequencing multiple methods was emphasized by previous scholars (e.g., Gutiérrez-Garcia et al., 2021). By not just being a collection of mixed methods, R-TEAM entails a particular process of inquiry. It starts with a key informant interview to explore the team’s context, quickly followed by a survey that taps the team’s memories (Howard, 2011; Menard, 2008; Niedźwieńska, 2003). Besides triggering recall in advance of the interview, the survey helps to pick the right team representatives for the group interview. During the group interview, the combination of careful listening to colleagues’ memories of important events and drawing the timeline also stimulates accurate recall (Bauer, 1992; Gutiérrez-Garcia et al., 2021). Indeed, tapping team representatives’ episodic memory is likely to “provide for more valid measurement” than mere individual survey administration (Antonakis & House, 2014, p. 764). Moreover, it reduces any ‘telescoping’ effects, or “the tendency to report events as occurring either earlier or later than they actually occurred” (Beckett et al., 2001; Pierret, 2001, p. 443). Adding events gradually prepares the group interview participants for the more complex task of visualizing the longitudinal development of the team-level (affective) variable(s) of interest (in this case: positive team climate). While no single method or technique is sufficient to minimize participant recall inaccuracies, using the five methods in sequence is beneficial (Ashton et al., 2021). The validation session with all the team members serves as a final point of data collection. This combination and order of research methods uniquely enables studying team dynamics in a retrospective manner while also offering opportunities to observe teams in a reflective-learning mode (see Table 1).
The temporal patterns of team processes are rarely rhythmic or predictable (Ballard et al., 2008). Therefore, another contribution of using R-TEAM relates to the fact that its result is comprehensive and does not assume linearity like multi-wave survey designs: Such designs highlight what happens in teams around pre-defined measurement points but rarely capture the dynamics of the team which may occur at other moments (Collins et al., 2016). Similar risks occur with prospective-longitudinal observation studies; there is a chance that the researchers will not be present during crucial events. Since R-TEAM generates a complete and co-constructed overview of the most important team events and the experienced consequences over time, the approach limits the chance of missing events and therefore allows for valid team analysis over time; causal team dynamics and their effects can then be validly identified.
R-TEAM’s visualizations also fit “a visual turn in management studies” to generate new insights (Bell & Davison, 2013, p. 180). By co-producing a visual team map, the R-TEAM approach collects and analyses data directly at the team level without modifying the data (e.g., averaging of individual scores). Although aggregating individual-level data to generate team-level data is an accepted method (e.g., Duan et al., 2019), one risks losing diversity and individual nuances. Hence, the ways in which team members (dis)agree are rarely published, which biases team theory development further. Onwuegbuzie et al. (2009) noted that researchers can provide more meaning by disclosing information about the level of consensus (or dissent). Another drawback of aggregating individualized data concerns potential researcher bias when interpreting or weighing the data (Denscombe, 2014).
Especially if the survey’s response rate is high, R-TEAM can be seen as an inclusive approach. The anonymity provided by the survey curbs socially desirable responses and, in turn, increases the chances that respondents note down sensitive or seemingly unobtrusive events. Moreover, the outcomes of the group interview are presented, discussed, nuanced, and validated during the full-team validation session. In this final meeting, every team member can add to the timing and interpretation of events and help finetune the shared view about the team’s past, strengthening the validity of the findings.
Compared to prospective longitudinal studies, the R-TEAM approach is less time consuming for researchers to conduct; only 4 hours are spent in meetings with respondents. The required time investment is also relevant for the teams of interest who often see it as a barrier to participate in a prospective longitudinal study. Since it is not easy to gain access to teams for a long period of time, team scholars often use student teams instead (Cronin et al., 2011), with the known disadvantages (Ramos-Villagrasa et al., 2018). The risk of prospective longitudinal research is that embedded researchers become too involved which may lead to over-rapport, selective perception, and selective recall (Foster, 1996; Hammersley & Atkinson, 1995). Attempting to reduce respondent reactivity by blending in and becoming an accepted temporary member (Foster, 1996) could lead to an ‘involvement paradox’ (Langley & Klag, 2019).
Research funding institutions and citizens are increasingly demanding responsible dialogic spaces in which social-scientific researchers and their participants can co-create knowledge that contributes positively to society (Banks et al., 2016; George et al., 2016; Soler & Gómez, 2020; Van der Ven, 2007). R-TEAM does enable engaged team scholarship (Van der Ven, 2007) as it increases the probability of generating new theoretical insights sooner and in close cooperation with, and relevant to, the respondents (Nyein et al., 2020). R-TEAM is therefore also a learning intervention for the participating teams and their leaders (Edmondson et al., 2001; Kayes et al., 2005; Myers, 2018; 2021). One of the strongest ways in which teams learn is through reflection upon members’ experiences, i.e., through ‘vicarious learning’ (Myers, 2018; 2021). To illustrate, at the end of the group interview a member noted: “If you see where we were coming from as a team and what we are doing now… This helps to become more aware of the results of adopting lean. We really need to continue our efforts!” R-TEAM can even generate team reflexivity, i.e. group members reflecting on their team’s functioning and implementing changes as a consequence (Konradt et al., 2016; Schippers et al., 2015). So, the dialogue between the respondents in the R-TEAM approach is not merely used to retrieve information for the researcher’s use (López de Aguileta et al., 2021; Umphress et al., 2021). It promotes, at the same time, an explicit team learning or sense-making process.
Limitations
There can be possible researcher bias on using qualitative methods involving one or more key informants (Onwuegbuzie et al., 2010). Either the researcher can influence the informants, or vice versa. Curbing this requires researcher reflexivity, e.g. by involving a second person to assist the main researcher (Onwuegbuzie et al., 2010).
Also, in the group interview the respondents need to feel safe to speak up (Vaugn et al., 1996). Hence the researcher must build rapport in a relatively short time (Krueger & Casey, 2015; Onwuegbuzie et al., 2009). The researchers’ team-facilitating skills (Krueger & Casey, 2015; Onwuegbuzie et al., 2009) are thus conditional for the approach to be successful, meaning R-TEAM is suitable for researchers with extensive experience in conducting group interviews.
The influence of pre-existing group dynamics – including those in the wider organization – on the data collection process needs to be considered (Onwuegbuzie et al., 2009). A way to limit this is to task at least one team member to act as ‘devil’s advocate’ to suggest different perspectives and/or to deepen everyone’s understanding (MacDougall & Baum, 1997). An alternative would be to include top and/or senior management in the R-TEAM approach, as they might provide crucial insights into the team’s context and dynamics in the wider organizational system. Depending on a study’s aims, one could add, for instance, a key informant meeting with a top or senior manager to the first R-TEAM step, invite top and/or senior managers to the final validation session, or have another validation meeting at the end with them. Another option is adding a parallel meeting in step 4 to understand the dynamics from a senior management’s perspective. R-TEAM might also be gainfully used to examining senior management team dynamics; dysfunctional events in teams often occurs due to unresolved tension among senior managers.
Reconstructing a team’s history is a social process which calls for openness about how any researcher may have influenced the group’s sensemaking process (Langley & Klag, 2019). Such reflexivity limits the risk of a researcher misinterpreting the respondents’ viewpoints (Bryman, 2008).
Finally, one could question the extent to which team members are able to report their past affective states accurately. The R-TEAM approach tries to resolve this by using multiple consecutive visual and group facilitation techniques to stimulate accurate recall among all the members. Combining different research techniques, including a timeline of events, into one coherent approach has been proven to enable participants to dialogue about deeply personal memories (Gutiérrez-Garcia et al., 2021).
Future Research
The R-TEAM approach is malleable and can be adjusted according to a study’s goal (Table 1). We see a multitude of possible uses for R-TEAM linked to different theoretical contributions. Because R-TEAM allows for valid capturing of key events in the development of affective states within teams (Ashkanasy et al., 2017; Barsade, 2002; Emich et al., 2020; Oreg et al., 2018), it may enrich the affective events theory at the team level (Ayoko et al., 2008; Cole et al., 2008; Weiss & Cropanzano, 1996) or help develop an intermediate theory of team dynamics (Edmondson & McManus, 2007). R-TEAM can also advance our knowledge of temporal dynamics of team learning (Lehmann-Willenbrock, 2017). Previous studies called for exploring learning episodes through a team’s life cycle (Kostopoulos & Bozionelos, 2011). R-TEAM is also well-suited for such action research or an equivalent “emergent inquiry process” where scientific knowledge on team events and people’s (affective) responses “is integrated with existing organizational knowledge” (Coghlan, 2011, p. 54), or as a way to evaluate team coaching trajectories (Peters & Carr, 2013; Shuffler et al., 2018).
In terms of epistemology, the R-TEAM approach fits well within interpretivism and pragmatism or as part of a social-constructionist lens (Endres & Weibler, 2017), through abductive or inductive reasoning. R-TEAM’s co-constructive and reflective nature enables the generation of new or surprising insights while enabling teams to make sense and learn from their situation. Thus, the R-TEAM approach can be used widely, ensuring an acceleration of scholarly and practical insights into team dynamics over time, befitting the recent responsible management research movement.
Supplemental Material
Supplemental Material - Mapping Team Dynamics Through Retrospective Team Events Analysis
Supplemental Material for Mapping Team Dynamics Through Retrospective Team Events Analysis by Desirée H. van Dun, Julia R. Wijnmaalen, Celeste P. M. Wilderom in International Journal of Qualitative Methods
Footnotes
Declaration of Conflicting Interests
The author(s) declared no potential conflicts of interest with respect to the research, authorship, and/or publication of this article.
Funding
The author(s) received no financial support for the research, authorship, and/or publication of this article.
Supplemental Material
Supplemental material for this article is available online.
Appendix A
Appendix B
Appendix C
References
Supplementary Material
Please find the following supplemental material available below.
For Open Access articles published under a Creative Commons License, all supplemental material carries the same license as the article it is associated with.
For non-Open Access articles published, all supplemental material carries a non-exclusive license, and permission requests for re-use of supplemental material or any part of supplemental material shall be sent directly to the copyright owner as specified in the copyright notice associated with the article.