
Abstract
Background
During the COVID-19 pandemic, rapid virtual qualitative methods have gained attention in applied health research to produce timely, actionable results while complying with the pandemic restrictions. However, rigour and analytical depth may be two areas of concern for rapid qualitative methods.
Methods
In this paper, we present an overview of a virtual team-based rapid qualitative method within a study that explored health care providers’ perspectives of how the COVID-19 pandemic has impacted hospital-to-home transitions, lessons learned in applying this method, and recommendations for changes. Using this method, qualitative data were collected and analyzed using the Zoom Healthcare videoconferencing platform and telephone. Visual summary maps were iteratively created from the audio recordings of each interview through virtual analytic meetings with the team. Maps representing similar settings (e.g. hospital providers and community providers) and Sites were combined to form meta-maps representing that group’s experience. The combinations of data that best fit together were used to form the final meta-map through discussion.
Results
This case example is used to provide a description of how to apply a virtual team-based rapid qualitative method. This paper also offers a discussion of the opportunities and challenges of applying this method, in particular how the virtual team-based rapid qualitative method could be modified to produce timely results virtually while attending to rigour and depth.
Conclusions
We contend that the virtual team-based rapid qualitative data collection and analysis method was useful for generating timely, rigorous, and in-depth knowledge about transitional care during the COVID-19 pandemic. The recommended modifications to this method may enhance its utility for researchers to apply to their qualitative research studies.
Keywords
Background
Qualitative research methodologies have been used for centuries in health sciences to gain insights into social phenomena and human experiences (Guest, 2008; Luciani et al., 2019; Morse, 2012; Padgett, 2016; Watkins, 2017; Watkins et al., 2013; Watkins & Gioia, 2015). Some traditional qualitative methodologies can be broadly categorized as “interpretive (e.g. grounded theory, ethnography, phenomenology) or critical (e.g. action research, feminist research)” (Cooper & Endacott, 2007) and apply sets of methods (procedures and tools) to answer research questions. Researchers use qualitative methods to make “an invisible world visible to others” or interpret the phenomenon of interest by engaging in dialogue and/or observation (Luciani et al., 2019). Within the health care field, qualitative research has been used extensively to examine various clinical phenomena, such as patient experiences and health needs (Gisselbaek et al., 2021; Gleeson et al., 2016), design and evaluate health interventions (Hamilton & Finley, 2019; Slattery et al., 2020) and explore health provider service delivery (Brooks, 2019; Tremblay et al., 2022).
Traditional qualitative methods require considerable time and resource investments (Silverio et al., 2020), making these techniques challenging to apply in health care environments where results may be needed urgently to inform solutions to practical and clinical problems (Thorne, 2016). Many qualitative methods are time-consuming due to the time required for transcription, data cleaning, working with qualitative software, team collaboration activities (e.g. training team) and interpreting data at a deep level (Silverio et al., 2020). While these challenges related to time pressures were present before the COVID-19 pandemic (Riley et al., 2013; Silverio et al., 2020; Thorne et al., 2004; Watkins, 2017), they became even more prevalent with pandemic-related contextual changes necessitating a rapid production of results (Tremblay et al., 2021; Vindrola-Padros et al., 2020).
The COVID-19 pandemic has triggered significant and unprecedented changes to health systems (Haldane et al., 2021), including a rapid shift to virtual health care and restricted hospital visitor policies (Munshi et al., 2021; Rawaf et al., 2020; Shreffler et al., 2020; Singh, Under review). Since health systems have traditionally been slow to adapt and respond to change (Fridell et al., 2020; Gale et al., 2019; Institute of Medicine (US) Committee on the Health Professions Education Summit, 2003), some argue that the COVID-19 context can serve as “an accidental catalyst for change,” triggering process improvements within the healthcare system (Jazieh & Kozlakidis, 2020; Tang, 2020). However, given the time requirements associated with qualitative methods noted earlier, qualitative studies run the risk of producing results that are outdated and/or no longer relevant to inform rapid change by the time they are released (Gale et al., 2019; Riley et al., 2013; Silverio et al., 2020).
Qualitative rapid methods
According to Silverio and colleagues, the time-consuming nature of qualitative methods is often under-estimated (Silverio et al., 2020). Attempts have been made to reconceptualize qualitative methods to be more efficient (Vindrola-Padros et al., 2020; Vindrola-Padros & Johnson, 2020). Rapid research has been defined as “research designed to address the need for cost-effective and timely results in rapidly changing situations” (Beebe, 2014). Generally, rapid qualitative methods reduce researchers’ time on data collection, management, and analysis (Taylor et al., 2018). According to a literature review in 2020 by Vindrola-Padros and colleagues, the six primary reasons for the use of rapid qualitative methods include reduced time, reduced cost, increased quantity of data collected, improved efficiency, improved accuracy and generating a closer interpretation of participants’ realities. During the pandemic, there has been a growing interest in using rapid qualitative research approaches to gain insights into pandemic-related responses and experiences to produce timely results for rapid dissemination and application (Anghelescu et al., 2021; Bröer et al., 2021; MacCarthy et al., 2020; McNall & Foster-Fishman, 2007; Roberti et al., 2021; Singleton et al., 2021; Taylor et al., 2018; Tort-Nasarre et al., 2021; Tremblay et al., 2021; Vindrola-Padros et al., 2020). Specifically, during a pandemic, qualitative data can complement epidemiological data by generating insights into the “lived experiences of disease, care, and epidemic response efforts” to inform decisions and practice changes (Vindrola-Padros et al., 2020). However, the concerns of rapid qualitative methods are that the compressed timelines could lack
Qualitative virtual methods
The selection of an appropriate qualitative method is based on multiple factors, including study aims and objectives, resources and contextual factors (Hanley, 2011). Physical distancing restrictions and time constraints during the COVID-19 pandemic have forced qualitative researchers to rethink approaches to both data collection and analysis used within traditional qualitative research (Tremblay et al., 2021); many shifted to virtual qualitative data collection and analysis approaches (Archibald et al., 2019; Gray et al., 2020; Roberts et al., 2021; Santhosh et al., 2021). The concept of “virtual” is broad and can include various modalities, such as phone and videoconferencing software (Crawford & Serhal, 2020; Taylor, 2021; World Health Organization, 2021). With regard to data collection, a knowledge base has emerged on virtual qualitative data collection during the pandemic context (Archibald et al., 2019; Davies et al., 2020; Gray et al., 2020; Santhosh et al., 2021). This literature indicates the need to attend to unique factors with respect to virtual data collection (e.g. talk-based platforms such as Skype), such as rapport building, interaction issues, and logistics that could impact the quality of data collected compared to in-person (Davies et al., 2020). Attending to these factors may minimize the disadvantages of virtual data collection, including reduced depth of data collected (Davies et al., 2020).
Prior studies have presented methodological insights on the use of qualitative data collection and analysis. Giesen and Roeser (2020) presented lessons learned from their team-based coding of qualitative data, which included the need for a “strong and supportive management structure,” breaking down activities related to training and coding, and creating guidance for the team (Giesen & Roeser, 2020). Similarly, Santhosh et al. (2021) and Roberts et al. (2021) shared insights from their virtual qualitative projects, which highlights the importance of thoughtful consideration of specific methodological challenges that could arise in virtual projects, stressing the importance of continuing to expand our knowledge of virtual qualitative research (Roberts et al., 2021). As the use of virtual qualitative methods continues to grow, there is a need to advance current knowledge through experimentation with different formats of virtual data collection and analysis (Lobe et al., 2020). However, compared to virtual data collection, there is a recognized need for more guidance on performing qualitative analysis virtually (Giesen & Roeser, 2020; Roberts et al., 2021; Santhosh et al., 2021).
Rigour, a critical but debated concept in qualitative research (Cypress, 2017), can be defined as “the means by which we demonstrate integrity and competence” (Tobin & Begley, 2004). The importance of rigour is summarized in a quote by Morse and colleagues, who stated that “Without rigor, research is worthless, becomes fiction, and loses its utility” (Morse et al., 2002). Given it’s importance, various checklists, quality indicators and guidelines have been created to enhance rigour in qualitative research (Johnson et al., 2020; Morse et al., 2002). While various terminology, concepts and approaches to rigour and related quality indicators have been proposed (Cypress, 2017; Johnson et al., 2020; Morse et al., 2002), a common approach is the four criteria of rigour in qualitative research: i) truth value, ii) applicability, iii) consistency, and iv) neutrality (Cypress, 2017; Lincoln & Guba, 1985; Sandelowski, 1986). Truth value is the presentation of findings as they are experienced or perceived by participants rather than based on the researcher’s viewpoints. Applicability is whether the results could apply to other contexts, settings, or groups. Consistency refers to whether researchers’ decisions are clear and transparent. Neutrality pertains to whether the findings clearly stem from the data (Sandelowski, 1986).
Although approaches to rapid qualitative research vary, the rapid nature of the analysis is believed to reduce components of rigour and analytical depth or the level of interpretation by preventing sufficient time for reflection and opportunities for interpretation (Burgess-Allen & Owen-Smith, 2010; McNall & Foster-Fishman, 2007). As demonstrated previously, it is possible to enhance rigour and achieve analytical depth within rapid qualitative methods (Gale et al., 2019; Taylor et al., 2018; Watkins, 2017). However, the rigour of virtual rapid qualitative methods is under-explored (Roberts et al., 2021). Applying these rapid qualitative methods in a virtual environment poses additional challenges when attending to rigour, involving distinct considerations compared to in-person approaches (Lobe et al., 2020; Roberts et al., 2021).
Aim
This paper describes a virtual team-based rapid qualitative method applied by our team to understand provider experiences with care transitions during the COVID-19 pandemic. Here we provide an overview of the method we used to produce timely results while attending to rigour and analytical depth, lessons learned in applying this method and recommendations for changes to the method based on our methodological experience. The methodological insights presented in the current paper may apply to other studies requiring timely, rigorous, in-depth qualitative results.
Methods
Setting
This study was conducted in hospital and community organizations in Ontario, Canada during the COVID-19 pandemic (Singh, Under review). The study was conducted between January to April of 2021. During this period in the pandemic, there were significant pressures being exerted on the Ontario health system due to hospital capacity concerns (Crawley, 2020; Wilson, 2021). To manage these pressures and reduce the risk of virus transmission, rapid changes to the healthcare system were implemented that impacted the patient experience, including sheltering in place, restricting in-person research activities and hospital visitations, postponing elective surgeries and procedures and shifting from in-person to virtual care in the community (Crawley, 2020; Munshi et al., 2021; Nielsen, 2020; Wilson, 2021). The research ethics boards of Sinai Health System and Trillium Health Partners provided ethical approval for this study.
Design
Team-based rapid qualitative methodology.

Stage 1: Recruit and screen
We aimed to recruit providers that delivered health services to older adults with complex care needs and were frequently involved in care transitions. They were recruited using purposeful sampling strategies, such as a recruitment flyer sent via email to hospital and community providers within the networks of the research team. Any individuals interested in participating in this study connected to the research team either using the contact information provided on the recruitment flyer or provided their contact information to the team member’s network contact who then shared the study details with the team. Participants were screened by telephone or email. The 16 hospital and community providers that participated in this study included four hospital physicians, three primary care physicians, three occupational therapists, three care coordinators, a social worker, a physiotherapist, and a discharge planner.
Stage 2: Data collection
Depending on their preference, providers participated in one virtual interview on Zoom Healthcare (a videoconferencing platform) or by telephone. For interviews on Zoom, the researchers provided the participant with a Zoom link and their contact number in case of any technical issues connecting on Zoom and offered flexibility if they did not have access to Zoom during the interview time. Since participants were already familiar with the platform, no training on the use of Zoom was required. We obtained verbal informed consent from all participants prior to data collection. All interviews were conducted during the COVID-19 pandemic between January-April 2021.
Researchers spent a short amount of time (∼5 minutes) engaging in small talk (i.e. light or casual conversation) (Merriam-Webster, 2022) to establish rapport with participants (e.g. ‘How is your day/week going?’). The interviews were facilitated using an interview guide created by five research team members and trialed on Zoom before data collection to evaluate whether modifications were needed (Abdul Majid et al., 2017). At the end of each interview, we asked participants if there was anything else they would like to share that we had not already talked about to ensure we comprehensively captured their thoughts on the topic. Virtual interviews were audio-only or audio and video-recorded with each participant’s consent and facilitated by HS or JXN, both trained in qualitative research methods. Fifteen interviews were audio-recorded (average audio-recorded interview length: 35:08 minutes; range: 17–52 minutes) and one was audio and video-recorded (video-recorded interview length: 25:35 minutes). Concurrent data collection and analysis were conducted as field notes were generated during and after the interviews on Microsoft Word, creating an audit trail and enabling reflexivity. To minimize interruption to the flow of the conversation, brief field notes, which were limited to keywords, phrases and thoughts that came up during the interview, were created during the interview. For transparency and to improve participants’ comfort, the researchers informed participants that they would be taking notes to help make sense of the data after the interview. The researchers muted their audio while taking notes during the interview to avoid noise distractions from typing.
Stage 3: Data immersion
To immerse themselves within the data, HS and two to three ‘analytic research team members’ listened/re-listened to or watched each interview recording to gain content immersion, generate field notes and independently note their analytical interpretations.
Analytic team
Analytical research team members.

Stage 4: Map each individual interview on an individual map
HS created a visual summary map for each interview (i.e. ‘individual maps’; n = 16) on Microsoft PowerPoint; the maps summarized key ideas from each interview (see example in Figure 1). Some maps were created on a graphic design platform; however, it was difficult to modify the maps on this website, so the team shifted to Microsoft PowerPoint. A visual mapping approach was appropriate in our study as we intended to analyze large amounts of audio-recorded qualitative data and share the analysis virtually in a format conducive to Zoom screen sharing with the research team. HS created visual summary maps for each interview, which were reviewed by the team. As depicted in Figure 1, the centre of the individual maps displayed relevant details of each participant, such as their participant code, their role and discipline, work setting and age. Key concepts (e.g. impact of COVID, technology) related to the research questions and aims were depicted as branching off the central idea. Sub-concepts (e.g. discharge processes, caregivers) depicted smaller categories that described important aspects of the key concept. As a single word or phrase was insufficient to describe the sub-concepts adequately, we included bullet points underneath the sub-concepts to explain them. Lines were used to demonstrate the relationships between the central idea, key concepts, and sub-concepts. In cases where HS felt additional explanations of the sub-components should be discussed, but could not fit on the single slide, notes in the PowerPoint slide were included. These notes were used to facilitate discussions with the team during the team meetings within the subsequent stages of analysis. Example of individual map.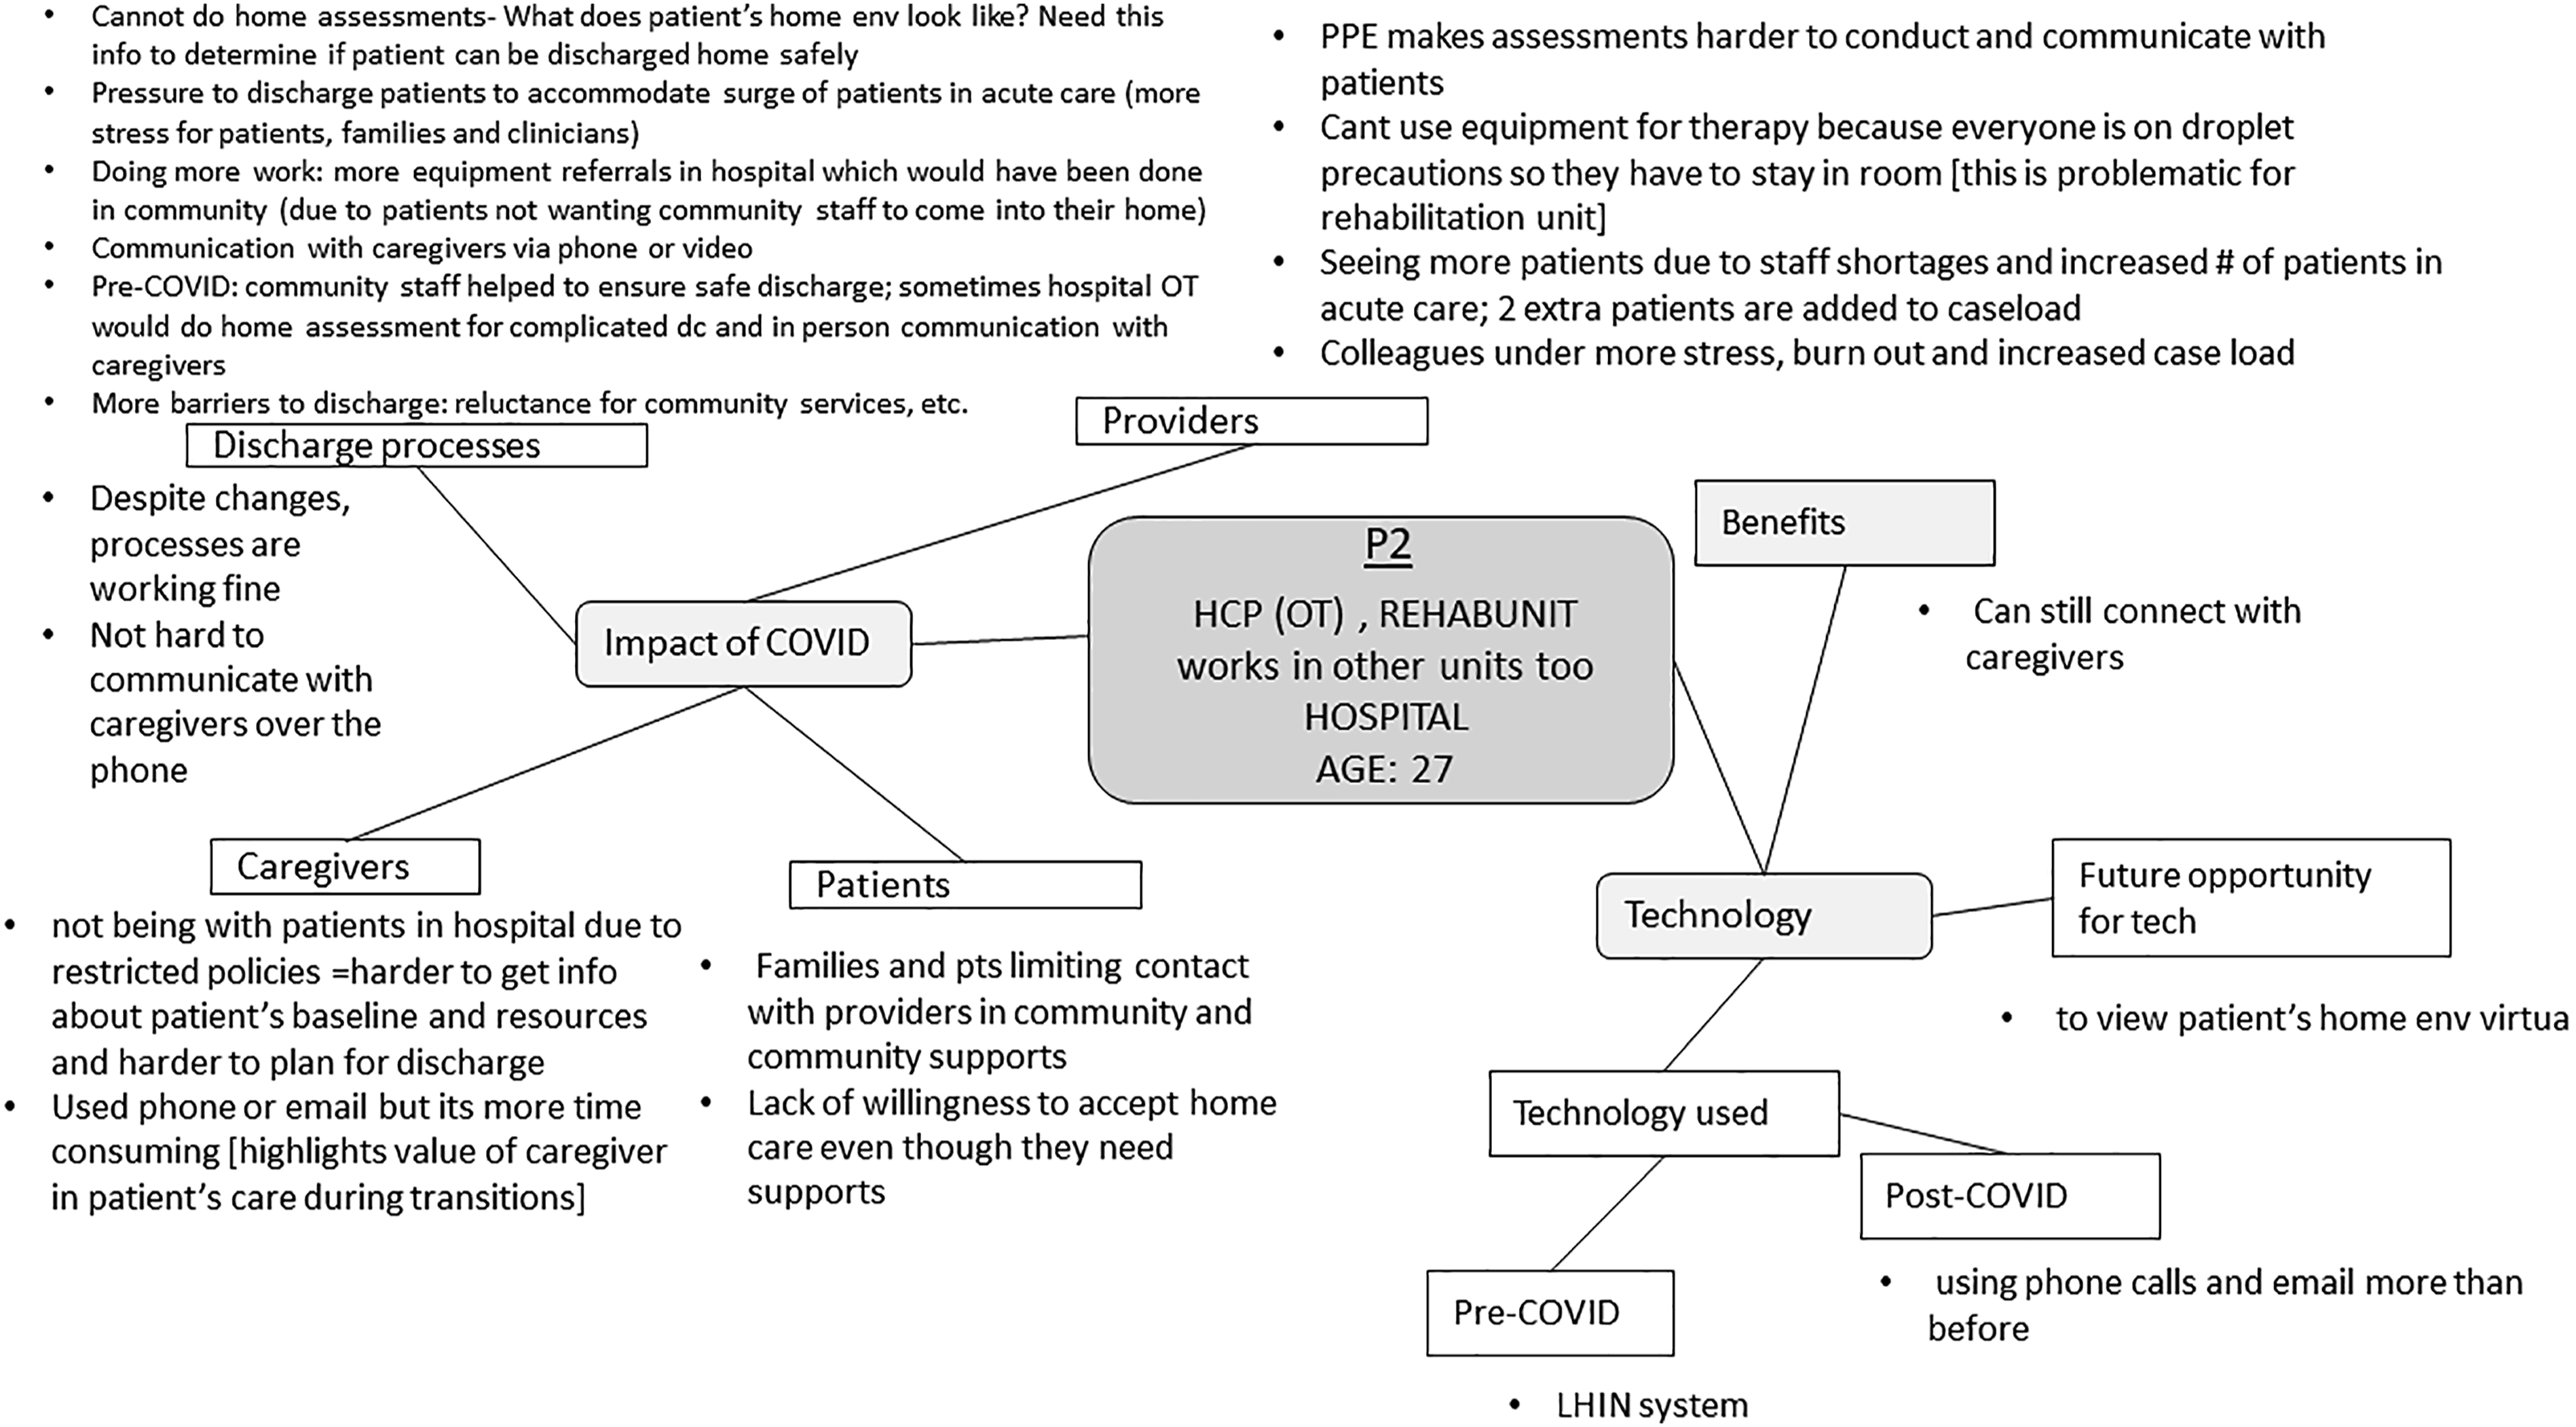
Stage 5: Modify individual maps
Six individual maps were reviewed synchronously during virtual team meetings, while two or three team members examined the remaining 10 individual maps asynchronously. Two to three analytical research team members reviewed each interview asynchronously, from which analytical interpretations were formed. Synchronous team meetings, lasting between one to 2 hours, were conducted using Zoom to discuss the team’s understanding of the raw data. The individual maps were sent to the team prior to the meeting. During the team meetings, HS provided an overview of the individual maps. Share screen was used to display the individual map during the discussion to ensure each team member could visually analyze the data. For instance, during the team discussions of the individual map for P2, HS reviewed the content within each key concept (represented within the squares in Figure 1) with members of the analytic research team. After this, the other team member(s) compared their own field notes to the content depicted on the individual map. After consulting her field notes, one team member indicated that stress was not captured within the individual map (Figure 1). The team member further explained that she heard a “sense of stress” when listening to P2’s interview recording, and P2 indicated that “colleagues were under more stress and burnout.” HS agreed and added this analytic interpretation to Figure 2. In this way, the individual maps were modified based on team members’ consensus about interpretations to ensure that essential ideas were not missed or overlooked. Regarding the asynchronous review of individual maps, HS sent the individual maps to team members and asked them to review and update them based on their own field notes. Due to several factors, including one team member practicing clinically and others having additional caretaking responsibilities with the shift to virtual schooling, asynchronous options to modify maps were highly valuable during this time as scheduling synchronous meetings to review each individual map became difficult. Different team members were assigned to analyze data by Site: HS, JXN, TT and HS, RT, AA, CSG analyzed data from Site A and Site B, respectively. However, one team member HS, the lead analyst, was involved in analyses for both Sites. Example of team revisions to individual map.
Stage 6: Identify patterns among individual maps
After reviewing all individual maps, synchronous team meetings were used to discuss the teams’ interpretations of the maps. We decided to explore patterns among and between maps by combining individual maps to form meta-maps based on provider setting (e.g. hospital providers and community providers), discipline (e.g. physicians) as well as Site (e.g. Site A and B).
Stage 7: Combine and collate individual maps to form meta-maps
HS created various meta-maps, which were used as a tool to facilitate team discussions in stage 8 to determine which combinations of data were the best fit. For example, meta-maps (n = 5) were created for: i) Site A hospital providers, ii) Site A community providers, iii) Site B hospital providers, iv) Site B community providers, and v) physicians to explore whether subgroup perspectives differed from the other providers.
Stage 8: Discuss and debrief about meta-maps
Inter-organizational differences between Site A and B were first analyzed separately by team members assigned to analyze data from each Site. During their review of meta-maps, the team reflected on the similarities and differences between the maps and possible reasons for differences. HS, who was involved in analyses at both Sites was responsible for reviewing the team’s analytic interpretations and had noted similarities among provider experiences at both Sites. This relationship was explored in a large team meeting with team members who were involved in the analyses at Site A and B. The two maps from hospital providers and community providers from Site A and B were then combined after a discussion where team members met to compare findings from Site A and B and formulated an overall interpretation based on similarities and differences between the sites. We did not note significant discipline-specific differences that would necessitate mapping physician data separately.
Stage 9: Finalize and verify the analysis
The last virtual team meeting was held to review and revise the themes and create a final map. The best-fit meta-maps were reviewed during the team meeting and further refined to enhance clarity. For instance, the team revised the wording and components within the themes and subthemes to ensure they reflected the essential components of the data and related to the research questions. Finally, two research team members extracted supporting quotes from the audio who conducted the interviews to illustrate the final themes.
Discussion: Methodological Insights
In this study, we provided an overview of a virtual team-based rapid qualitative method within a study that explored health care providers’ perspectives of how the COVID-19 pandemic has impacted hospital-to-home transitions. We strived to balance timeliness with rigour and analytical depth using the virtual team-based rapid qualitative method to explore healthcare providers’ experiences of transitional care during the COVID-19 pandemic. Below we discuss the lessons learned in applying this method and recommendations for changes that could enhance timeliness and rigour.
Lesson #1: Impact on timeliness
Timeliness was improved with the rapid and virtual aspects of this team-based rapid qualitative method. As it was rapid, we analyzed interview recordings directly, reducing costs, time and resources associated with generating and analyzing transcripts (Burgess-Allen & Owen-Smith, 2010; Coffey, 1996; Northcott, 1996). Timeliness is noteworthy as with traditional qualitative methods, resources dedicated to transcripts can often be substantial. For instance, in one study, 18 interviews that were 50-minutes in length resulted in 324 pages of data and over 300 hours to transcribe (Northcott, 1996). Another benefit of directly analyzing interview recordings is that it can reduce the risk of misinterpreting dialogue as the researchers can hear the participant’s tone, inflection, and pauses (Oliver et al., 2005). Finally, timeliness was enhanced by assigning specific team members to analyze Site A and B data with a team member familiar with both sub-teams (steps 2–6 in Table 1), allowing multiple analysis activities to co-occur.
While timeliness was increased in some regards, some unintended and unforeseen consequences decreased expediency. First, since the research team was trained and accustomed to analyzing transcribed data, research team members reflected that they found themselves transcribing parts of the interviews when listening to recordings rather than taking down their analytical interpretations. While this became easier over time, it decreased timeliness. Second, not transcribing the interview data increased timeliness in terms of turnaround time between data collection and analysis, but it took time to locate supporting quotations when reporting the results. In retrospect, we would recommend extracting key quotes while listening to the transcripts in stage 3 (Table 1) using time stamping so that quotes can be listened to again in context later, rather than during the higher-level analysis in stage 9 (Table 1), as it was time-consuming to locate specific quotes from the recordings based on memory and field notes. Another option to enhance timeliness in future studies is to use the Zoom transcription feature, which automatically transcribes recorded data (McMullin, 2021).
Lesson #2: Impact on rigour
Rigour in the team-based rapid qualitative methodology.

While rigour was increased in some respects, some unintended and unforeseen consequences decreased rigour. The methods employed differed with different participants (e.g. phone vs. video interviews, duration of team meetings, number of reviewers analyzing each interview, asynchronous review of data). While some evolution of methods, particularly when utilizing new approaches, can be expected, this inconsistency and lack of structure may have reduced methodological rigour, namely consistency (Cypress, 2017). Thus, in future studies that employ this method, we recommend establishing roles and responsibilities early in the process and including a lead analyst as we had done (Giesen & Roeser, 2020). This is important as it ensures the timely production of results. Table 2 exemplifies the roles and responsibilities assigned to research team members to enhance rigour concepts of consistency, truth value and neutrality. We also recommend creating a strategy for modifying the maps (e.g. assigning a specific font/colour to each researcher) before stage 5 (Table 1), which we found to be another challenge in this process. Tables may be incorporated into the analysis process, which may help alleviate some of the challenges above and improve the audit trail. Finally, incorporating participants’ feedback on maps in stages 4 and 9 (Table 1) would help to enhance truth value and neutrality further.
Lesson #3: Analytical depth
While we did not note a loss of depth within the virtual interview, findings from a scoping review suggested that participant responses are shorter than face-to-face interviews (Davies et al., 2020). Our interviews ranged from 17 to 52 minutes (Singh, Under review); the shorter interview resulted from the provider being new in her position and unable to compare pandemic-related changes to the pre-pandemic context. Perhaps this may be due to the nature of the content being studied. The review examined studies that examined health and illness experiences (Davies et al., 2020), whereas our study examined provider experiences with care provision. While not encountered within this study, another possible factor to consider that could limit the depth of virtual interviews is the participant’s technical skills. If individuals are unfamiliar with the virtual mode of data collection (e.g. Zoom), it may be helpful to conduct a training session prior to the interview and create a plan in case of technical errors (Santhosh et al., 2021).
In terms of depth within our analysis, we used visual mapping, a technique used in rapid qualitative research. We selected this approach as it can be used to analyze large amounts of qualitative data, and we anticipated it would be suitable for a virtual team-based analysis (Burgess-Allen & Owen-Smith, 2010; Northcott, 1996; Petro, 2010). Petro and colleagues define a visual map as “a two-dimensional or representation or a visual diagram of the critical information and concepts being discussed,” wherein the central idea is located in the middle of the map. At the same time, the branches are topics relevant to the main idea (Petro, 2010). We initially feared that depth might be lost in the analysis due to concerns that team members may have difficulty following the discussion or ‘being on the same page’ during the virtual team meetings. However, the visual maps enhanced our analytic depth. Using visual maps can trigger formative and creative thinking by stimulating both sides of the brain, allowing researchers to present the entirety of the contents on a single page (Petro, 2010). We found visual maps were a valuable tool in our analysis as they allowed our team to i) summarize critical concepts from the recorded interviews on a single page, ii) review pertinent information during team meetings and keep the team focused on the topic, iii) trigger discussion about what was missing, iv) revise the visual maps based on input from multiple team members, and v) generate an audit trail.
Lesson #4: Virtual methods
We used virtual technologies and tools for data collection and team-based data analysis. Virtually conducted data collection was necessary for this project which occurred during the pandemic when public health restrictions required social distancing and restricted hospital visitor policies to minimize transmission of the virus (Herzik & Bethishou, 2021; Tang, 2020). Virtually conducted data collection and analysis allowed us to collect and analyze data while physically distanced. It was also a cost-effective alternative to face-to-face meetings since no travel time, or costs were required (Sah et al., 2020; Sedgwick & Spiers, 2009). Regarding data analysis, using video calls allowed for improved team communication and understanding through non-verbal communication, as well as through sharing information and data using screen share functions. This function allowed the team to co-work on analytic maps together in real-time, which enhanced the speed of analysis as well as the trustworthiness and credibility of interpretations.
The visual mapping supported an effective communication process to support synchronous data analysis (Milford et al., 2017). The visual maps were compatible with virtual team meetings as the maps could be readily displayed using the share screen function on Zoom. Although we expected to do the complete analysis synchronously (Burgess et al., 2021) during the virtual team meetings, this approach was time-consuming and not ideal for team members who worked clinically or may not be comfortable speaking in a virtual group environment. Instead, we integrated a combination of synchronous and asynchronous peer debrief and review activities for feasibility. This approach was timelier than working entirely synchronous as it provided the analytical team time to reflect and contribute thoughtful, analytical interpretations. With traditional qualitative methodologies, only a single research team member (i.e., the interviewer) often listens to the audio recordings while the rest of the team analyzes the resulting transcripts. In our study, we analyzed data by listening to recordings rather than reading transcripts, which allowed each team member to develop a more nuanced understanding of the data. Each was able to appreciate tones, pauses, and inflections. For instance, in one interview, we heard the high degree of stress in one participant’s voice, reflecting the impact of COVID-19 on their workload.
Notably, the method outlined in this paper can be scalable for multi-site studies. Beyond the COVID-19 context, the team-based rapid qualitative methods may be helpful in cross-country or international research as data collection and analysis were able to be completed virtually. Multicountry qualitative research teamwork is receiving increasing recognition in the health field (Milford et al., 2017; Wasser & Bresler, 1996). Teamwork is advantageous, particularly in multicountry qualitative analysis, as it yields more rigorous and relevant findings than individual-level analyses (DeCuir-Gunby et al., 2010; Milford et al., 2017). However, there are limited practical strategies to guide the conduct of multicountry team-based qualitative research (Milford et al., 2017; Wasser & Bresler, 1996). A valuable contribution to this area can be made through the practical approach, but one factor to consider is that the research team members in this study had met in person and had working relationships prior to this entirely virtual analysis. Additional strategies for rapport building among virtual teams that do not have these pre-existing relationships may be required to support strong communication and comfort with providing critical feedback during the analysis required in this method (Gilson et al., 2014).
Some unanticipated outcomes of virtually conducted data collection and analysis and considerations warrant attention. While concerns among the literature that audio interviews can lead to misinterpretations due to a lack of visual cues have been raised (Novick, 2008), we anticipated that these could be mitigated through video interviews (Janghorban et al., 2014). However, nearly all participants in our study (n = 15) preferred audio rather than video interviews, including two participants that started the meeting with video enabled but turned it off for the recording. Although we did not explicitly inquire about participants’ reasoning, this may be due to concerns about confidentiality, feeling uncomfortable with video recordings and/or lack of privacy in their surrounding environment (e.g. being in a shared space with their colleagues at the time of the interview). Researchers should consider participants’ location and offer options for audio-only to accommodate these situations.
In the analysis stage, we experienced confusion about the level of detail to include in the maps to capture all relevant information on a single Powerpoint slide. For clarity, we recommend explicitly discussing the level of detail to fit within the maps and including field notes to supplement or expand on key concepts identified in the maps. We also recommend using virtual tools that offer larger canvases (e.g. Miro boards (Miro, 2022)) so that researchers are not limited to a single page. Finally, since this method was applied to a virtual project, it may not apply to data collected and analyzed within in-person settings.
Practice recommendations.

Conclusions
In conclusion, the turbulent COVID-19 pandemic forced researchers to explore alternative approaches to traditional qualitative research to support rapid and rigorous findings. The lessons learned from using the team-based rapid qualitative method presented here may be helpful for other virtual qualitative studies that aim to generate rigorous and in-depth results in a timely manner.

Example of a meta-map.
Footnotes
Acknowledgments
We would like to thank the participants for dedicating their time to this study.
Declaration of Conflicting Interests
The author(s) declared no potential conflicts of interest with respect to the research, authorship, and/or publication of this article.
Funding
The authors disclosed receipt of the following financial support for the research, authorship, and/or publication of this article: This work was supported by the Canadian Institutes of Health Research, Team Grant: Transitions in Care (FRN 165733) and the March of Dimes Paul J.J. Martin Early Career Professorship to HS. The funder did not have a role in the study design; in the collection, analysis and interpretation of data; in the writing of the report; and in the decision to submit the article for publication.