
Abstract
In the United States, there are substantial barriers to youth nature access and environmental education (EE). These barriers may lead to racial, geographic, and socioeconomic disparities in both nature contact and environmental awareness. This study investigated the impacts of a Photovoice EE intervention on the environmental perceptions, STEM-capacity, and environmental awareness of 335 low-income, urban youth (ages 9–15). Youth were assigned to one of two intervention groups, a Photovoice EE intervention group or an EE intervention group without a Photovoice activity, or a control group. The Photovoice activity revealed that participants perceived the environment in three major subthemes: social, natural, and built. Photovoice participants expressed both positive and negative sentiments toward their environment. After the EE intervention, Photovoice participants experienced greater improvements in STEM-capacity scores than those who participated in the EE intervention without the Photovoice activity (p = .04). Further, EE participants experienced improved STEM-capacity and environmental awareness scores (p < .001), while a control group of youth who did not participate in the EE intervention did not experience any significant improvements in STEM-capacity or environmental awareness. Study results suggest that the Photovoice activities may be associated with improved learning outcomes. Larger intervention studies are necessary to confirm the benefits of Photovoice in Environmental Education.
Keywords
Introduction
Environmental Education (EE) is a transdisciplinary conservation strategy that facilitates place-based and nature-centric learning to develop future environmentalists, scientists, decision-makers, and active community members (Ardoin et al., 2013, 2020). Many studies have shown that environmental education can improve participants’ science knowledge, environmental awareness, and environmental knowledge (Bergman, 2016; Bradley et al., 1999; Ekenga et al., 2019; N. Sprague et al., 2020; N. L. Sprague & Ekenga, 2021), leading to increased pro-environmental conservation behaviors (Short, 2009; Steffen et al., 2011). High-quality EE is a potential solution to halt or stagnate human-driven climate change, biodiversity loss, overuse of natural resources, environmental health disparities, deforestation, and other human-caused environmental issues (Ardoin et al., 2013; Jucker, 2002; Steffen et al., 2011).
The need for high-quality EE in the United States (US) is rising as youths’ environmental awareness has declined since the mid-1970s (Wray-Lake et al., 2009). Research has shown that nature contact, specifically during childhood and adolescence, increases environmental awareness and pro-environmental conservation behaviors (Fretwell & Greig, 2019; Nisbet et al., 2009; Orr, 2004; Rosa et al., 2018) Therefore, the decline youths’ environmental awareness may be explained by the increasing prevalence of childhood nature deprivation (Kahn & Kellert, 2002; Larson et al., 2010; Louv, 2008).
In the US, there are significant racial and socio-economic childhood nature deprivation disparities (Larson et al., 2010; Lee et al., 2001; Williams et al., 2020). Oftentimes, low-income and non-White children have less access to nature and greenspace than their high-income or White counterparts (Casey et al., 2017; Jennings et al., 2017; Lovasi et al., 2013; Schwarz et al., 2015). Furthermore, EE has been criticized for lack of equitable and culturally relevant opportunities for non-White and urban populations (Miller, 2018). Therefore, it is reasonable to assume that the inequities in access to EE and nature contact may play a role in racial disparities of environmental and ecological awareness (environmental awareness). A number of youth-focused EE intervention studies have found that, at baseline, White youth have higher environmental awareness than their non-White counterparts (Larson et al., 2010; Staples et al., 2019). However, after engaging in the EE intervention, all racial groups experience similar improvements to environmental awareness scores (Larson et al., 2010; Staples et al., 2019).
Photovoice: A Community-Based Participatory Research Method
Photovoice, a qualitative community-based participatory research method, uses community-members’ knowledge and perspective to address knowledge gaps in academia, research, and policy-making (Belon et al., 2016; C. C. Wang, 1999). Briefly, Photovoice engages participants through imagery (by taking photos on a given topic) and narrative (by discussing these photos in a focus group setting; Ciolan & Manasia, 2017; C. Wang & Burris, 1997). Photovoice is most frequently used in public health research, but has been adapted to many academic fields (Catalani & Minkler, 2009; Kong et al., 2015; Schumann et al., 2019). The purpose of Photovoice is to empower individuals and communities that are traditionally neglected from research and policymaking discussions (Madrigal et al., 2014; C. Wang & Burris, 1997). Photovoice may be an effective leadership development tool for youth, as it demonstrates to youth that their opinions and views can lead to change (Madrigal et al., 2014; Wilson et al., 2007). Specifically, Photovoice has been used as a tool to engage low-income and non-White youth in social change and civic engagement (Gant et al., 2009; Leung et al., 2016; Wilson et al., 2007).
In general education and EE research, Photovoice is seen as a tool to enhance students’ learning (Chanse et al., 2017; Ciolan & Manasia, 2017; Harkness & Stallworth, 2013). Participants are asked both to take a photo on and discuss a given topic, thus causing them to think both visually and personally about that topic (Abma & Schrijver, 2020; Ciolan & Manasia, 2017; C. Wang & Burris, 1997). Both visualization and personalization are educational tools to promote learning, cognitive outcomes, and students’ interest (Harackiewicz et al., 2016; Høgheim & Reber, 2015; Winn, 1982). In EE, studies have shown that engaging participants in community-based participatory research both enhances the goals of EE as well as more effectively encourages students to advocate for and create eco-friendly change (Chanse et al., 2017; Mordock & Krasny, 2001).
This study investigates the STEM-capacity, environmental perceptions, and environmental awareness of low-income youth that participated in one of two interventions: (a) an EE intervention in which youth engaged in a Photovoice activity (Photovoice intervention group) or (b) an EE intervention without a Photovoice activity (traditional intervention group). We also evaluated outcomes among a control group of youth that did not participate in either intervention. Study outcomes were evaluated using a pre-/post-questionnaire study design comparing participants’ STEM-capacity and environmental awareness before and after the intervention time period. We hypothesized that post-intervention STEM-capacity and environmental awareness scores would be highest among the Photovoice intervention group, second highest among the traditional intervention group, and lowest among the control group.
Method
During the Fall 2019 semester (August–December), a non-profit organization, Gateway to the Great Outdoors (GGO), in partnership with Washington University in St. Louis, administered the EE interventions to St. Louis Public School District students. The St. Louis Public School District is the largest, non-specialized school district in the metropolitan St. Louis area (“St. Louis’ largest school districts,” 2019). Several studies have shown that students in the St. Louis Public School District face significant environmental health disparities compared to neighboring school districts, specifically regarding the built environment (Arroyo-Johnson et al., 2016; Ekenga et al., 2018). GGO partnered with seven St. Louis Public School District schools during the Fall 2019 semester. All St. Louis Public School District schools that GGO partnered with had a student body that 95% or more qualified for free or reduced lunch through the National School Lunch Program and the School Breakfast Program.
Study Participants
A total of 335 St. Louis Public School District students participated in the current study. The photovoice intervention group had 38 participants, the traditional intervention group had 232 participants, and the control group had 65 participants. Participants of the study were non-randomly assigned to the Photovoice intervention, the traditional intervention, or the control group based on their school and classroom. School administrators and teachers selected which classrooms participated in the intervention. Control groups were selected within the same school, in order to match socio-economic and racial demographics of the intervention group. The Institutional Review Boards at Washington University in St. Louis and Columbia University approved this study.
Participant Characteristics
Table 1 presents the demographic information for the Photovoice intervention group, the traditional intervention group, and the control group. The traditional intervention group’s mean age (11.1 years old) was significantly younger than the Photovoice intervention group’s (12.6 years old) and the control group’s (12.7 years old). There were no significant differences in the mean age of the Photovoice intervention group and the control group (p > .05). Although there were no other significant differences among the three groups, there were significant differences in racial composition between the traditional intervention group (88% Black) and the control group (99% Black).
Baseline Characteristics of the Final Sample, by Intervention Group.

Note. n = 335.
a p value refers to χ2 test for categorical variables and t test for continuous variables for differences between the Photovoice Intervention Group and the Traditional Intervention Group. b p value refers to χ2 test for categorical variables and t test for continuous variables for differences the Photovoice Intervention Group and the Control Group. c p value refers to χ2 test for categorical variables and t test for continuous variables for differences between the Traditional Intervention Group and the Control Group. d Black includes 279 Non-Hispanic Black and 25 Hispanic Black. e Other includes eight American Indian or Alaska Native, seven Asian, six Hispanic White, three Non-Hispanic White, and seven self-identified as “Other.”
Bold type indicates statistical significance (p < .05).
Environmental Education Intervention
The EE intervention included both weekly interactive environmental education in-class lessons and monthly nature-based outings. A team of professionals with master’s or doctoral degrees in education, biology, environmental science, and public health helped to develop the in-class lessons and monthly outings to align with Missouri Learning Standards, Next Generation Science Standards, and the United States Environmental Protection Agency’s lesson plans (“Lesson Plans, Teacher Guides and Online Environmental Resources for Educators,” n.d.; “Missouri Learning Standards,” 2016; “Next Generation Science Standards: For States, By States,” n.d.; N. Sprague et al., 2020). Sample learning objectives included understanding the differences between composting, recycling, and trash; investigating different forms of pollution and remediation techniques; and comparing and contrasting renewable energy and nonrenewable energy (N. Sprague et al., 2020). The weekly in-class lessons and monthly outings were facilitated by volunteer undergraduate mentors that were trained and supervised by GGO staff and St. Louis Public School District teachers. The weekly lesson plans and units for the in-class lessons and monthly field trips are displayed in Table 2.
Environmental Education Curriculum.

Photovoice Environmental Education Intervention
The Photovoice intervention differed from the traditional EE intervention only in that it included a Photovoice activity. One intervention class of students (38 youth) was assigned to this Photovoice intervention group. During the second class of the intervention, students participating in the Photovoice intervention received disposable cameras and had a 60-min lesson on how to properly use disposable cameras and how to take photographs with participant consent. These students were then instructed to take photographs on their own that represented their environment for the next week.
During the third class, the disposable cameras were collected, and the students participated in the lesson plan designated for week 2. The photos from the disposable cameras were developed and brought to the classroom for the 4th week of the intervention. Twelve trained research assistants held focus groups of two to four students to discuss the photos that represented the environment. The research assistants instructed the youth to tell a story about a handful of their photographs. The interviewer had the participant select the photograph that was most meaningful for him/her to discuss. The interviewer asked a series of predetermined questions about the selected photo (Appendix). The interviewer was encouraged to probe the participants with additional questions when appropriate to allow flexibility in discussions. The focus group discussions lasted for the entire class period (60 min). Each focus group was recorded and then later transcribed.
Data Analysis
We conducted two sets of analyses. First, we conducted thematic analysis of the Photovoice interviews. Second, we conducted a pre/post questionnaire analysis of STEM-capacity and environmental awareness outcomes.
Photovoice analysis
The Photovoice interview transcripts were analyzed using Braun and Clarke’s six-step method of qualitative analysis (Braun & Clarke, 2006). Briefly, these six steps are that the reviewers (1) familiarized themselves with data, (2) developed preliminary codes, (3) searched for themes within the preliminary code, (4) evaluated potential themes, (5) labeled and defined themes, and (6) developed a final report (Braun & Clarke, 2006). We first had four trained reviewers conduct a preliminary analysis to familiarize themselves with the Photovoice focus group transcripts. Individually, the reviewers developed potential thematic codes for the transcripts. Then, the four reviewers collaboratively evaluated the proposed themes and developed the official themes. A fifth reviewer, who purposefully did not attend the meeting, revised and approved the final set of themes.
Two independent reviewers coded each theme for every transcript. The agreement between the two independent reviewers’ sets of codes was determined through the Kappa statistic. Briefly, scores range from −1.0 to 1.0, where −1.0 indicates complete disagreement and 1.0 indicates complete agreement (Hallgren, 2012). Landis and Koch suggest that scores of 0.61–0.80 represent substantial agreement and scores 0.81–1.0 represent strong agreement (Landis & Koch, 1977).
Pre/post questionnaire analysis
All 335 study participants completed a 22-item, self-administered pre-intervention (pre-) and post-intervention (post-) questionnaire (N. L. Sprague & Ekenga, 2021). The questionnaire included a STEM-capacity score that was calculated by the youths’ responses to the following statements: (1) I am a leader, (2) I work well in a team/group, (3) Science is important for the problems in our community, (4) Sustainability/nature is important in my daily life, (5) Science and technology are too hard for me to understand, and (6) It is important to stay up to date on science issues. Students could answer no (+0), maybe (+1), or yes (+2). Question number 5 was reverse scored. The scores for all six questions were summed to provide a STEM-capacity score. The STEM-capacity score ranged from 0 (little/no STEM-capacity) to 12 (high STEM-capacity). We ran paired Wilcoxon signed-rank tests to analyze significant differences in STEM-capacity scores.
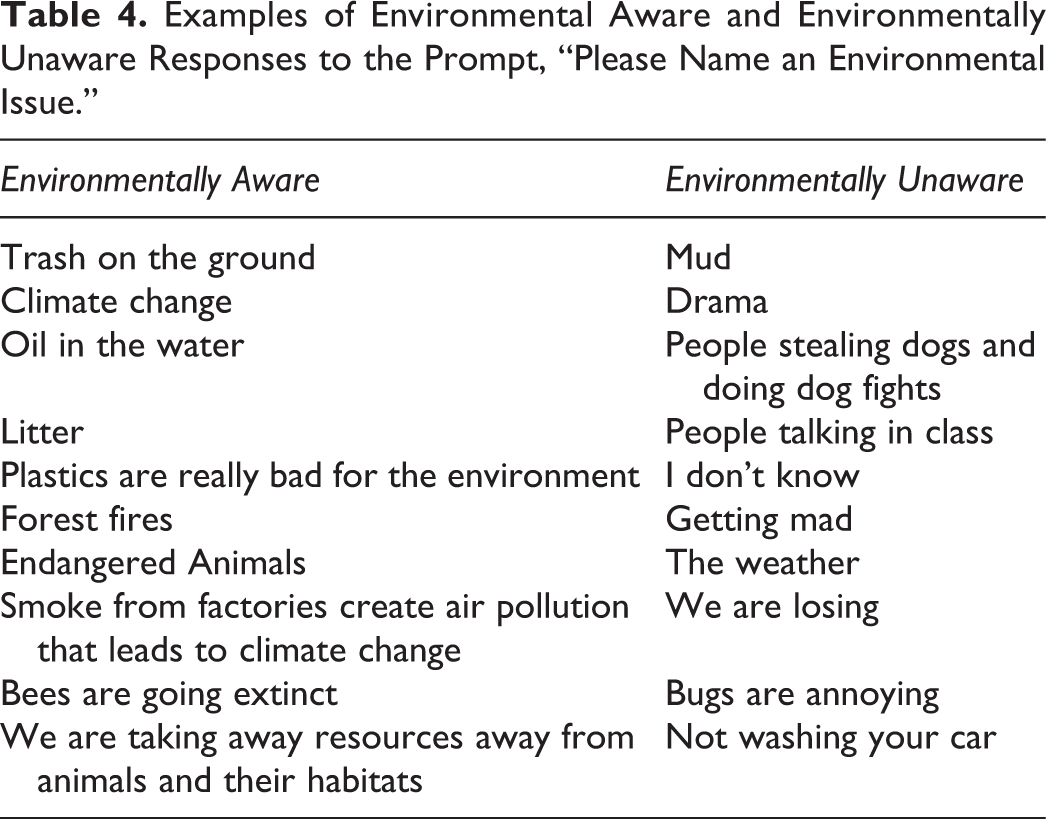
The questionnaire also included a question to assess the participant’s environmental awareness (“Please name an environmental issue”). Two trained reviewers independently coded the answers to the environmental awareness question. If the youth was able to name an environmental issue, the answer was coded as 1 (aware). If the youth was unable to name an environmental issue, the answer was coded as 0 (unaware). There was one discrepancy in coding (out of a possible 724), which was resolved by discussion (Campbell et al., 2013). Once the reviewers reached full agreement on coding, we calculated the pre-intervention and post-intervention prevalence of environmental awareness for the Photovoice intervention group, the traditional intervention group, and the control group. We then ran two-proportion Z tests to analyze significant differences in the prevalence of environmental awareness. All statistical analyses for the questionnaire analysis were performed in R and RStudio.
Results
Qualitative Results From Photovoice Analysis
We analyzed each focus group transcript. The results, presented in Figure 1, were categorized into two major themes: environmental perceptions and environmental sentiments. Environmental perceptions were coded into the following subthemes: social environment, natural environment, and built environment. Positive and negative were the two subthemes for environmental sentiments. The inter-rater agreement for each subtheme ranged from a Kappa score of 0.61 for the built environment to a score of 0.82 for the social environment.

Themes and subthemes from Photovoice focus groups.
Environmental perceptions
Environmental perception themes describe how participants interpreted the term environment. Thematic analysis revealed a total of three major subthemes for environmental perceptions: social environment, natural environment, and built environment (Figure 2).
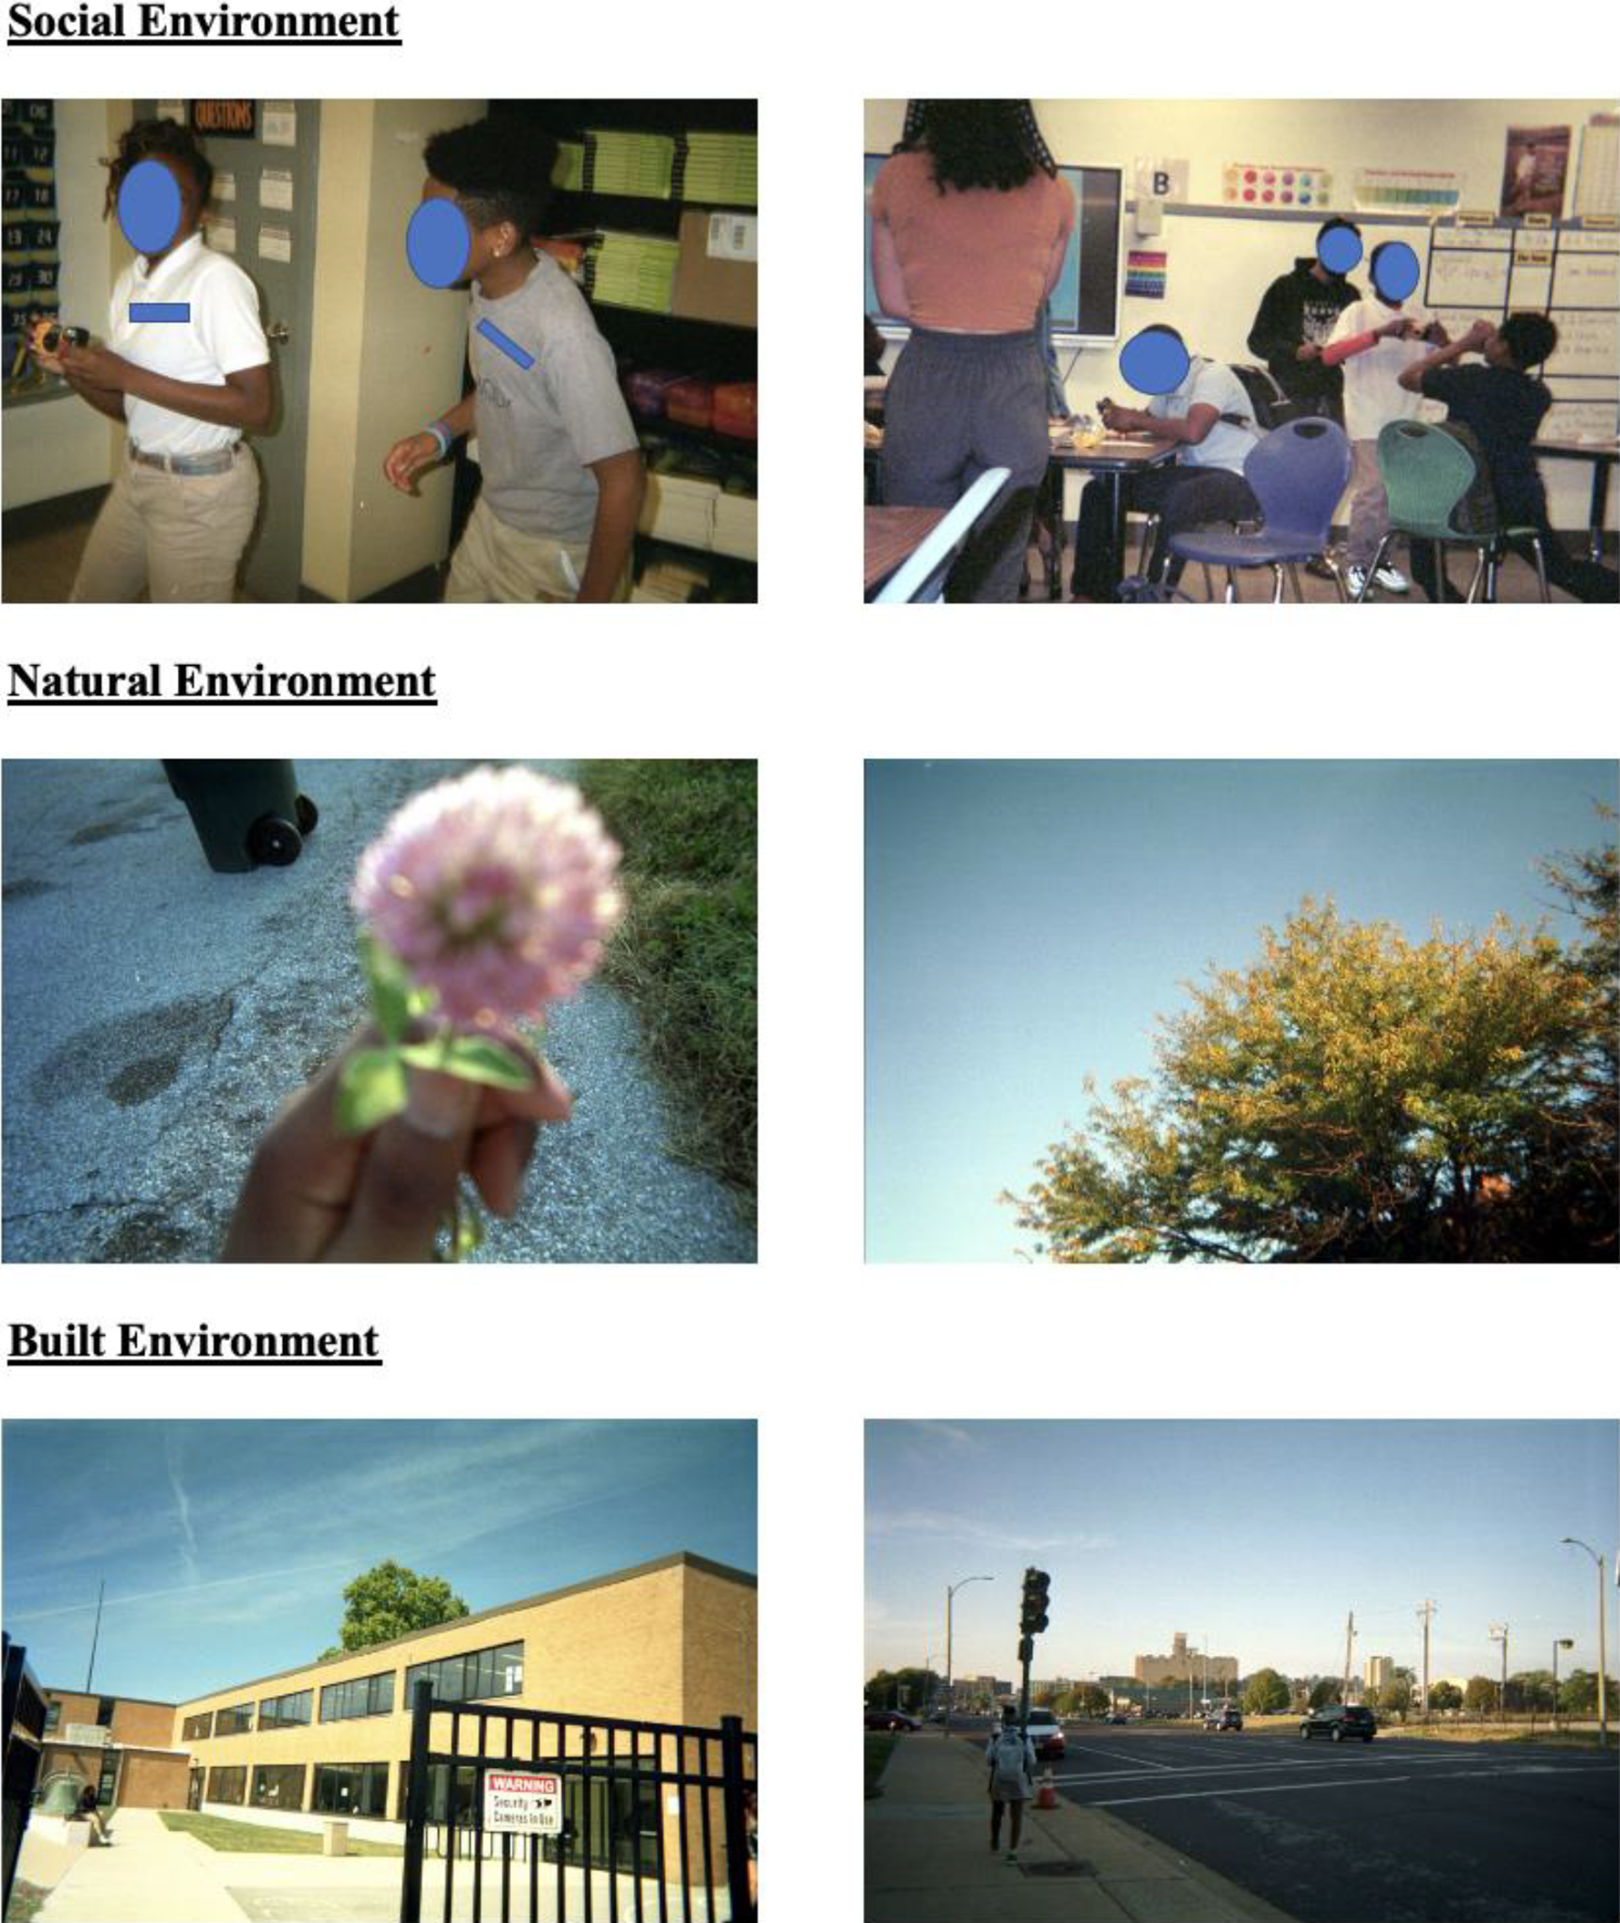
Example photographs of environmental perception subthemes.
Social environment
Student photos described the environment through depictions of the people they interact with. Almost all the participants defined social environment as being with other people as well as an opportunity to bond and have meaningful conversations. Most commonly, these students defined “environment” as individuals that they are closely familiar with, such as family members and close friends. For example, one student took a picture of his “Aunty…while she was asleep.” Others define it as being with classmates and teachers. As one participant stated, “It’s just very family like. The teachers are very caring, and they care about us.”
While describing the social environment, participants often described being outside with friends. Often, participants discussed engaging in sports with friends and family. One participant said, “Me and my friends, and we go to play basketball. You can meet with your friends after school and do activities and fun stuff.” Participants typically viewed experiences outside with friends positively. A participant discussed going to a field with friends as “a tradition. It is really important to us…that’s something that makes me happy.”
Natural environment
Photos under the natural environment theme consisted of landscapes not significantly impacted by human influence. Students photographed both large landscapes/ecosystems and living organisms. Examples of large landscapes and ecosystems included the “the sky,” “a sunrise,” and a “grass field.” Examples of living organisms included “flowers” and “animals.” Some described the tangible objects in the picture (such as trees, rivers, flowers), while others discussed the colors.
Built environment
Photos categorized under the built environment theme consisted of areas that were constructed or designed by humans. A majority of the built environment photos were areas designed to encourage outdoor play and activity, such as “Forest Park” (a 1,300 acre St. Louis City Park [“About Forest Park,” n.d.]), a student’s “backyard,” and “a[n outdoor] swimming pool.” Other students took photos of their neighborhoods and local infrastructure. Local infrastructure included schools, museums, and roads.
Environmental sentiments
Participants expressed a range of sentiments toward the environment. We coded these emotions into two subthemes: positive and negative.
Positive sentiments
When describing their pictures of the environment, a large portion of students expressed positive perceptions. Students reported being happy and/or calm while spending time outside as well as when they were able to appreciate pretty views and scenery. Many students associated their happiness with colors they found in nature. For example, in response to the question, “What in this picture makes you happy?”, one student stated, “The color. I mean green. I like nature, so green makes me happy.” Other students expressed positive sentiment toward interacting with people in their social environment, specifically friends and family members.
Negative sentiments
A few students expressed negative perceptions when describing aspects of their pictures that depicted their environment. A majority of these negative emotions were due to limited access to a desired space or due to the limited size of and resources in a particular space. For example, in describing their backyard, one student stated that they were “sad because it’s small and I ain’t got no space to run.” A few students noted negative perceptions about seasonal changes in nature during Fall and Winter months, such as trees without leaves or lack of snow during winter. For example, one student, referring to their picture, explained their negative emotions: “It makes me sad because when the tree dies, it just looks raggedy. When trees die, they look bad in the winter.” Another student expressed their disappointment about nearby traffic and noise during their daily walking commute to school: “I wish there was less cars passin’.”
Questionnaire Results
STEM-capacity
The Photovoice intervention group, traditional intervention group, and the control group’s mean pre- and post-STEM-capacity scores are presented in Table 3. The Photovoice intervention group did not have significantly different mean baseline STEM-capacity scores compared to the traditional intervention group or the control group (both p > .05). However, the traditional intervention group had significantly higher baseline mean scores than the control group (p = .03).
Pre- and Post-Intervention STEM-Capacity Scores.

a p value refers to an unpaired Wilcoxon signed-rank test between Photovoice intervention group and traditional intervention group. b p value refers to an unpaired Wilcoxon signed-rank test between Photovoice intervention group and control group. c p value refers to an unpaired Wilcoxon signed-rank test between traditional intervention group and control group. d p value was calculated by a paired Wilcoxon signed-rank test for within-group pre-/post-intervention.
Bold type indicates statistical significance (p < .05).
After the intervention, both intervention groups saw significant improvements, while the control group saw declines in STEM-capacity (all p < .001). The mean STEM-capacity scores for the Photovoice intervention and the traditional intervention group increased from 6.8 (SD = 2.0) to 10.8 (SD = 0.9) and 7.3 (SD = 2.8) to 10.3 (SD = 1.3), respectively, while the control group’s STEM-capacity decreased from 6.5 (SD = 2.9) to 4.4 (SD = 2.5). After the intervention, the Photovoice intervention group had significantly higher STEM-capacity scores than both the traditional intervention group and the control group (both p < .05). The traditional intervention group’s STEM-capacity was also significantly higher than the control group’s mean score (p < .001).
Environmental awareness
Example answers to the environmental awareness question are presented in Table 4. Table 5 displays the pre- and post-prevalence rate of environmental awareness for the Photovoice intervention group, traditional intervention group, and the control group. There were no significant differences in prevalence of environmental awareness between the Photovoice intervention group and the control group prior to the intervention (p = .42). The Photovoice intervention group and control group both had significantly higher baseline environmental awareness prevalence than the traditional intervention group (both p < .05).
Examples of Environmental Aware and Environmentally Unaware Responses to the Prompt, “Please Name an Environmental Issue.”
Pre- and Post-Intervention Prevalence Rates of Environmental Awareness.

a p value refers to two-proportions z test between Photovoice intervention group and traditional intervention group. b p value refers to two-proportions z test between Photovoice intervention group and control group. c p value refers to two-proportions z test between traditional intervention group and control group. d p value refers to two-proportions z test for within-group pre-/post-intervention prevalence.
Bold type indicates statistical significance (p < .05).
Both the Photovoice intervention group and traditional intervention group saw significant increases in environmental awareness after the intervention (both p < .001; Table 5). The Photovoice intervention group’s environmental awareness prevalence increased from a baseline prevalence of 28.9% to a post-intervention prevalence of 100%. While the traditional intervention group’s environmental awareness prevalence increased from 9.5% to 95.7%. There were no significant changes between the control group’s pre-/post-environmental awareness prevalence.
After the 15-week intervention, both the Photovoice intervention group and the traditional intervention group had significantly higher environmental awareness prevalence rates than the control group (both p < .001). The difference in environmental awareness prevalence rates between the Photovoice intervention group and the traditional intervention group were not significant (p = .40).
Discussion
This study evaluated the environmental perceptions, STEM-capacity, and environmental awareness of low-income youth participating in two interventions: a Photovoice EE intervention and a traditional EE intervention without Photovoice. We found that the youth perceived the environment in three major thematical categories: social, natural, and built environment. Youth expressed both positive and negative sentiments toward their environment. Both the Photovoice and traditional intervention group experienced significant improvements in mean overall STEM-capacity and prevalence of environmental awareness. Meanwhile, the non-intervention control group saw significant declines in STEM-capacity and no significant change in environmental awareness prevalence.
Qualitative results from the Photovoice activity provide context for previous quantitative findings. In the current study, we observed that students associated the environment with social interactions as well as outdoor experiences with peers and family members. In our previous studies, we have found that the EE intervention improved youths’ social and familial functioning (Ekenga et al., 2019; N. Sprague et al., 2020; N. L. Sprague & Ekenga, 2021). Taken together, the findings of the current and previous studies are consistent with previous literature that nature-contact improves social connectedness (Leavell et al., 2019).
The Photovoice intervention had a significant impact on STEM-capacity scores. At baseline, the Photovoice and traditional intervention groups’ mean STEM-capacity scores and environmental awareness prevalence rates were not significantly different (both p > .05). However, after the intervention, the Photovoice intervention group had a significantly higher mean STEM-capacity score (p = .04). Additionally, while not statistically significant, after the intervention, the Photovoice intervention group had an 100% prevalence rate of environmental awareness, compared to the traditional intervention’s rate of 95.7%. These findings are consistent with the pedagogical literature on the benefits of Photovoice and other forms of community-based participatory research methods (Ciolan & Manasia, 2017; Harackiewicz et al., 2016; Winn, 1982). One Photovoice study of 40 online students found that Photovoice is an effective way to capture attention, retain information, encourage creativity, and develop community (Perry, 2006). Another article argues that Photovoice is an effective pedagogical tool, as it forces students to engage with their greater community based on topics learned within the traditional classroom (Lichty, 2013). Additionally, a study of 20 youth in Maryland found that Photovoice improved learning outcomes as it empowered students through utilizing their local knowledge of the environment and watersheds, allowing the youth to prioritize issues, and identify potential opportunities or solutions (Chanse et al., 2017).
Prior to the intervention, the Photovoice intervention group and the control group had no significant differences in mean STEM-capacity or environmental awareness prevalence rates (both p > .05). After the intervention, both mean STEM-capacity and environmental awareness for the Photovoice intervention group were significantly higher than that of the control group (both p < .001). These findings are consistent with the literature that EE enhances STEM-capacity and environmental awareness (Bergman, 2016; Bradley et al., 1999; Ekenga et al., 2019; N. Sprague et al., 2020). However, we did not anticipate for the control group’s significant declines in STEM-capacity scores. EE may act as a buffer against STEM interest declines. For example, one longitudinal study of middle school students in urban California and urban Pennsylvania (n = 2,600) found that informal STEM education experiences are the most effective intervention to promote, maintain, as well as prevent declines in students’ value of STEM education (Bathgate & Schunn, 2017). Our observed declines in STEM-capacity of the control group may be due to lack of informal STEM education opportunities, such as EE.
The strengths of this study include the mixed-method study design and inclusion of a control group. However, this study is not without limitations. First, in addition to small sample sizes, study participants were assigned non-randomly to the Photovoice intervention group, traditional intervention group, or control group. Although this approach limited generalizability, our focus groups allowed us to further explore both the environmental perceptions of low-income youth and the potential impact of prolonged engagement through Photovoice. Second, the intervention was only from August to December and the questionnaires did not account for seasonal differences in students’ answers or long-term effects of the intervention. Third, the evaluation did not take into account for potential experiences of the youth during the time of the study that may have confounded the results, such as negative experiences with specific teachers or schools, issues at home or with family members, or negative social interactions with peers. Fourth, although we allowed interviewers to ask additional follow-up questions about student photographs, some of these questions may have been leading and we likely did not capture the full perspective of participants’ environmental perceptions. Lastly, while the STEM-capacity instrument is developed based off of STEM education literature (Ardoin et al., 2018; DeCoito, 2016; Drazan et al., 2017; Falk et al., 2016; Morgan et al., 2019; Price et al., 2019; N. Sprague et al., 2020; Yan et al., 2020) and St. Louis Public School District teacher input, it is not yet a validated measure.
Future steps include larger sample size of students, longer study periods, validating the STEM-capacity measure, and the inclusion of social factors and open-ended questions into the questionnaire. Lastly, the results of the Photovoice activity will inform updates to the GGO EE curriculum as well as future studies. For example, the EE curriculum has already been altered to better accommodate and embrace the participating youths’ perceptions of the environment. Future investigations will examine whether pre-intervention environmental sentiments influence post-intervention outcomes.
Conclusion
In this mixed-methods study of environmental perceptions, STEM-capacity, and environmental awareness of low-income EE participants in St. Louis, MO, we found that, compared to both the traditional EE intervention group and the control group, youth in the Photovoice intervention had improved learning outcomes. Thus, Photovoice research methods may be effective tools for promoting enhanced learning outcomes. Further studies are warranted to investigate the potential benefits of Photovoice in environmental education.
Footnotes
Appendix
Acknowledgment
We thank the following individuals and organizations who were instrumental in making this project a success: Xavier Bravo, Sarah Burack, the SLPS student participants, the SLPS teachers and administration, and Gateway to the Great Outdoors.
Declaration of Conflicting Interests
The author(s) declared no potential conflicts of interest with respect to the research, authorship, and/or publication of this article.
Funding
The author(s) disclosed receipt of the following financial support for the research, authorship, and/or publication of this article: This work was supported, in part, by NIEHS T32 ES007322 and a Junior Faculty Research Award from the Brown School at Washington University in St. Louis.