
Abstract
Happiness at Work is considered the Holy Grail of organizational sciences. The belief that happier workers are more productive leads to a win-win situation for both individuals and organizations. Nevertheless, years of research have not brought a convergent conclusion about the topic, mainly due to the lack of a widely accepted measure. Usually, questionnaires and self-report surveys are used; however, these methods embed shortcomings that allow studies’ results to be questioned. In order to overcome these shortcomings, the present study proposes a different approach to measure Happiness at Work, bringing mixed methods to encompass the complexity of the phenomenon. Based on work-life narratives and following Kahneman’s concepts, the proposed approach puts together Narrative Analysis and Sentiment Analysis. Although increasingly used to assess social media reviews, Sentiment Analysis is not yet applied to narratives related to Happiness at Work. Four methods to calculate the Happy Level indicator were tested on actual research data: one manual, through traditional coding processes, and three automatic methods to provide scalability. An example of the Happy Level application is also provided to illustrate how the indicator could improve analyses. The present study concludes that despite the manual method presents better results at this moment; the automatic ones are promising. The results also indicate paths for improvement of these methods.
Introduction
Happiness is not a new topic. In ancient Greece, Aristotle stated that happiness is every human’s goal, and it was a matter of living a good, virtuous life. However, until the 18th century, Western culture encouraged a sad approach to life, with people feeling guilty for being for their moments of happiness. The Age of Enlightenment brought the emergence of modern Western happiness (Stearns, 2012), including a mention that all men have the inalienable right to seek their happiness in the United States Declaration of Independence (1776).
In the same year, 1776, Adam Smith’s ideas that it was in human nature to only work for money began to influence the whole way of thinking about labor relations in the following centuries, helping to shape Taylor’s scientific management movement (Schwartz, 1990). However, in the early 20th century, Hawthorne Studies became the most important investigation of the human dimension in industrial relations, recognizing the importance of considering an individual’s emotional life, cultural values, and personal aspirations when managing teams at work (Brannigan & Zwerman, 2001).
Since then, research on Happiness at Work has been flourishing. Different constructs and many scientific management studies have been developed based on the belief that happier workers are more productive, which leads to a win-win situation since being happy would be positive for both individuals and organizations.
More recently, in the late 1990s and early 2000s, the study of happiness has flourished alongside the emergence of Positive Psychology. This psychological research field focuses on positive experiences, positive individual traits, and positive institutions to enhance happiness (Seligman, 2002). The topic was also discussed by scholars of the 21st century, such as Kahneman (1999) and Harari (2015).
Although many fields and disciplines have studied happiness (e.g., Philosophy, Psychology, Sociology, Biology, Economics), the centrality of work in individuals’ lives (Dejours & Deranty, 2010) puts Happiness at Work in the spotlight of the Organizational research field. The so-called happy-productive worker thesis (Ledford, 1999; Sender et al., 2020; Staw, 1986; Wright & Staw, 1999a, 1999b) is considered the Holy Grail of organizational sciences (Weiss & Cropanzano, 1996).
The relevance of the topic is related to how happiness impacts employees and organizations. First, there are individual effects directly related to one’s personal life, such as income (Diener et al., 2002), higher life expectancy and health (Salas-Vallina et al., 2017), increased career self-awareness, no burnout, and feeling of solidarity (Ozkara San, 2015). The second is workplace behaviors (i.e., how people behave at work), such as better teamwork (Peñalver et al., 2017), reduced turnover, increased task and contextual performance (Thompson & Bruk-Lee, 2020). Each individual’s workplace behaviors help organizations improve their results, leading to the third group of impacts, the organizational outcomes. For example, Gallup’s meta-analysis showed nine outcomes: customer loyalty/engagement, profitability, productivity, turnover, safety incidents, shrinkage, absenteeism, patient safety incidents, and quality (defects) (Gallup, 2013).
On the other hand, unhappiness can lead to the absence of the positive consequences listed in workplace behaviors and organizational outcomes (e.g., low productivity and low work quality). Moreover, unhappiness can also bring individual effects such as mental unease or disorder (i.e., consequences that threaten mental health) and work withdrawal (i.e., behaviors as employees’ attempts to remove themselves from work; Graziotin et al., 2018).
Nevertheless, although happiness is important for both individuals and organizations, almost one hundred years of research has not been enough to reach a definitive and convergent conclusion about what makes people happy at work and which consequences it may bring for organizations. According to Danna & Griffin, 1999, “there exists a vast but surprisingly disjointed and unfocused body of literature across diverse fields that relate directly or indirectly to (…) well-being in the workplace” (Danna & Griffin, 1999). One of the core issues related to the topic is its measurement. The fact that there is not a widely accepted measure by academics and managers makes it difficult for scientific studies to test causal relationships, both in terms of their antecedents and their effects on organizations’ results (Fisher, 2003).
According to Ledford (1999), “the most important problem to address in research on the happiness (…) is operationalization” (Ledford, 1999). Since measurement allows researchers to observe and describe the phenomenon, in order to understand, predict and change it (Aguinis et al., 2002; Scherbaum & Meade, 2013), measuring how an individual feels about work is crucial to advance the understanding of this topic (Dolan, 2015).
Measurement of Happiness at Work is usually operationalized through questionnaires and self-report surveys. These instruments encompass shortcomings, relying on participants’ cognition and memory to complete it (Dasborough et al., 2008) and leading to variations due to questions’ subjectivity and complexity (Hipp et al., 2020). Additionally, design flaws may jeopardize research findings (Cullen, 2017). Simultaneously, since they have to include only some of the many aspects of the phenomenon due to space and filling time limitations, they can be considered incomplete. Besides, since each questionnaire selects different elements, they are hard to compare. Therefore, studies’ results are subject to question.
In order to overcome these shortcomings, the present study proposes a different approach to measure Happiness at Work, going beyond traditional self-report questionnaires and bringing other methods to encompass the complexity of the phenomenon. Following Kahneman’s (2011) concepts of identifying pleasant and unpleasant episodes through positive and negative adjectives, the present approach puts together Narrative Analysis and Sentiment Analysis, proposing an indicator named The Happy Level, based on individuals’ work-life narratives content transcribed to text.
Textual analysis techniques based on Natural Language Processing (NLP) have recently been used in Organizational Studies for measurement through narratives (Speer, 2020). However, to the best of the authors’ knowledge, there is no prior work that considers Sentiment Analysis as a technique to explore narratives related to Happiness at Work, as proposed in the present study. When performing a query in Scopus Database using the expressions “happiness at work” and “sentiment analysis,” no documents were retrieved (07/21/2020).
Four alternative methods were presented to calculate the Happy Level indicator. The first one is based on manual, traditional coding processes. The other three are automatic methods based on Sentiment Analysis to provide scalability to the method application. The alternatives were tested on actual research data and compared to a baseline in order to identify the method that offers better accuracy and propose possible paths for the method evolution. This study also presents examples of the Happy Level’s application.
In the next section of this paper, Theoretical Background, we discuss how Happiness at Work has been measured according to the existing literature and its shortcomings. We also bring the main aspects of Sentiment Analysis related to the methods proposed in this study. Then, in the Methodology section, we describe the proposed methods to calculate the Happy Level and how they will be applied to the research used as an example. The Results section shows the Happy Level calculation through the four methods and the comparative analysis, discussing these results. We also present the application of the chosen method on the research example. Finally, the Conclusion section points out the study’s contributions and implications, proposing future studies to improve the method based on this paper’s findings.
Theoretical Background
Happiness at Work
Defining happiness is not easy. With the emergence of Positive Psychology in the late 1990s and early 2000s, happiness has been following a positive psychological state notion, being defined as an “optimal psychological experience and functioning” (Deci & Ryan, 2008), usually distinguishing two state levels. Aristotle defined the concepts of Hedonics, where happiness is a result of an individual’s degree of experience of pleasure versus pain; and Eudaimonia, which is generally defined as living a complete and virtuous life, using human potential (Deci & Ryan, 2008; Ryan et al., 2008; Tomer, 2011).
Seligman (2002) introduced some similar concepts. Momentary Happiness is related to pleasures like eating chocolate or receiving a compliment (Pleasant Life). In contrast, Enduring Happiness (Good Life) consists of a state of flow (full absorption, total immersion, and absence of consciousness) and is produced by gratifications. Although researchers proposed these two visions of happiness, laypeople usually associate happiness with the more immediate concept, related to pleasures achieved by frequent new accomplishments as “shortcuts to feeling good” (Seligman, 2002).
Focusing on the workplace, almost 250 years ago, Adam Smith suggested that people work only for pay and would be more productive if the work was divided into small and specialized tasks (Smith, 1776). These ideas influenced how work was organized throughout the following years, as in Taylor’s Scientific Management movement (Taylor, 1911).
In the 1920s, the Hawthorne studies were turned into the “most important investigation of the human dimensions of industrial relations in the early 20th century” (Brannigan & Zwerman, 2001). Researchers recognized the importance of considering not only physical conditions but also emotional and cultural aspects and personal aspirations (Brannigan & Zwerman, 2001). Since then, academics and practitioners have shown a growing interest in understanding the influence of emotional factors on productivity (Bagtasos, 2011; Ledford, 1999; Spicer & Cederström, 2015). As a result, several constructs were developed to give rise to different forms of measuring how individuals feel about their work.
In 2010, Fisher proposed an umbrella concept that included constructs belonging to the “family of happiness-related constructs” (Fisher, 2010), including job satisfaction, organizational commitment, job involvement, employee engagement, and work motivation, and subjective well-being.
More recently, the Happiness at Work concept has evolved into a construct on its own (Lutterbie & Pryce-Jones, 2013; Singh & Aggarwal, 2018; Salas-Vallina et al., 2017; Salas-Vallina et al., 2018), similar to the subjective well-being construct. Therefore, happiness and well-being are often treated as synonymous or interchangeable terms (Demo & Paschoal, 2016; Lyubomirsky, 2007; Nunes et al., 2009; Seligman, 2002; Wright & Huang, 2012).
Happiness at Work can be defined as a positive psychological state (Deci & Ryan, 2008; Macey & Schneider, 2008). This state is perceived by the individual (perceptions), and its presence is influenced by some factors (antecedents). This positive state also impacts individual behavior in the workplace (consequences) (Macey & Schneider, 2008; Meyer & Allen, 1991) once it serves as an incentive for him/her to perform well (Hackman & Oldham, 1976).
Regarding the antecedents, many studies have attempted to identify what influences Happiness at Work. Although individual differences have been recognized since the formal beginning of the studies, most debates have focused on situational theories, giving greater importance to external influences than to personal factors. Personal factors started to gain more attention in the mid-1980s (Ilies & Judge, 2003; Staw & Ross, 1985). Therefore, Happiness at Work is influenced by three nature of elements: individual factors, job characteristics, and organizational conditions. Theories developed and applied to explain Happiness at Work can be related to each one of these groups. Some examples are shown in Table 1.
Examples of Theories/Models Applied to Happiness at Work.

Note. Adapted from Sender and Fleck (2017b).
Theories originated in Psychology, such as the Hierarchy of Needs (Maslow, 1943), the Motivation-Hygiene theory, also known as the two-factor theory and dual-factor theory (Herzberg et al., 1959), and Positive Psychology (Seligman, 2002) were adapted to the work environment. The study of Psychodynamics of Work (Dejours, 2004; Dejours et al., 1993) also made relevant contributions to understanding happiness at work.
The recent studies of Economics of Happiness offer an evolution of the original concepts of the utility of work, going beyond financial retribution (Sender & Fleck, 2017b).
Individuals perceive how much the organization values their contribution and cares about their happiness through favorable treatment received, which is called Perceived Organizational Support (POS). It includes dimensions such as benefits and health, comfort, working conditions, and well-being, development/career, incentives, compensation/performance management, and relationship/communication/participation (Eisenberger et al., 1986; Oliveira-Castro et al., 1999).
Another very well-known concept is Quality of Work-Life (QWL). Individuals should play an active role in decisions about their working conditions, humanizing the workplace, but still focusing on productivity (Bagtasos, 2011; Singh & Srivastav, 2012). It includes dimensions such as compensation, working conditions, human capacities, continued growth and security, social integration, constitutionalism, and social relevance of work-life (Walton, 1973).
Job Characteristics Theory proposes that five job characteristics (autonomy, job identity, job significance, skill range, and feedback) lead to a series of personal and organizational results (Oldham & Hackman, 1981).
The Job Demand-Control Model (Karasek, 1991), another well-known theory, looks at the impact of job characteristics on employee well-being, combining two aspects: the work demands (the cost to perform the task) and the resources that the individual has to control these demands. The relationship between these two aspects determines the resulting tension and any psychological and psychosomatic reactions.
Traditionally, happiness at work has been operationalized by instruments that select some elements among all the ones included in the theories’ dimensions. As will be described in the next section, this approach brings some downsides.
Happiness at Work Measurement
The measurement of Happiness at work is crucial for advancing scientific knowledge, but as in Management Sciences, it has received less attention than it deserves. According to Scherbaum and Meade (2013), there is excessive use of a limited set of methods, and the survey is one of the most used methods. For several decades, surveys in organizations have been the most common way for management to ask for feedback and for companies to assess how employees were feeling about work. Conducting regular employee opinion surveys has been viewed as evidence of high-performance Human Resources practices (Judd et al., 2018).
Nevertheless, self-report instruments as questionnaires have shortcomings, such as relying on participants’ cognition and memory to complete it (Dasborough et al., 2008). They are also susceptible to design flaws that may jeopardize research findings by providing “an inaccurate roadmap of where the problems lie” (Cullen, 2017).
Following Fisher (2010), Sousa and Porto (2015), and Sender and Fleck (2017b), this study considers Happiness at Work as an umbrella concept that includes other happiness-related constructs (e.g., Job Satisfaction, Organizational Commitment, Employee Engagement). As stated previously, Happiness at Work can be defined as a positive psychological state (Deci & Ryan, 2008; Macey & Schneider, 2008), influenced by antecedents and leading to consequences (Macey & Schneider, 2008; Meyer & Allen, 1991). It is common to define constructs in psychological and managerial research drawing on antecedents and consequences (Hughes et al., 2018).
Consequently, another problem regarding the use of questionnaires to operationalize happiness-related constructs is a lack of a widely accepted questionnaire regarding the use of antecedents and consequences. Several instruments were developed, as the examples presented in Table 2. These questionnaires selection was based on Fisher’s (2010) literature review paper, on which many studies of this topic have drawn (e.g., Edmans, 2012; Gabini, 2018; Salas-Vallina & Alegre, 2018; Salas-Vallina et al., 2017; Sender & Fleck, 2017b; S. Singh & Aggarwal, 2018; Sousa & Porto, 2015). Although this literature review is frequently used as a reference to the topic, in the 2010s, as mentioned previously, the Happiness at Work construct has evolved, bringing new measurement instruments. Therefore, Table 2 also presents examples of happiness at work questionnaires identified from Singh and Aggarwal’s (2018) paper. Since these questionnaires are more recent, their number of citations is lower.
Question Types in Representative Questionnaires, by Citations.
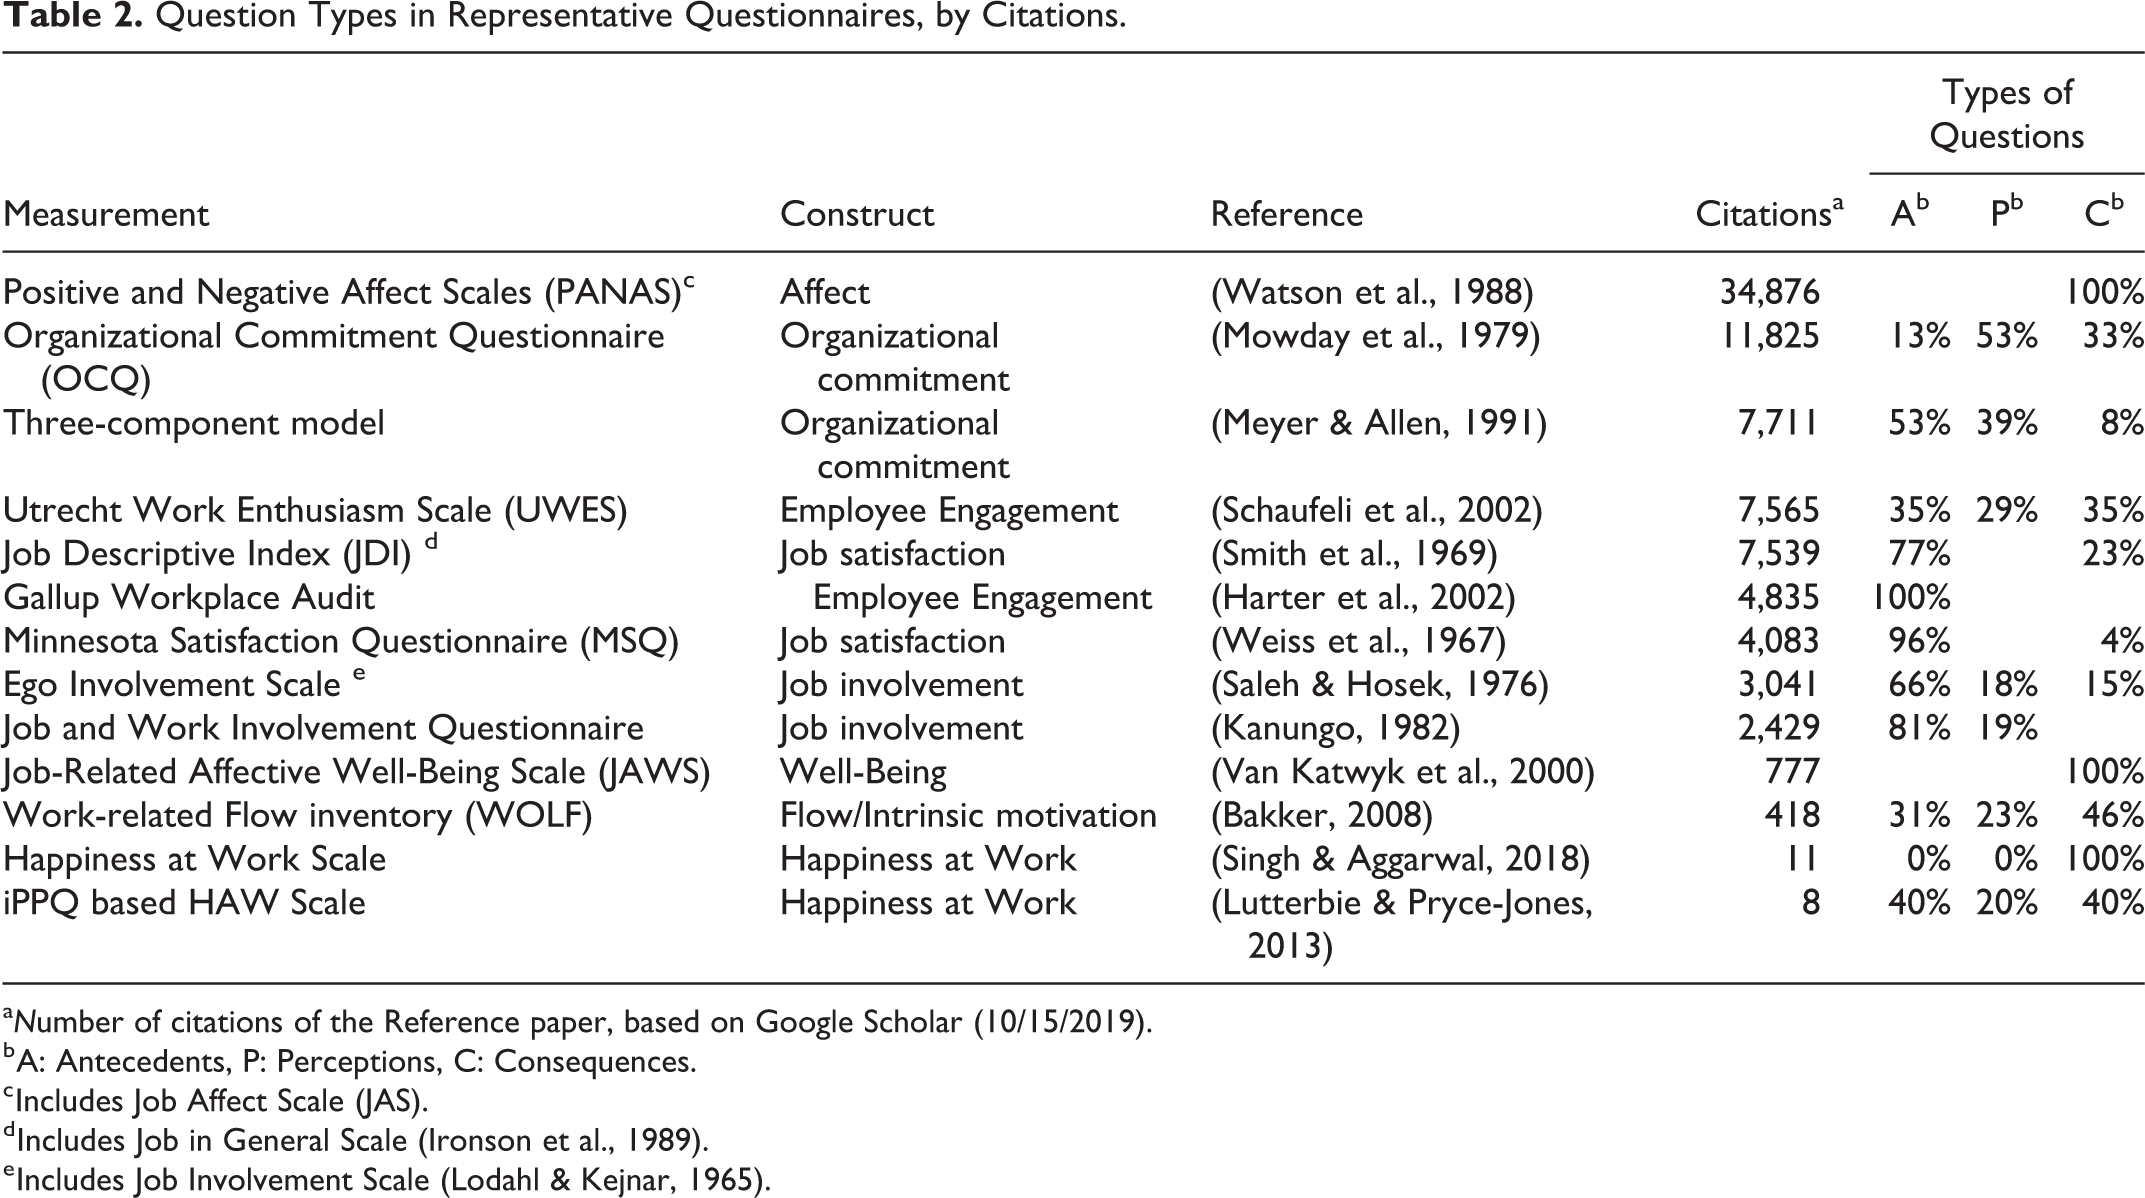
a Number of citations of the Reference paper, based on Google Scholar (10/15/2019).
b A: Antecedents, P: Perceptions, C: Consequences.
c Includes Job Affect Scale (JAS).
d Includes Job in General Scale (Ironson et al., 1989).
e Includes Job Involvement Scale (Lodahl & Kejnar, 1965).
These examples illustrate how different questionnaires can be since they use different types of questions. Following Ozkara San’s (2015) structure of the happiness concept, it is possible to group questions in antecedents’ attributes (i.e., personal factors, work characteristics, and work environment) and consequences, as also shown in Table 1. Some questions are also related to how people perceive their work.
Three relevant issues regarding the use of current measures lead us to propose a new approach for Happiness at Work measurement. First, as shown in Table 2, even questionnaires that operationalize the same construct can have quite different structures. For example, Employee Engagement’s UWES (Utrecht Work Enthusiasm Scale) has a balanced mix among questions considering Antecedents, Perceptions, and Consequences types of questions, while Gallup Workplace Audit relies only on Antecedents questions.
Second, according to Hughes et al. (2018), understanding the construct through its antecedents and consequences has limitations, such as the failure to describe the nature of the phenomenon fostering “poor measure development” (Hughes et al., 2018) and the difficulty in differentiating the phenomenon from its effects.
Finally, since questionnaires have limited space or time devoted to filling them, not all aspects of a complex phenomenon such as Happiness at Work would be considered. For example, a content analysis of the questionnaires used as an example in Table 2 led to a list of 125 different elements used as a basis for the questions. It would be hard to develop and apply a questionnaire that covers all these elements. Therefore, creating a questionnaire implies choosing what type of questions (i.e., antecedents, perceptions, or consequences) should be considered, and even questions of the same kind could cover different aspects. For example, regarding Antecedents, there could be questions related to Autonomy, Supervisor, Co-workers, Compensation, among many others (Sender & Fleck, 2017a). Choosing some aspects and elements means leaving others behind. Thus, questionnaires could be considered incomplete and hard to compare, making studies’ results susceptible to questioning.
Therefore, different approaches should be sought to improve the way it is measured, allowing research studies to go beyond the self-administered questionnaire, expanding the research methods’ scope using alternative forms of measurement.
Applying Sentiment Analysis on narratives, as we propose here, allows all aspects of happiness at work to be considered—there is no need to select them previously. There is no limit of elements to be covered nor possible biases of how questions are structured. The research objects (i.e., individuals) are free to mention whatever element they consider relevant to their happiness at work, even ones that were not in a previous study or list, bringing measurement closer to an individual view of happiness at work.
Sentiment Analysis
Sentiment Analysis is a research field of Natural Language Processing (NLP) (Liu, 2020). NLP is a computerized approach focused on analyzing text based on both a set of theories and a set of technologies (Liddy, 2001). It has several applications, including Question-Answering, Summarization, Machine Translation, and Sentiment Analysis (Liddy, 2001).
Sentiment analysis refers to the computational treatment of sentiment in the text (Pang & Lee, 2006), and for this reason, it is used in this study to evaluate happiness at work. Sentiment analysis aims to analyze feelings, emotions, and opinions within unstructured data based on a polarized classification of the sentiment present in a document or a sentence, classifying the text or excerpt as positive, negative, or neutral (Pang & Lee, 2006). Usually, it is used to analyze texts such as customer reviews in social media, that are “large in breadth (…) and qualitatively complex in depth (e.g., unstructured text, linguistically and culturally nuanced)” (Colditz et al., 2019; Kouloumpis et al., 2011; Passonneau, 2011; Souza & Vieira, 2012).
Sentiment analysis has also been used in narratives in health services contexts, such as patient narratives (Stuart et al., 2018) and clinical narratives (Denecke & Deng, 2015). Although not specifically using Sentiment Analysis, other textual analysis techniques using NLP capabilities have also been applied to Organizational Studies, as the measurement of Organizational Culture (Pandey & Pandey, 2019) and Job Performance (Speer, 2020).
There are two main approaches concerned with extracting sentiment from text automatically. The first one is the lexicon-based approach, which calculates the orientation for a text based on the semantic orientation of words in the document (Madhoushi et al., 2015; Turney, 2002). This approach is defined as an unsupervised sentiment classification method; there is no need for a training phase (Abdulla et al., 2014; Liu, 2020). It performs the sentiment classification based on a dictionary of sentiment words with their associated sentiment orientations, called sentiment lexicons (Liu, 2020). Each positive word has a positive orientation value, and each negative word has a negative orientation value (Liu, 2020).
The second approach is a supervised sentiment classification method. It refers to the standard text classification approach (also described as a statistical or machine-learning approach), which builds classifiers from labeled instances of texts (Iqbal et al., 2019; Pang et al., 2002). It is worth mentioning that the availability of reliable training data constrains this approach since it depends on a training phase to train machine learning algorithms (Iqbal et al., 2019). The training phase requires a considerable training corpus, manually labeled by human specialists, which can be a high-cost, expensive, and time-consuming task (Abdulla et al., 2014; He & Zhou, 2011).
In this scenario, this study follows the unsupervised sentiment classification method. It considers lexicons/dictionaries where words are classified according to a preliminary polarity—whether the word evokes something positive or negative (e.g., beautiful and horrible have positive and negative polarity, respectively).
There are many Brazilian Portuguese lexicons where words are labeled accordingly with their polarity. The present study focuses on three lexicons that are widely used: NVivo (https://www.qsrinternational.com/nvivo), Linguistic Inquiry and Word Count (LIWC) (http://liwc.wpengine.com/), and Polyglot (https://pypi.org/project/polyglot/). NVivo is a software broadly used to support qualitative research. In its Plus version, NVivo embeds a feature of Sentiment Analysis, making it easier to use since it is on the same platform. As NVivo, LIWC is also a commercial application—both provide a visual interface that allows users to inspect information more easily.
On the other hand, Polyglot is an open-source and programmatically accessible library; therefore, some programming language knowledge is required. In the case of LIWC, the dictionaries can also be accessed programmatically. The choice of these three dictionaries is based on the broad linguistic support that they have. For a full list of Brazilian Portuguese dictionaries with polarity words, please refer to (Cruz et al., 2017).
NVivo is a qualitative data analysis (QDA) software program, one of the most used software in the Brazilian academic environment, adopted by research centers in most major universities (Lage, 2011). NVivo was developed to collect, organize and analyze the content from unstructured information, such as text documents with interviews, questionnaires, journals, transcription from audios, among others (Edhlund & McDougall, 2016). The Sentiment Analysis feature analyzes texts and provides a classification of the terms found in four categories: very negative, moderately negative, moderately positive, and very positive, like the examples shown in Table 3.
NVivo’s Sentiment Analysis Outputs (Examples).

LIWC is a text analysis program that counts words in several categories: positive, negative, money, time, and many others (Pennebaker et al., 2001). LIWC 2015 is the most recent version of this program, and it provides two internal dictionaries: English and German (Pennebaker et al., 2015). Several third-party dictionaries have been developed in the last years, providing support for other languages, for example, Spanish (Ramírez-Esparza et al., 2007), Dutch (Boot, Zijlstra, & Geenen, 2017) and Brazilian Portuguese (Carvalho et al., 2019). The Brazilian Portuguese version contains 14,459 words labeled in 73 categories. Some recent studies have presented promising results using this dictionary (Carvalho et al., 2019; Nascimento et al., 2019).
LIWC program counts words present in text considering the language dictionary configuration. Thus, LIWC shows, for each text, a list of categories and word counts by categories, as depicted in Table 4. As one can note, a document file (experience1.txt) contains ten positive and three negative words. Moreover, four words were related to the money category, and one refers to time orientations.
Word Counts for LIWC Categories (Examples).

Polyglot is a python package with features such as tokenization, language detection, and Sentiment Analysis. It offers support for more than 100 languages, including Brazilian Portuguese. We also adopted Polyglot since it has been used as a sentiment lexicon baseline. Like LIWC, Polyglot can count words into categories; however, it can only consider polarity values of texts (i.e., positive, negative). The Brazilian Portuguese dictionary contains 3953 words assigned to the positive/negative categories.
Most of the Sentiment Analysis studies have been applied to English texts (Ignatow & Mihalcea, 2016; Madhoushi et al., 2015; Ozyurt & Akcayol, 2020; Sagnika et al., 2020; Tripathi & Trivedi, 2016). Although there are already some studies about Brazilian Portuguese language lexicons, they are still more restricted than in English (Avanço & Nunes, 2014). Thus, there is considerable space for research on Brazilian Portuguese dictionaries.
Method
The Happy Level (HL)
This study proposes an alternative form of measuring Happiness at Work, aiming to overcome the shortcomings identified and described previously about the current instruments, mainly regarding current methods comprehensiveness. The Happy Level (HL) represents a person’s Happiness at Work level, based on a narrative described by them. It is conceptually based on Kahneman’s (2011) view of identifying whether an episode was positive or negative. (…) it is possible to classify most moments of life as ultimately positive or negative. We could identify unpleasant episodes by comparing the ratings of positive and negative adjectives. We called an episode unpleasant if a negative feeling was assigned a higher rating than all the positive feelings. (Kahneman, 2011)

where HL is the Happy Level for a specific Work Experience, T+ is the number of positive terms, and T− is the number of negative terms.
The selection of a narrative as the data collection method allows the inclusion of all aspects that people themselves consider relevant, not imposing the researcher’s decision on what to ask them. When people tell a story, it is “about significant events and memorable moments” (Kahneman, 2011), representing their own version of the story, not necessarily how it truly happened. Duration neglect and Peak-end rule (Kahneman, 2011) influence what and how it is remembered. The Peak-end rule states that the remembering rate is a function of the average between the pain level at the worst moment and the end of the experience. Duration neglect says that the duration of a situation does not influence the assessment of total pain. Nevertheless, these narrative characteristics meet the method’s purpose, which is to measure Happiness at Work from an individual’s point of view.
These periods or situations that should have their Happy Level measured were called Work Experiences. The decision of structuring the analysis on Work Experiences was based on the concepts of occurrences and events. Occurrences (or incidents) are operational empirical observations (a directly observable group of first-order activities), while events are abstract groupings of incidents (a more abstract second-order construction) (Van de Ven, 2007; Abbot, 1984).
The Work Experience is defined for this study as an occurrence that, at a specific moment in time, encompasses a situation pointed out by the individuals with a stable context, in terms of the company where they work, the job they performed, the team they belong to and/or their personal circumstances. A new Work Experience arises when the individuals themselves consider a change in one or more of these conditions that impact their situation in terms of the proposed topic (e.g., a job rotation, a new direct supervisor, a change of physical workplace).
This study proposes and compares four different methods to calculate the Work Experience’s HL. The methods were applied to real data, generating an HL and a result (i.e., positive or negative) for each Work Experience. These results were then compared to an Overall assessment of the Work Experience, which was considered the baseline. In the Overall assessment, each Work Experience’s narrative was coded as positive or negative (refer to Appendix for terms found in coding) by three different coders, independently. The results obtained separately were then compared, and a Work Experience was considered either positive or negative when at least two of the three coders classified it in this way.
In order to calculate HL based on the methods proposed below, the narratives collected during the interviews were transcribed to documents and split into Work Experiences, which became the unit of analysis.
To address these two issues, we propose three alternative methods based on automated sentiment analysis.
Once the HL is calculated, it is possible to identify if a Work Experience was positive or negative. If HL is lower than zero, the Work Experience result is considered negative; otherwise, the Work Experience is considered positive. This assumption implies that Work Experiences with HL equal to zero are considered positive (or not negative). The conversion from HL to a binary Work Experience result (i.e., positive or negative) allows comparing the methods to the baseline and among them since their HL could have different magnitudes.
Although the proposed method uses Work Experience as the unit of analysis, is it possible to measure the HL for a person, encompassing more than one Work Experience, even his/her whole work-life. The Global HL is calculated through the average of all Work Experiences’ HL, weighted by each Work Experience duration.
Application of Happy Level
To assess the alternative methods and the benefits of using this measure in analyses, they were applied to one research that aimed to understand what makes individuals more or less happy at work. It was focused on middle managers due to their intermediate position in the companies’ hierarchical structures, including high pressure from their teams and high management. Middle managers are considered “the unhappiest employees at US organizations” (Wilkie, 2018).
The research was developed using exploratory sequential mixed methods, comprised of an initial qualitative phase, in which the participants’ views are explored. The information derived from the data collection analysis is used in a second quantitative phase (Creswell, 2014).
In the first phase, narratives of work-life history were collected by in-depth and semi-structured interviews (Mann, 1979; Selltiz et al., 1974; Vieira & Tibola, 2005) that were recorded. The interviewees’ selection process sought to ensure a diversity of situations that would allow comparisons between similar or antagonistic cases (Van de Ven, 2007; Yin, 2009), providing variety in several aspects (i.e., different organizations, jobs, demographics, and life cycle stage).
A protocol was adopted to conduct and record the interviews. This protocol was tested in two pilot interviews and adapted for the other ones. Then, it was strictly followed and worked effectively. The interviews were conducted preferably at the interviewee’s workplace in order to obtain additional information about the work environment. When it was not possible, the interview was conducted at the interviewee’s residence, office, or a public location such as a restaurant. The latter was the last option due to noise or possible interviewee inhibition, but it worked well when needed.
The interview cycle was closed when it was observed that the Work Experiences were bringing similar contents and insights, indicating saturation. There were collected 167 Work Experiences in 53 companies from 16 individuals. The audio files from more than 30 hr of interviews were transcribed into Microsoft Word documents, leading to almost 600 pages. The transcription was performed manually by three transcribers and thoroughly reviewed by the interviewer to ensure content accuracy. These transcriptions were uploaded into the NVivo software and then submitted to an in-vivo coding process, in which codes are derived from what the interviewee says rather than a predefined tree (Saldaña, 2013). This approach was chosen due to the exploratory nature of the study. The coding process was performed in cycles, following The Coding Manual for Qualitative Researchers (Saldaña, 2013).
Later, the data was exported to an Excel database to calculate HL using the methods. Once the methods were compared and the best suitable one was selected, some analyses using the HL were performed and presented to illustrate how the use of the HL could help in one specific research.
In order to ensure the research’s validity and reliability, some strategies among those proposed by Creswell (2014), Yin (2009), and Creswell and Miller (2000) were adopted, as presented in Table 5.
Research Validity and Reliability Strategy.

Note. Based on Creswell and Miller (2000).
Results
Happy Level Calculation
The methods proposed were applied to the data collected in the research described in the previous section. The data gathered from the interviews were imported, treated in NVivo, and exported to a Microsoft Excel database, where Methods 1 and 2 were calculated. Work Experiences excerpts were also exported in plain text files to be submitted to LIWC and Polyglot (i.e., Methods 3 and 4). The results of LIWC and Polyglot were then incorporated into the Microsoft Excel database to perform comparative analyses among the four methods.
HL absolute values were expected to vary from one method to another. However, this difference in magnitude is not a problem for two reasons. First, the calculated HL’s will indicate if a Work Experience is considered positive (HL ≥ 0) or negative (HL < 0). Therefore, this result (i.e., positive or negative) is comparable among the methods and the Overall Assessment. Second, once the method is selected, only this one will be used in specific research analysis to compare Work Experiences.
Each method’s adherence to Overall Assessment is indicated by the percentage of Work Experiences that reached the same result (i.e., positive or negative), which is called % Match and is shown in Table 6.
Work Experiences’ Results Summary.
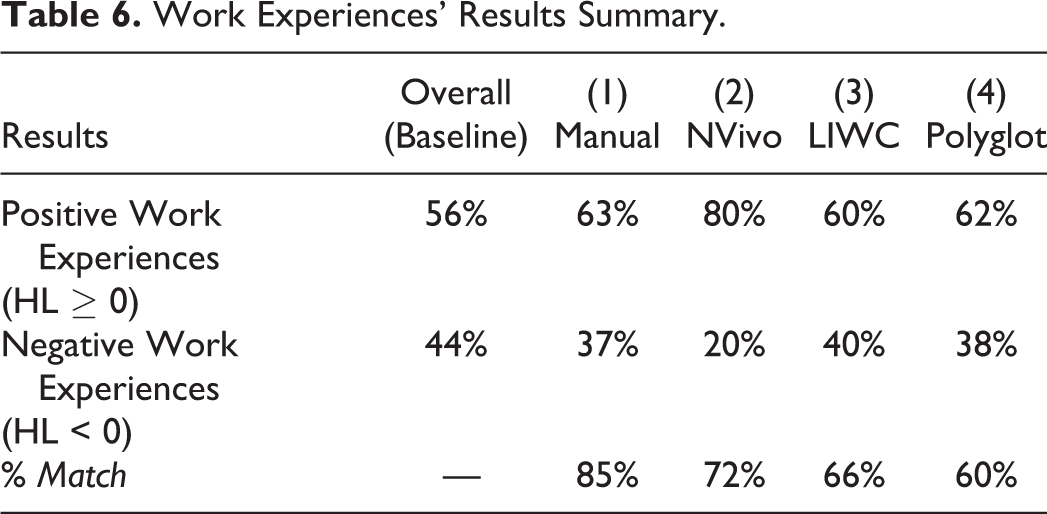
The results show that Method 1 presents the highest adherence to the baseline, with 85% of results matching the Overall assessment. Regarding only automatic methods, Method 2 (NVivo Plus software) is the best one, presenting 72% of results matching the Overall assessment. Method 3 (LIWC software) and Method 4 show 66% and 60% of results matching the Overall Assessment, respectively. It is important to note that Method 2 (NVivo) predicted 80% of the experiences as Positive Work Experiences, a much higher level than the other ones.
Figure 1 presents a more detailed view of each method’s results. The confusion matrix is an important tool to evaluate how well the classification task performed (Han et al., 2011). Each matrix shows the number of positive experiences predicted as positive (true positive—TP), positive predicted as negative (false negative—FN), negative predicted as negative (true negative—TN), and negative predicted as positive (false positive—FP) (Han et al., 2011).
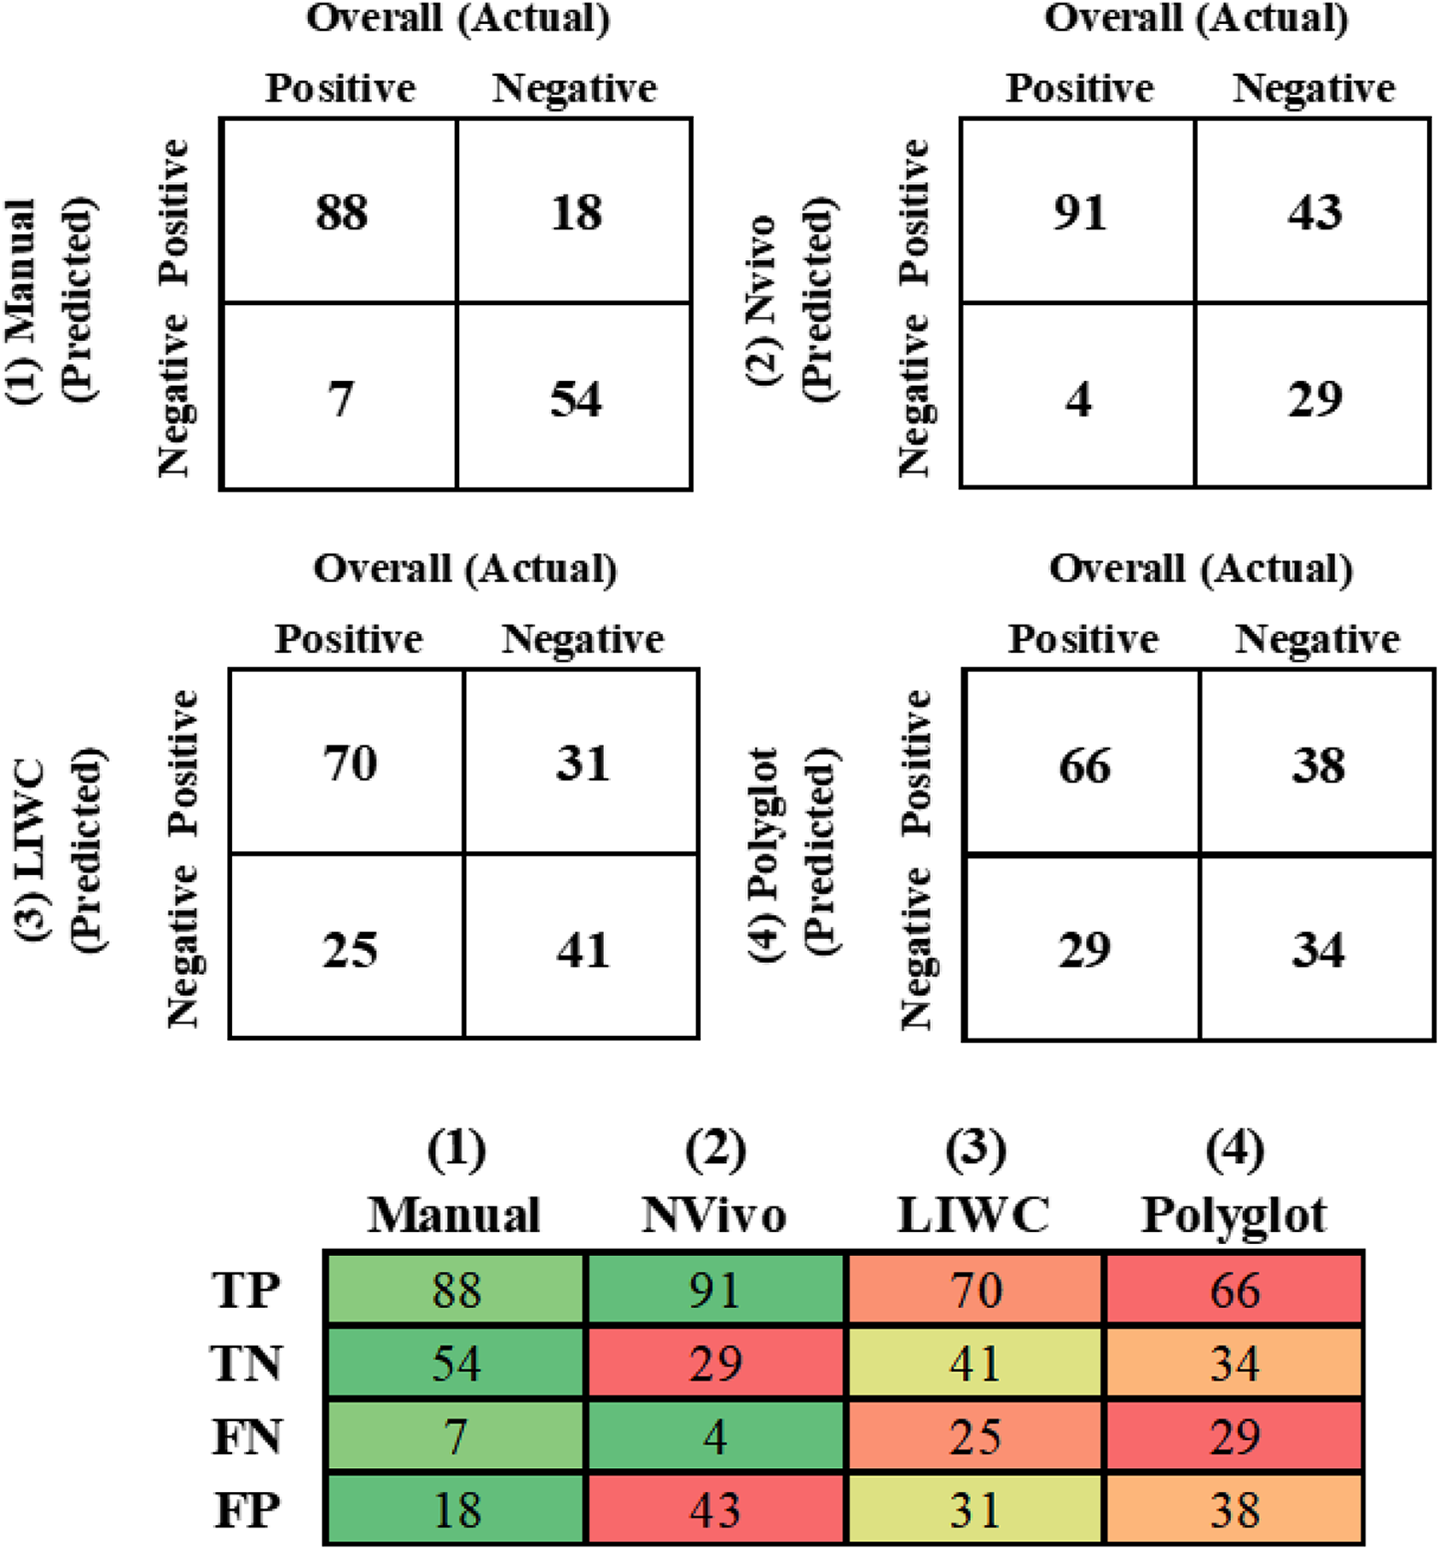
Number of TP, TN, FP, FN predictions by method.
Method 1 performed better when considering only the negative experiences (TN = 54), while Method 2 outperforms the other methods when predicting the positive experiences (TP = 91). Although Method 2 provides the best adherence when considering the automatic methods (i.e., Methods 2, 3, and 4), Method 3 presents the best negative experiences assessment (TN = 41).
The results can also be analyzed considering the match between the four methods, that is, comparing the HL provided by each method for each Work experience, as presented in Figure 2. The two best automatic methods (i.e., NVivo and LIWC) show a 72% match, which means that both methods calculate the same HL for 120 out of 167 Work experiences.

Methods percentage match.
Method 4, on the other hand, presents low Match values for all methods. As one can note, the best correspondence for this method occurs with Method 3 (i.e., 61%), meaning that both methods calculate the same HL for 102 out of 167 Work experiences.
Discussion
Based on the results of the analyses presented in the previous section, it is possible to affirm that Method 1 is the best method to calculate the Happy Level for this set of data and at the present moment of technology evolution. On the other end, Polyglot (Method 4) is the method that provided the lower adherence to the baseline, unfortunately, since it is the only automated method that is free.
Nevertheless, it is important to note that the three different automated methods have differences in the quality of results, depending on the situation. Although NVivo (i.e., Method 2) has the best total result (i.e., 70%), its performance is good only when related to positive work experiences, being slightly better even than the manual process (i.e., Method 1). On the other hand, it has poor results in negative work experiences, with the lowest adherence of all four methods. This analysis shows that when considered together, the automated methods can overcome the manual process if they learn from and incorporate the best aspects of each one. In fact, when considering the best automated results in positive experiences (i.e., 91 in NVivo/Method 2) and negative experiences (i.e., 41 in LIWC/Method 3), the adherence of automated methods would rise to 79% (i.e., 91 plus 41 work experiences, out of 167), closer to the 85% of the manual method.
There are two natures of opportunities to improve automated methods. The first one is related to the current state of techniques. Unlike the manual coding process, automated methods do not classify content according to sentiment. Through these methods, words are assessed one by one, not taking the context into account. It means that the text analysis tools cannot recognize aspects such as ambiguity, double negatives, slang, sarcasm, and dialect variations. Take the expression in Portuguese “eu não me sentia mais dentro de casa” (in English, “I wasn’t feeling at home anymore”) as an example. Since it is mentioned in the context of Happiness at Work research, it means that the worker stopped feeling a sense of belonging to the company or the team, which is a negative expression. However, since automated methods cannot understand the context, it is considered neutral. In contrast, in manual methods, the person who performs the coding is able to consider other aspects, including non-textual dimensions (i.e., multimodality).
The second nature of opportunity is related to the libraries used. The libraries used in the three automated methods were not specifically developed for the topic being study (i.e., happiness, organizational behavior, work environment). At the same time, there is a lack in the development and testing of Brazilian Portuguese libraries, in contrast with English libraries, which are used worldwide with much more frequency.
Although the manual method (i.e., Method 1) presents better results than the baseline, it could embed some bias and lead to classification errors, especially with a large volume of data such as the sample used here. Moreover, it is not a scalable method, making it challenging to apply in an even more substantial amount of data, especially in quantitative research that demands statistically valid sample sizes. Even though the automated methods’ results are still not as good as the process ones, the gap is not so large either. Current shortcomings are not inherent – techniques and libraries can and probably will be improved in the near future, making it possible to rely on an automated method to calculate the Happy Level.
Example of Application
The previous sections showed that the most appropriate method to calculate HL is based on Method 1. HL is then calculated for each Work Experience. The individuals’ HL is obtained from an average (Global HL), weighted by their time on each Work Experience. Both indicators (i.e., Work Experience HL and Individual Global HL) can be used to develop analyses to answer the research question of the study used as an example (i.e., what makes people more or less happy at work).
As mentioned previously, the Happy Level can be applied to within-person and between-person analyses. For example, in a within-person analysis, it is possible to develop individual timelines with Happy Level variations, providing a longitudinal perspective to assess changes over time. Linking Happy Level variations to what has happened in respective periods, as described in the narrative, can provide insights into how events influenced happiness at work. Figure 3 presents examples of timelines developed for the study in question.

Happy level timeline by person (examples).
One of the analyses that can be performed at a between-person level is ordering Work Experiences to their Happy Level. Table 7 presents the ten happiest Work Experiences (i.e., highest HL), the ten most unhappy Work Experiences (i.e., lowest HL), and their key information.
Work-Experience Top/Bottom-10 Ranking by Happy Level.
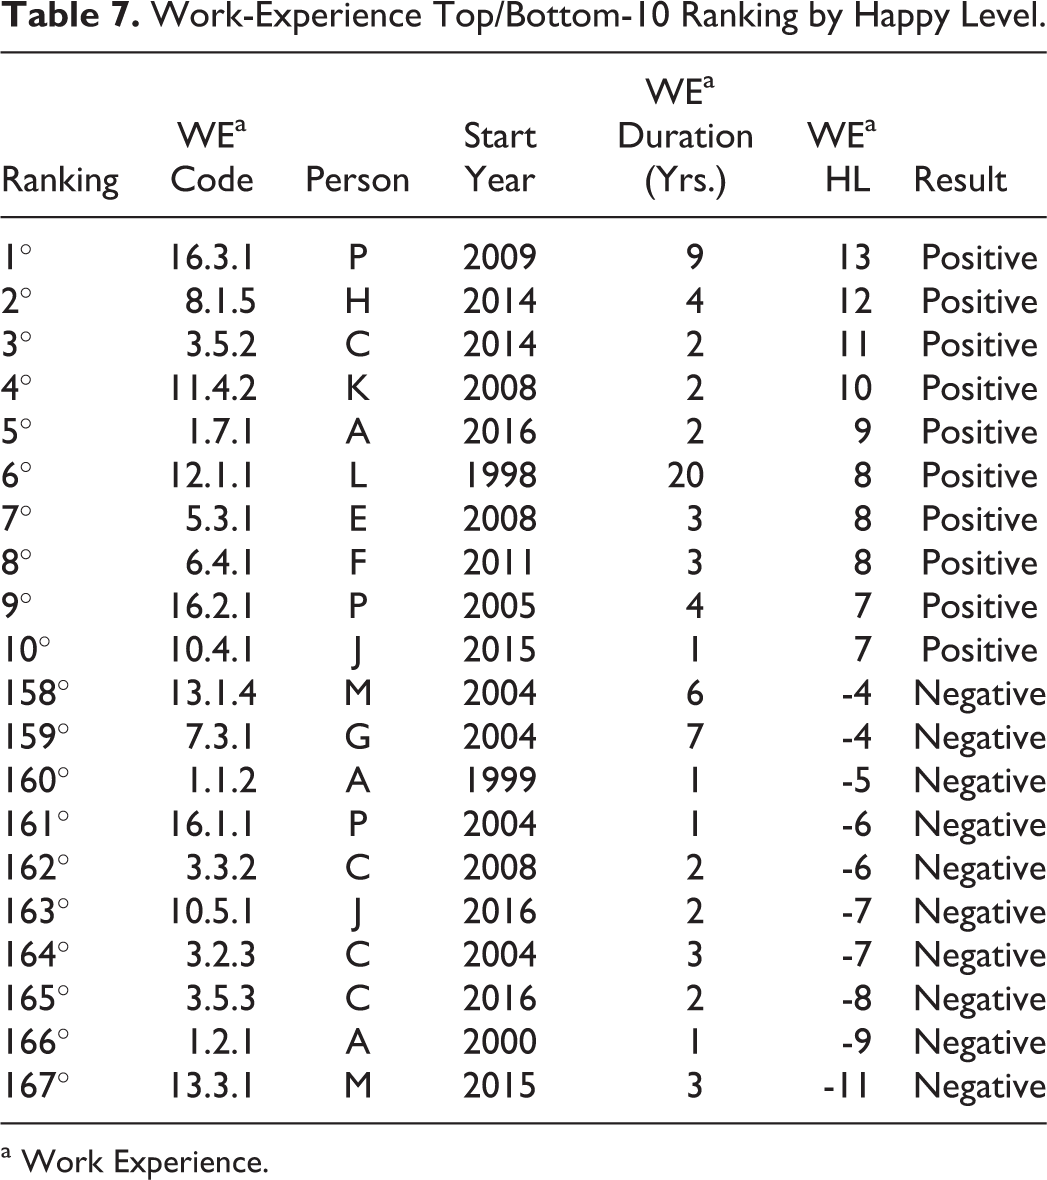
a Work Experience.
From Table 7, it is possible to observe that five of the 16 individuals studied had more than one experience in this group. Four of these five had both Top
In another possible analysis, individuals’ Global HL can be compared one with another. Figure 4 shows the maximum and minimum Happy Level values calculated for each individual’s Work Experiences as well as their respective Global HL value (i.e., average HL of all Work Experiences weighted by duration).

Happy level by person.
In this group of individuals, the Global HL tends to be more positive than negative. Only four of the 16 individuals studied had a negative weighted average. However, all individuals had at least one negative experience, except for Person L, who only had one experience, and it was positive.
Person B, Person D, Person I, and Person N have the smallest HL variation among their Work Experiences. Person P and Person C have the highest variation; however, Person P is the happiest person (the highest Global HL), while Person C is the second least happy person (has the second-worst Global HL).
These examples of applications of Happy Level were part of the study. Together with other analyses, both quantitative and qualitative, they helped reach the research conclusions, which indicate the relevance of individual factors in Happiness at Work.
Conclusions
The lack of a widely accepted measurement that embraces a broad spectrum of aspects related to such a complex phenomenon as Happiness at Work has led to divergent and questionable results, harming its scientific knowledge evolution. The Happy Level proposal here presented uses as theoretical support Kahneman’s concepts of identifying pleasant and unpleasant episodes through positive and negative terms (Kahneman, 2011), by applying the Sentiment Analysis technique to convert narratives into quantifiable indicators.
The method proposed brings some theoretical and methodological contributions to the study of Happiness at Work.
First, since it proposes a measure based on an open description of individuals’ own work experiences, the present method avoids selecting some specific aspects, leaving outside the analysis of other elements that could be important for a specific situation. It also avoids the shortcomings of largely using self-report instruments, as questionnaires and surveys (Cullen, 2017; Dasborough et al., 2008; Hipp et al., 2020).
Based on two different methods (i.e., Narrative and Sentiment Analysis), the proposed approach is more comprehensive, leading to a less questionable comparison among different research results, which contributes to consolidating the scientific conclusions and reducing controversy about the topic.
Second, by comparing alternative methods to calculate the Happy Level to a baseline, the analysis of the differences between methods found in the present study helps to point a direction to improve the techniques and libraries in order to reduce the gap between manual and automated methods. Although the manual process presents the best adherence to the baseline at the present moment, automated methods also seem promising. Improvements in techniques, such as incorporating context analysis based on linguistic, and in libraries, such as specializing them according to the topic and improving the Brazilian Portuguese Language, will lead these automated methods to better adherence. Besides, learn from what each method has as best would help each method to improve.
Finally, as a third contribution, the use of technology in Sentiment Analysis as in the proposed methods, together with an automatic transcription of interviews, will provide scalability to calculate the Happy Level, enabling more extensive use. Thus, it would be possible to expand analyses like the ones presented in this paper for the research chosen as an example. It will also allow the use of this indicator in quantitative research that demand larger amounts of data.
As a result of the contributions described above, the present study has some implications. For Management research, it allows the expansion of measurement to instruments beyond the traditional questionnaires and self-response surveys, overcoming the shortcomings that lead to “a vast but surprisingly disjointed and unfocused body of literature across diverse fields that relates (…) well-being in the workplace” (Danna & Griffin, 1999) due to the fact that “the problem of measurement is an old one for research on this topic” (Ledford, 1999). For Computing research, this study provides input to improve Sentiment Analysis techniques and libraries, even when applied to fields other than Organizational Behavior.
For practitioners, the Happy Level is more representative of employees’ perceptions of their work, allowing managers and HR professionals to capture more aspects and elements that could impact their happiness at work. It also offers a way of adopting or expanding the use of Sentiment Analysis in companies, a competency that can help in other management challenges (e.g., marketing analyses).
Besides the contributions and implications, the present study also has some limitations. The main one is that the calculation to compare the methods was based on one single (although very comprehensive and broad) research. It would be interesting to ensure that the results would still be the same in other research with distinct data.
Therefore, some future studies are indicated to develop and evolve the present proposal, both conceptually and technologically. One path is to expand the present study with a new round of data collection, gathering new work experiences, or create entirely new research serving as a database. A second path relates to analyzing the used libraries in-depth to identify what they have best and replicate or incorporate improvements. Finally, we suggest studying the impact of associating the use of machine learning techniques to the Sentiment Analysis, which could considerably improve the automated methods’ accuracy.
Footnotes
Appendix
Codebook (in Portuguese).

| Negative Termsa | Modifierb “NO” | Positive Termsa | Modifierb “NO” |
|---|---|---|---|
| Agradável | X | adorar | |
| Alegria | X | agradável | |
| Amar | X | alimentar | |
| Angústia | amar | ||
| Árduo | ápice | ||
| Arrasado | bacana | ||
| Aterrorizante | bem | ||
| Bacana | X | bom | |
| Bizarro | confortável | ||
| Bom | X | curtir | |
| Caos | desmotivante | X | |
| Chateado | divertido | ||
| Chato | divisor de águas | ||
| Choque | empolgado | ||
| Chorar | energia boa | ||
| Complicado | excelente | ||
| conflito meu | excepcional | ||
| Constrangimento | fantástico | ||
| Curtir | X | fazer “tum” | |
| Decepção | felicidade | ||
| Depressão | ganhar muito com isso | ||
| Desastroso | glória | ||
| Desconforto | gostar | ||
| Descontentamento | gostoso | ||
| Desgaste | incômodo | X | |
| Difícil | incrível | ||
| Dor | interessante | ||
| Esquisito | legal | ||
| Estranho | maneiro | ||
| Estresse | maravilhoso | ||
| Felicidade | X | máximo | |
| ficar para morrer | melhor | ||
| Frustração | motivante | ||
| Funcionar | X | mover | |
| Gostar | X | ótimo | |
| Horrível | paixão | ||
| Horroroso | perfeito | ||
| Incômodo | pleno | ||
| Inferno | positivo | ||
| Irritação | prazer | ||
| Legal | X | querer | |
| Mal | realização | ||
| Odiar | ruim | X | |
| para baixo | satisfação | X | |
| Penar | sentir-se à vontade | ||
| Pesado | show | ||
| Péssimo | tranquilo | ||
| Pior | trocar | ||
| Prazer | X | vôo de cruzeiro | |
| Puto | |||
| Querer | X | ||
| Rancor | |||
| Reclamar | |||
| Ruim | |||
| Sacrifício | |||
| satisfação | X | ||
| sentir falta | |||
| sentir muito | |||
| sentir-se à vontade | X | ||
| sentir-se em casa | X | ||
| sentir-se perdido | |||
| sobreviver | |||
| socorro | |||
| sofrer | |||
| suportar | X | ||
| tenso | |||
| ter saco | X | ||
| terrível | |||
| tirar o sono | |||
| triste | |||
| ver saída | X |
a The terms in this list represent their variations, as in the examples: desgaste = desgastado, desgastante, desgaste e desgastar // incômodo = incomodado, incomodar e incômodo.
b The presence of the modifier “NO” makes the term have the opposite effect (e.g., “agradável” is a positive term, but “não agradável” is a negative term).
Declaration of Conflicting Interests
The author(s) declared no potential conflicts of interest with respect to the research, authorship, and/or publication of this article.
Funding
The author(s) received no financial support for the research, authorship, and/or publication of this article.