
Abstract
Background: Substance use disorders (SUD) are associated with metabolic dysregulation and nutritional deficiencies. Studies show that incorporating nutrition interventions into treatment may improve physical and psychological health. This study sought to explore dietary and consumer behavior in individuals currently using substances. Methods: Data from the 2013 – 2018 National Health and Nutrition Examination Survey were used for this cross-sectional study. Individuals 18 – 69 who were currently using marijuana, cocaine, heroin, methamphetamines, or injected unprescribed drugs were compared with individuals not using substances. Dietary and consumer behavior, including alcohol consumption was assessed. Analyses were performed using Stata I/C version 15. Results: An unweighted sample of 12 943 adults was analyzed. A weighted proportion of 14.2% reported using substances in the prior 30 days. Individuals currently using substances reported more commercially prepared meals compared to individuals not using substances (P-value ≤.001), increased food insecurity (P ≤ .001), and increased alcohol intake (P ≤ .001). Multivariable logistic regression showed that both food insecurity and alcohol intake were independently and significantly linked to substance use. Conclusion: Nutrition interventions for those using substances or in early recovery should incorporate education on practical food preparation within the social constraints of the individual, including higher rates of food insecurity.
Keywords
“The combination of drug use, alcohol and poor dietary and consumer behaviors presents an opportunity for nutrition interventions from clinicians trained in motivational interviewing techniques.”
Introduction
Substance use disorder (SUD) affects 16.5% of the United States population aged 12 and older, according to the United States 2021 National Survey on Drug Use and Health. 1 Within this same year, over 100 000 substance use overdose-related deaths were reported. 2 Despite efforts to curb this health crisis, overdose deaths from substance use persist.3,4 Further complicating matters, existing therapies for SUD, including medication-assisted therapy, counseling, and peer support, have been insufficient, with 40%–60% of patients lapsing from treatment within the first year.5,6
Growing evidence supports an association between SUD physical and behavioral recovery and diet with nutritional interventions aiding in the SUD recovery process.7-10 Substance use can decrease an individual’s appetite, resulting in metabolic dysregulation and irregular dietary intake patterns. The dietary and metabolic changes occurring due to substance use frequently lead to insufficient food consumption and ineffective absorption of essential nutrients, which can result in nutritional deficiencies and malnutrition.11,12 Specifically, substance use has been associated with increased levels of zinc and copper and decreased levels of iron, magnesium, folate, and vitamins A, C, and E.13-15 Alcohol use has been associated with decreased levels of thiamine potentially resulting in Wernicke’s encephalopathy. 12 The biochemical changes resulting from a nutritional deficiency may further impact the chemical addiction cycle and become a barrier to treatment and recovery. 16 Substance use is associated with increased neuroinflammation which may benefit from dietary interventions that reduce inflammation. 17 Additionally, substance use and dietary behavior affect the gut microbiome which in turn has been shown to affect an individual’s response to substances.18,19 Current research is exploring this gut-microbiome-substance relationship across many substances including but not limited to alcohol, marijuana, stimulants and opioids.18-20
Prospective clinical trials report that healthy eating habits improve physical and psychological SUD outcomes.7-10 However, a recent Los Angeles study found that only 7% of SUD treatment providers recommend nutrition services within their clinical practice.9,21 And a systematic review of experimental nutritional interventions within substance use treatment identified only 5 studies, 3 outpatient and 2 inpatient/residential. 10 This suggests that medical providers of recovery and treatment services could be underutilizing the benefit of nutritional services to promote SUD recovery.
Barriers to implementing nutritional services for individuals with substance use including SUD may be driven by limited clinician knowledge regarding the population’s consumer behaviors around food, such as where food is purchased and how it is prepared. These health behaviors, conducted before food consumption, influence an individual’s ultimate nutritional status.22-25 Examining food-related lifestyle factors can help clinicians understand an individual’s complete dietary profile and develop targeted interventions to improve health.
However, nutritional behaviors and outcomes stand together. Although dietary interventions may be promising, they are complicated by the social determinants of health (SDOH) within this population. Individuals with substance use may have lower economic stability and incomes and challenges with social integration and support systems due to prior incarceration. These unstable working or living conditions can create barriers to substantive behavioral change.26-30 These barriers may be exacerbated by difficulties in finding housing that is safe and affordable, provides easy access to work or school, and is near a grocery store with fresh food. Low-income or subsidized housing that offers access to employment is frequently found in areas with no grocery stores, termed “food deserts,” or places where fast food establishments vastly outnumber the fresh food options, termed “food swamps.”11,31 Additionally, whole foods are seen as a luxury and time commitment, something many in early recovery struggle to have due to daily recovery meetings and frequent medical appointments.11,32
To gain insight into developing targeted interventions in this population, this study sought to determine the sociodemographic characteristics of individuals using substances. The study tested the hypothesis that individuals using substances would present with different nutrition expenses, consumer preferences, perception of food insecurity, and alcohol consumption when compared to individuals not using substances. Using data from the United States (U.S.) National Health and Nutrition Examination Survey (NHANES), a cross-sectional analysis was conducted to evaluate the hypothesis.
Methods
Data Source
This study used data from the U.S. National Health and Nutrition Examination Survey (NHANES). 33 NHANES is administered as part of a cross-sectional study investigating the health and nutrition of a nationally representative sample of the U.S. civilian resident noninstitutionalized population. The weighting of the sample data permits obtaining estimates of the statistics that represent the entire eligible population of the U.S. This survey consists of an interview and physical examination, both focused on various health and nutrition measurements. NHANES uses a multi-stage sampling design to select participants and collect data in 2-year cycles. Due to the COVID-19 pandemic, access to recent NHANES data (2017 – 2020) is partially restricted; thus, this study utilized data from the 3 prior cycles covering 2013 – 2018.
Population
The population included participants who completed the Drug Use Questionnaire (DUQ) during the Medical Examination Component (MEC) interview and aged 18 – 69. The DUQ is only offered to individuals between the ages of 12 – 69 years. Minors aged 12–17 may have dietary intake and substance use patterns that are affected by developmental, legal, familial, and socioeconomic status in ways that are different from that of adults. Thus, the sample was restricted to adults aged 18 – 69 years. The population was further limited by excluding individuals whose substance use status could not be determined.
Substance Use Status
Substance use status was the study outcome and was determined by evaluating the response and subsequent responses to 3 questions in the DUQ: (1) “Have you ever, even once, used marijuana or hashish?” (DUQ200) (2) “Have you ever used cocaine, crack cocaine, heroin, or methamphetamine?” (DUQ240) (a) “Have you ever, even once, used cocaine, in any form?” (DUQ250) (b) “Have you ever, even once, used heroin?” (DUQ290) (c) “Have you ever, even once, used methamphetamine?” (DUQ330), (3) “Have you ever, even once, used a needle to inject a drug not prescribed by a doctor?” (DUQ370)
If the response to any of the above questions was positive, a time since last use in days was calculated based on the NHANES two-part question “How long has it been since you last used XXX?”. In the NHANES, this question is divided into a numerical value (part 1: DUQXXXQ) and the value of a unit (part 2: DUQXXXU) of “Days,” “Weeks,” “Months,” “Years,” “Refused,” “Don’t Know” and missing. By converting the values for “Weeks,” “Months,” and “Years” into days, individuals were then classified as either using substances (used within the last 30 days) or nonusers (definitively had not used in the previous 30 days). In any cases where use in the last 30 days could not be determined (e.g., “Refused,” “Don’t Know,” or missing response), the participants were excluded from the final analysis. Based on prior literature, the criterium of 30 days was set to capture individuals currently using substances. 34 Participants who had never used substances and participants who had used substances but more than 30 days in the past were considered individuals not using substances. Appendix 1 presents a detailed description of the variables used to determine the study outcome. Because the study outcome was based on the NHANES DUQ, alcohol use was not considered in the outcome variable.
Measures of Food-Related Dietary and Consumer Behavior
Ratio of Money Spent on Food at the Store/ Money Spent Eating out
The ratio of money spent on food in stores to money spent eating out, take out, or delivery involved answers to questions from the Consumer Behavior Questionnaire. To calculate a numerator for the ratio, the response to the question “About how much money was spent on nonfood items?” (CBD091) was subtracted from the response to the question, “During the past 30 days, how much money (did your family/did you) spend at supermarkets or grocery stores? Please include purchases made with food stamps.” (CBD070). To the amount of money remaining, the response to the question, “About how much money (did your family/did you) spend on food at these types of stores? Please do not include money you have already told me about.” (CBD111) was added. Separately, a denominator for the ratio was calculated by summing the responses to 2 questions: “During the past 30 days, how much money (did your family/did you) spend on eating out? Please include money spent in cafeterias at work or school or on vending machines, for all family members.” (CBD121) plus the amount reported in the question “During the past 30 days, how much money (did your family/did you) spend on food carried out or delivered? Please do not include money you have already told me about.)” (CBD131).
Meals Prepared Away from Home (Commercially Prepared)
This study also looked at the response, “Next, I’m going to ask you about meals. By meal, I mean breakfast, lunch, and dinner. During the past 7 days, how many meals did you get that were prepared away from home in places such as restaurants, fast-food places, food stands, grocery stores, or vending machines?” (DBD895) from the Diet and Nutrition Questionnaire.
Associated Dietary and Consumer Factors
Food Insecurity
The first 3 questions from the NHANES Food Security Questionnaire assessed food insecurity. These questions represented stage 1 screening for food security and asked respondents to rate how frequently they experienced worry that they would run out of food, that food didn’t last, that they didn’t have money to buy more, and that they couldn’t afford to eat balanced meals. Food insecurity status was calculated as positive if any response to the food security variables were “sometimes true” or “often true.”
Alcohol Consumption
As alcohol, like other substances, may be a factor in dietary behavior, and prior studies have noted differences in consumption between individuals with SUD and those without SUD, a measure of consumption was included in the analysis.35,36 Using the Alcohol Use Questionnaire, individuals were classified as having no drinks in the past year (none), having moderate alcohol intake defined as having some alcohol, up to 1 drink per day for women, and 2 drinks per day per men. High alcohol intake was anything greater than 1 drink per day for women and 2 drinks per day for men. 37
MyPlate
Finally, this study examined exposure to the USDA MyPlate initiative using the question, “Next, I’m going to ask a few questions about the nutritional guidelines recommended for Americans by the federal government. Have you heard of My Plate?” (CBQ596) from the Diet and Nutrition Questionnaire.
Sociodemographic Variables
Food-related features, such as color, texture, packaging, individual differences, and social factors, may impact the food choices made by an individual. 38 Although food-related features do not change based on the individual, personal and social factors may differ. Associated variables previously identified in the literature were included in the analysis.23,39-41 Variables for analyses included survey cycle, age, gender, ethnicity/race, education, marital status, the type of work done last week, the type of housing, the ratio of family income to poverty, the total number of people in the household, and the total number of people in the family.
Data values of “Refused” and “Don’t know” were treated as missing data.
Statistical Analysis
After merging the variables of interest from cycles 8, 9 and ten of NHANES and adjusting the survey weights as recommended by the administrators, we reported unweighted frequencies, weighted proportions, and weighted measures of central tendency. The weighted measures were calculated by using the “svy:” command. We did not use weighted analyses in other estimations, because our research question focused on understanding differences in the study groups rather than on reporting quantitative data or inferences of substance use on the U.S. civilian resident noninstitutionalized population. Also, a previous comparison of crosstabulations of weighted and unweighted data, showed similar percentages in a substantial number of variables. We conducted univariate analysis using binary logistic regression to determine variables associated with current substance use (Y = 1, cases) and not using substances in the last 30 days (Y = 0, controls). In these analyses we reported OR and 95% CI and we tested 17 separate hypotheses, we aimed to decrease the probability of Type I error by adjusting the significance level to P-value ≤.003 by using the Bonferroni correction formula.
42

In a second step an unweighted exploratory multivariate binary logistic regression model was constructed including the variables with a P-value ≤.01 in the univariate analysis. The covariates in this model were: survey cycle, categories of age, ethnicity/race, education, marital status, type of work done last week, housing, ratio of family income to poverty, family size, number of meals not home prepared, food insecurity, and alcohol intake per day last year. We assessed if collinearity was present by calculating variance inflation factors (VIF). We observed an overall mean VIF = 1.48 (maximum value = 2.68). For this model we reported OR and 95% CI, the Hosmer-Lemeshow goodness-of-fit test, and the sensitivity/specificity of the model to allocate observations correctly. In addition, we reported the unadjusted and adjusted P-values resulting from using the Bonferroni formula, setting the level of significance for the adjusted ones to P ≤ .004. As a last step we conducted analyses of margins to determine the probability of current substance use by categories of alcohol consumption and categories of age. Stata IC (version 15, College Station, TX) was utilized to conduct all analyses.
Results
The survey design included 45 stratums and 90 primary sampling units for an unweighted sample of 29 400 individuals. Of these, a total of 12 943 (44.0%) were adults (18 to 69 years old) who had complete data on the DUQ and were included in the analyses. The 12 943 observations represented a weighted count of 193,812,108 individuals. See Figure 1 for inclusion CONSTORT diagram. From participants included in the analysis, we found that a weighted percentage of 14.2% reported current substance use. We found the survey cycle was associated with the study outcome, compared to the survey from 2013 – 2014, participants in the survey from 2017 – 2018 were 24.0% more likely to report current substance use (OR = 1.24, 95% CI = 1.10 – 1.40). Participant inclusion CONSORT diagram.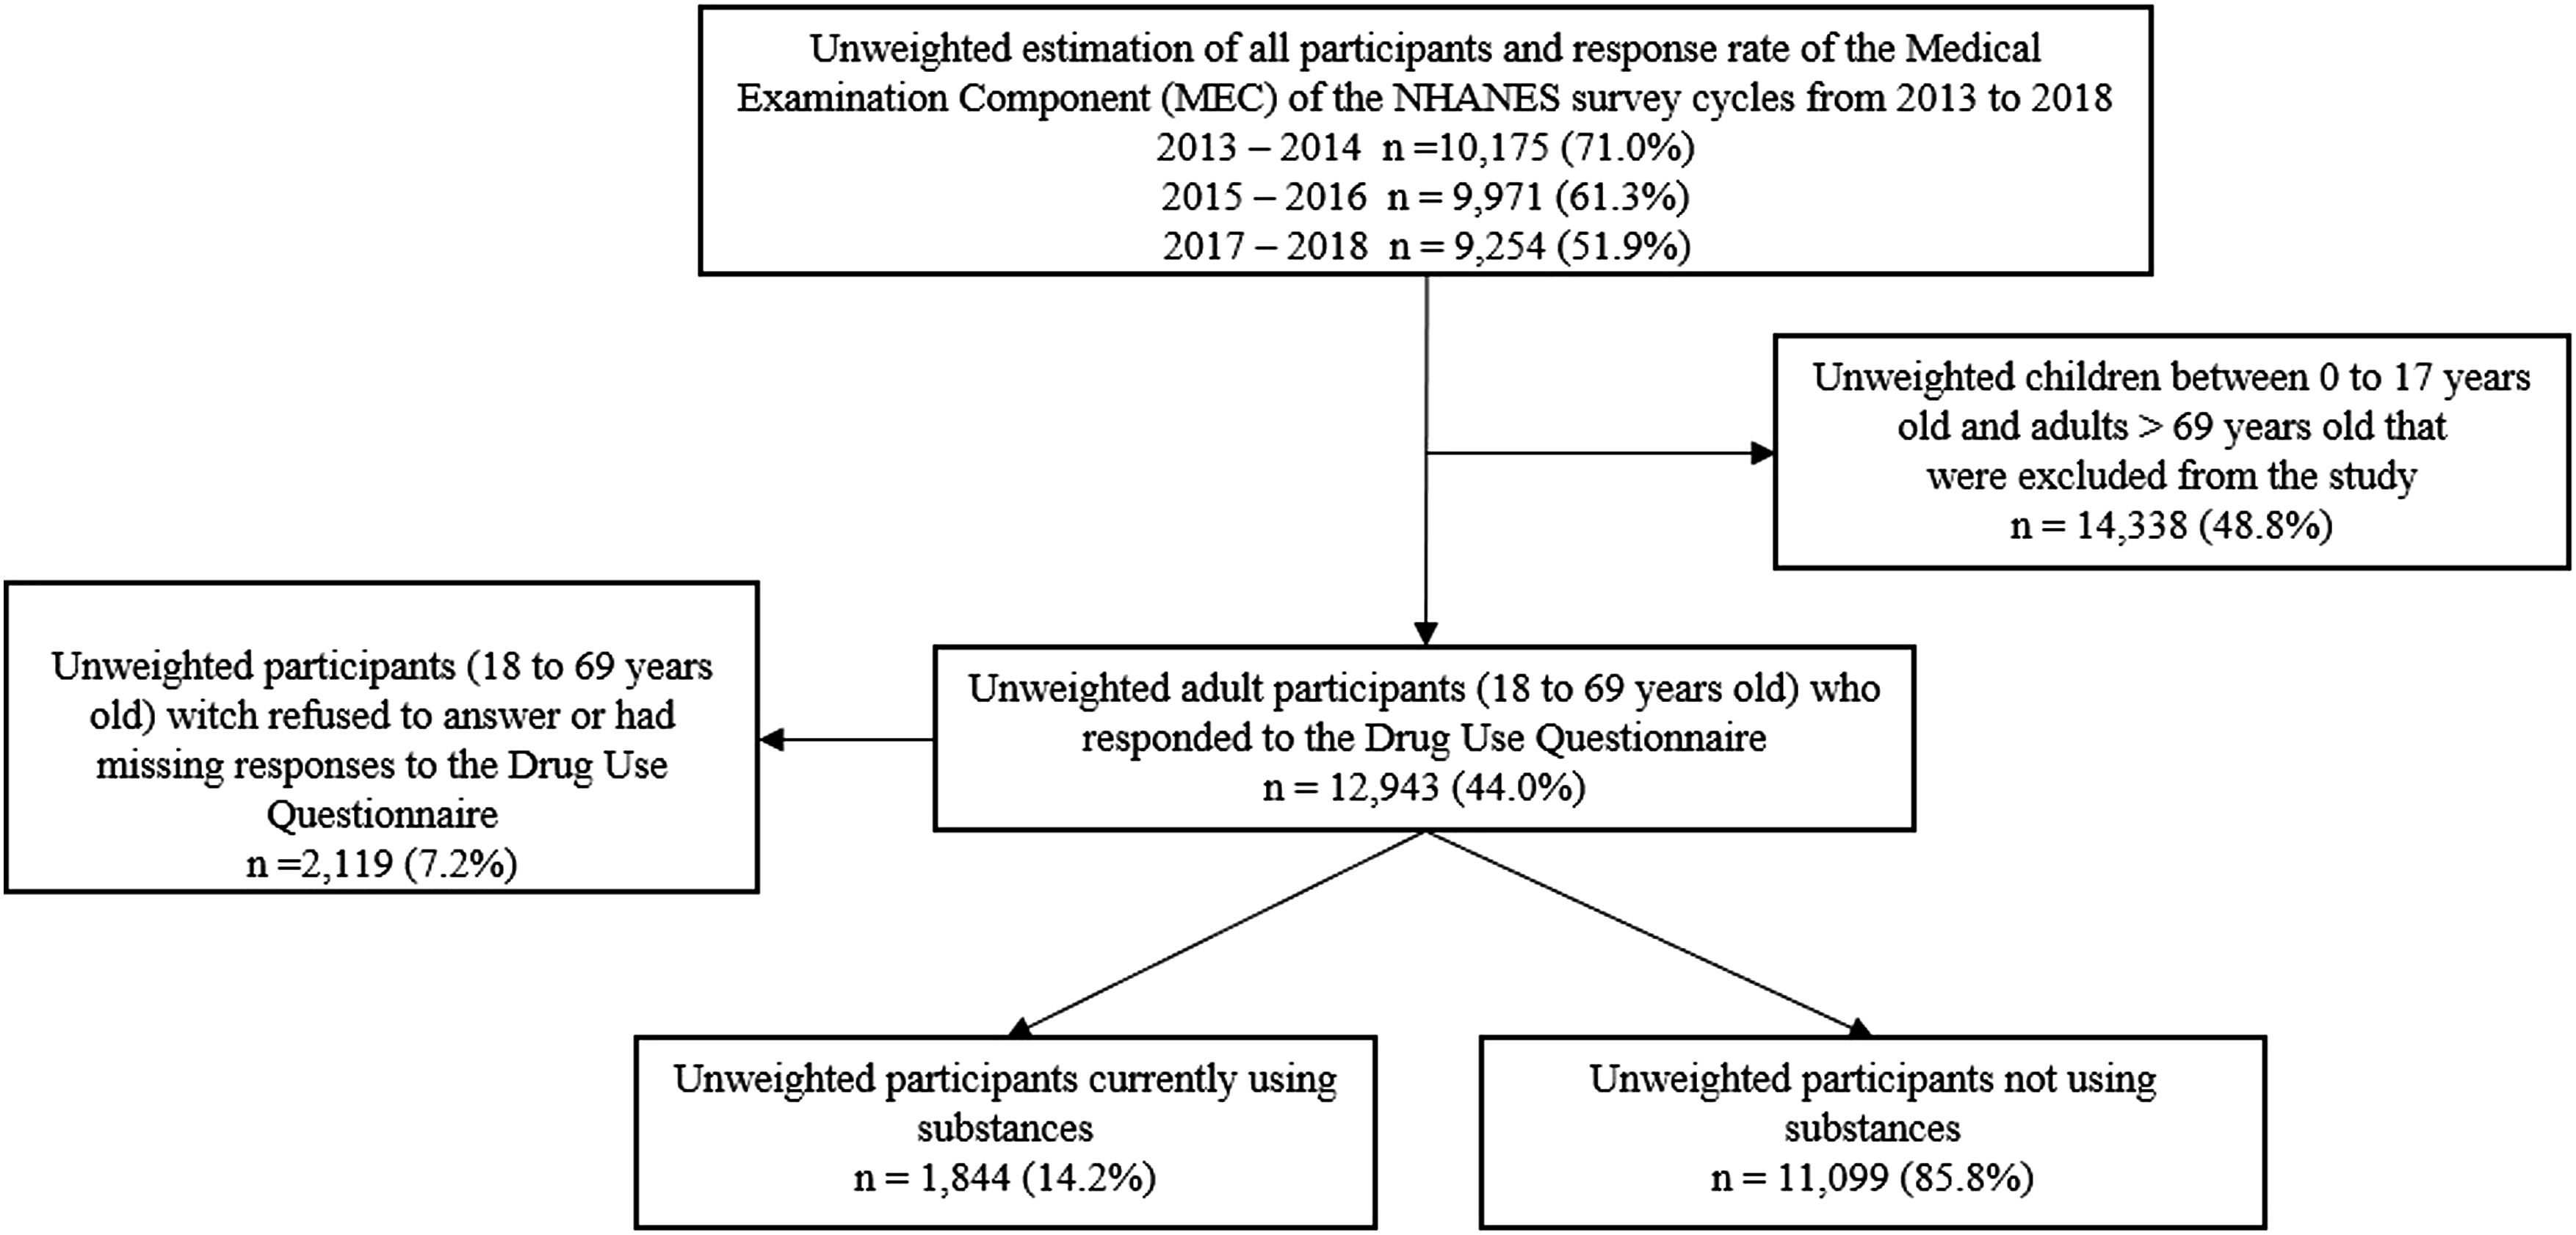
Sociodemographic Characteristics
Unweighted Frequencies and Weighted Percentages of Sociodemographic Characteristics by Current Substance Use Status and Including the Corresponding Univariable Binary Logistic Regression. Source: NHANES 2013-2018, Unweighted Analyses.
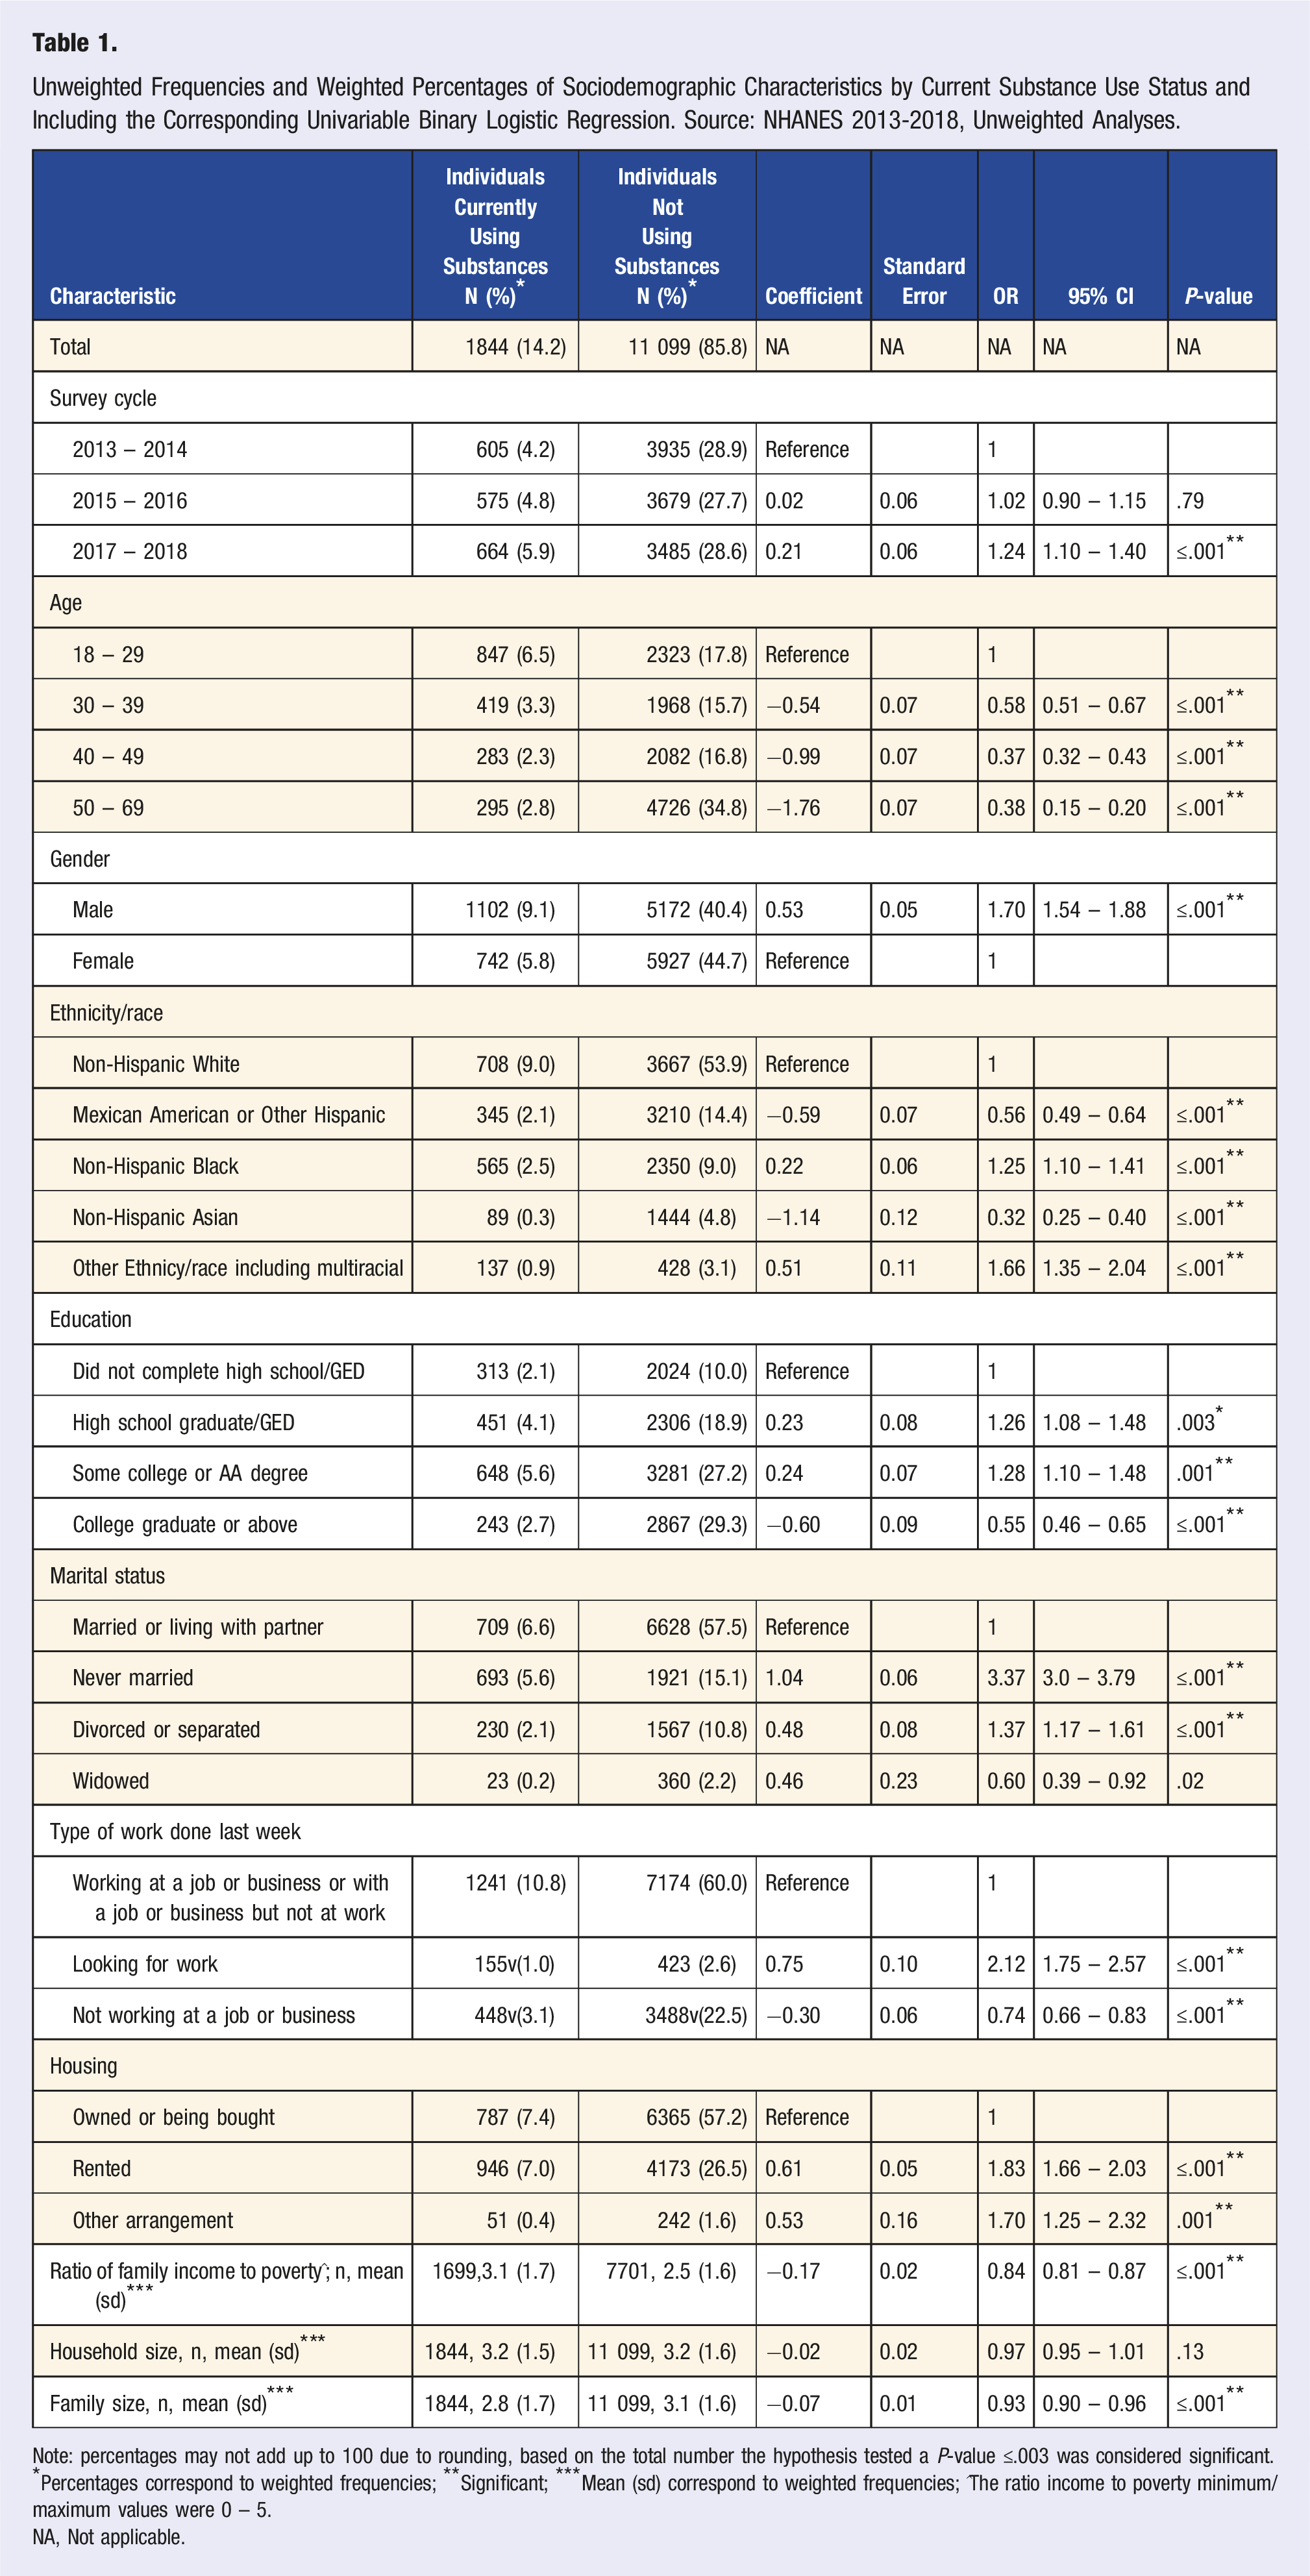
Note: percentages may not add up to 100 due to rounding, based on the total number the hypothesis tested a P-value ≤.003 was considered significant.
*Percentages correspond to weighted frequencies; **Significant; ***Mean (sd) correspond to weighted frequencies; ^The ratio income to poverty minimum/maximum values were 0 – 5.
NA, Not applicable.
Nutrition, Behavior, and Lifestyle-Related Preferences
Unweighted Frequencies and Weighted Percentages of Nutrition, Behavior, and Lifestyle-Related Preferences by Current Substance Use Status and including the Corresponding Univariable Binary Logistic Regression. Source: NHANES 2013-2018, Unweighted Analyses.
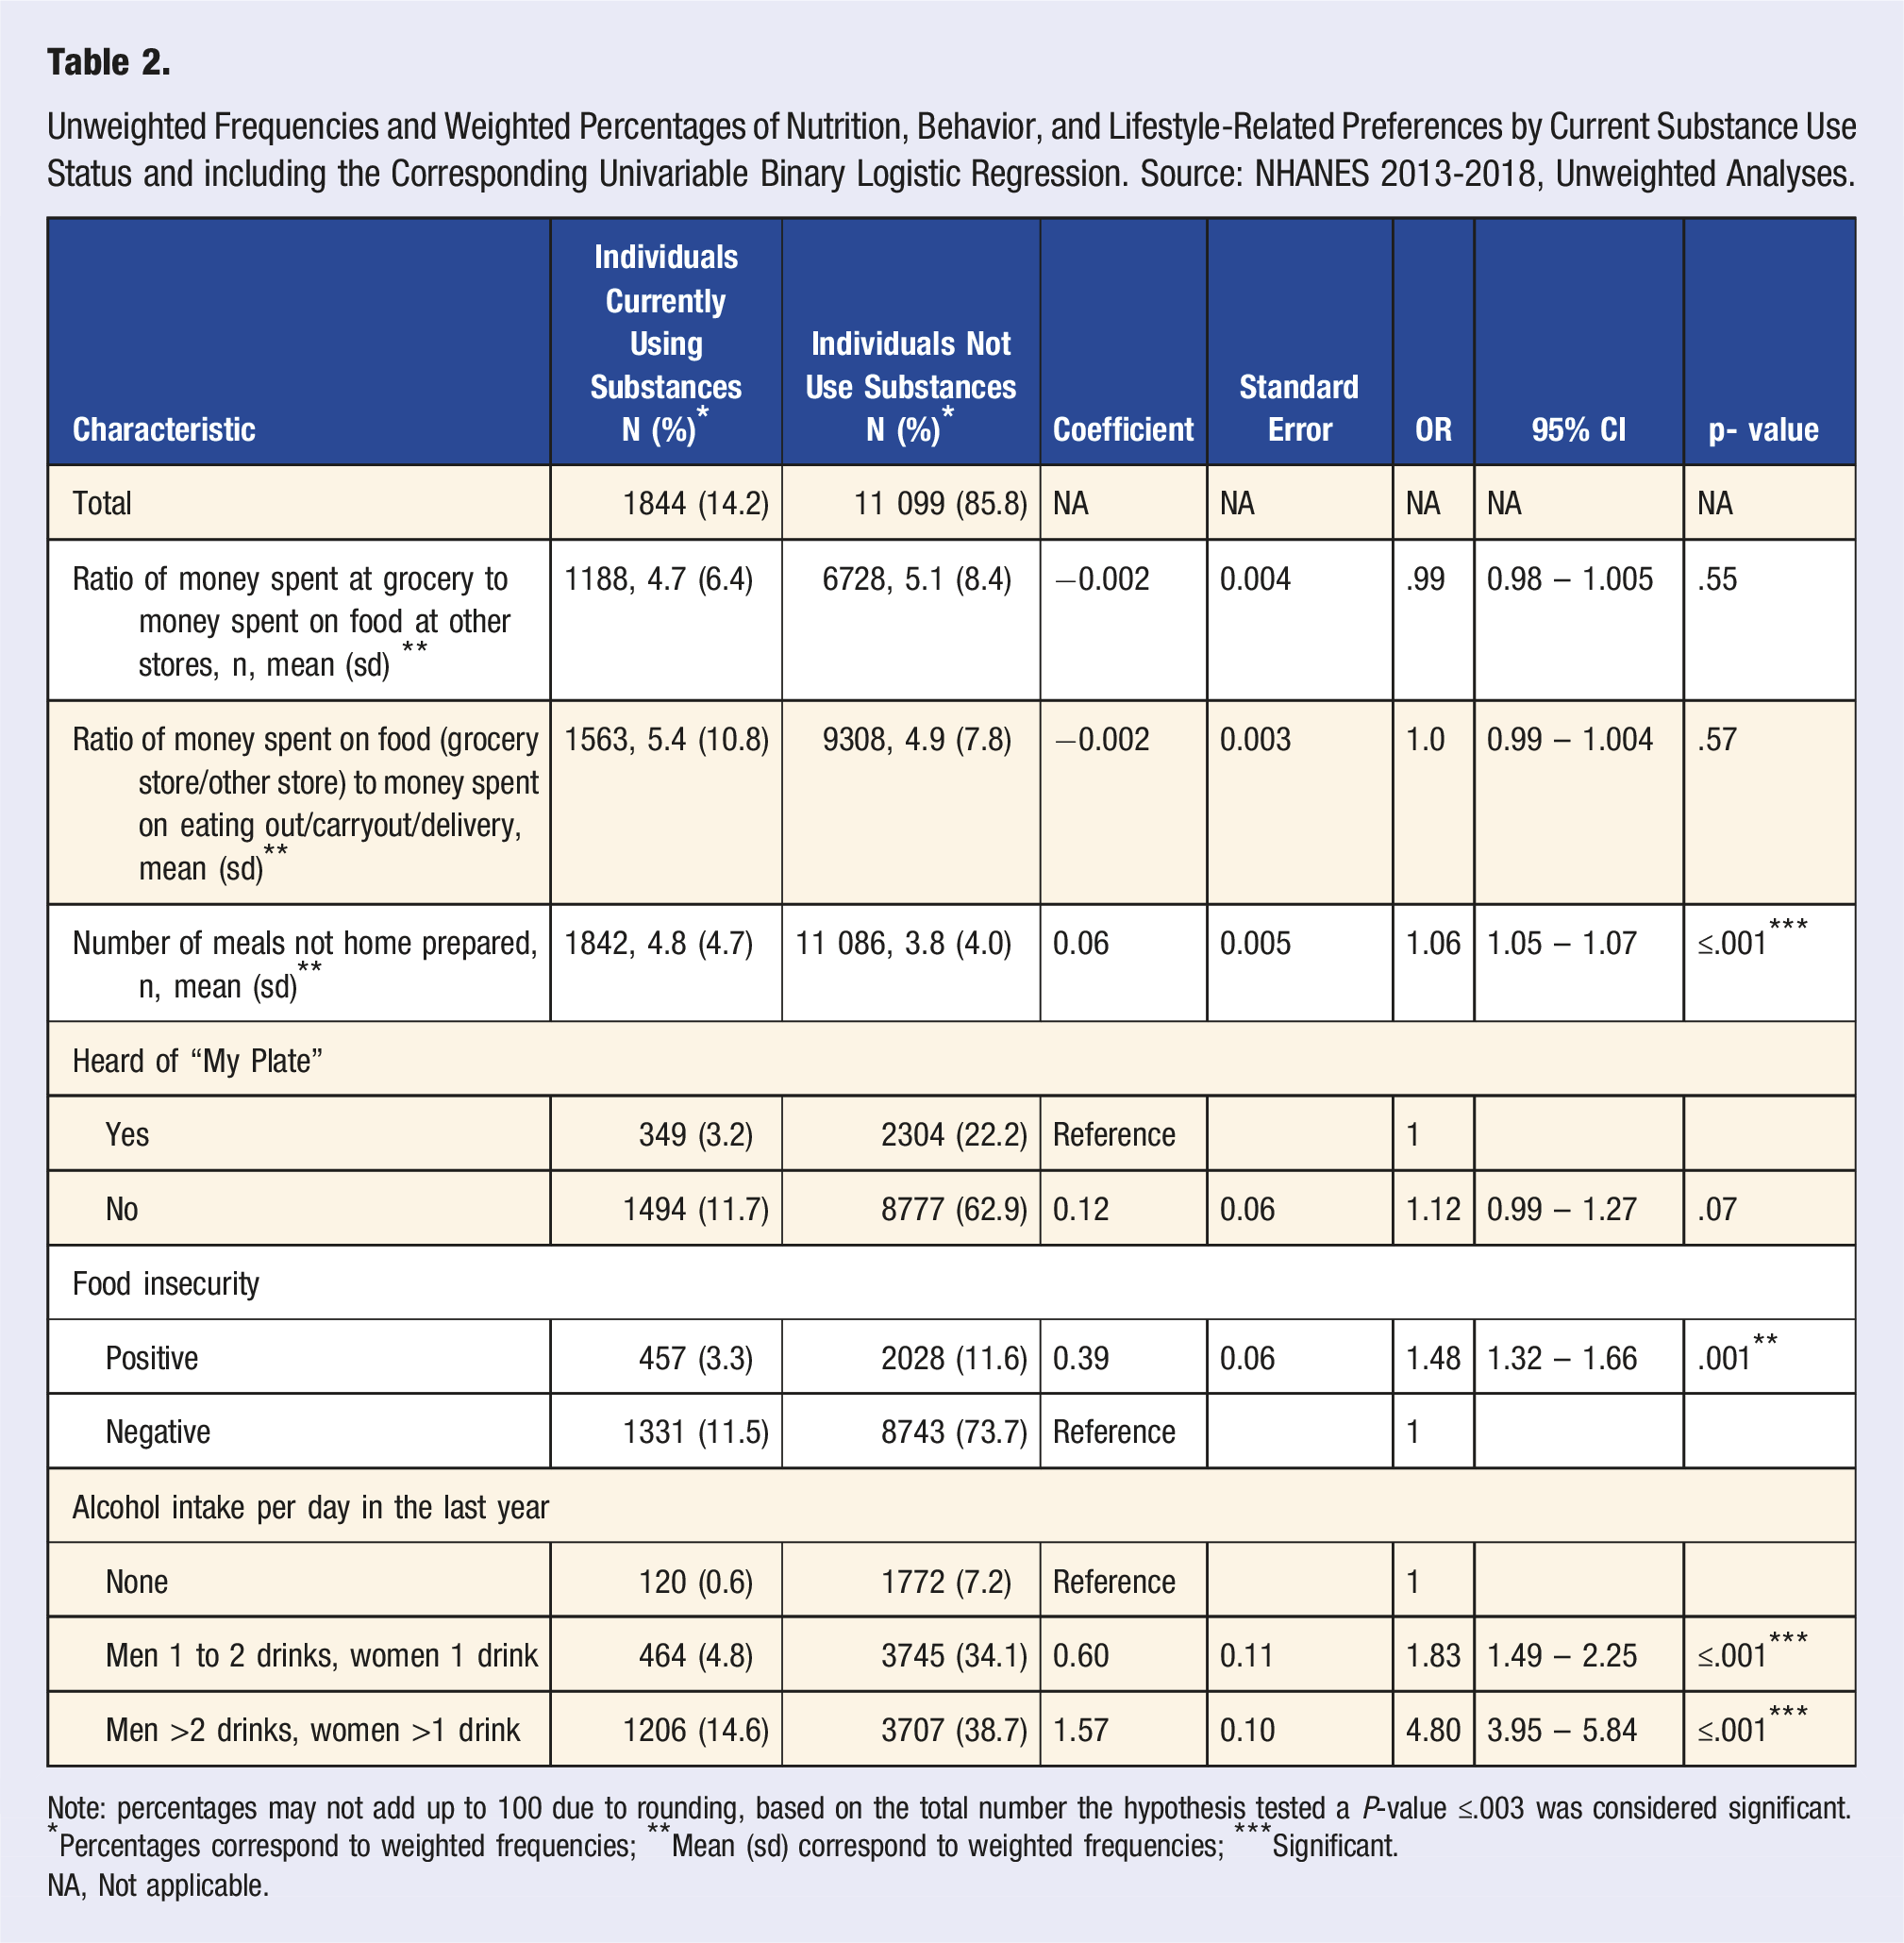
Note: percentages may not add up to 100 due to rounding, based on the total number the hypothesis tested a P-value ≤.003 was considered significant.
*Percentages correspond to weighted frequencies; **Mean (sd) correspond to weighted frequencies; ***Significant.
NA, Not applicable.
Multivariable Binary Logistic Regression Model
The multivariable exploratory logistic regression model included 13 covariates with P-values ≤.01 from the univariate analyses and by using the Bonferroni correction, the P-value of significance was set at ≤ .004. A total of 9596 observations were included in the model. The model correctly classified 84.8% of observations, with a sensitivity of 13.0% and a specificity of 98.1%. We found the survey cycle was associated with the outcome, compared to cycle 2013-2014, respondents from cycle 2017-2018 were 40.0% more likely to report current substance use in the previous 30 days (OR = 1.40, 95% CI = 1.20 – 1.62). Compared to participants aged 50 to 69 years old, participants aged 40 to 49 years were more than 2 times more likely to report recent current substance use (OR = 2.22, 95% CI = 1.82 – 2.72) and compared to the same reference group, participants aged 30 to 39 years old, were more than 3 times more likely to be using substances (OR = 3.20, 95% CI = 2,63 – 3.90). Compared to the older reference group, participants aged 18 to 29 years old were more than 4 times more likely to report current substance use during the same period (OR = 4.63, 95% CI = 3.78 – 5.67).
Multivariable Binary Logistic Regression Model of Determinants Associated With or Without Current Substance use. Source: NHANES 2013-2018, Unweighted Analyses.
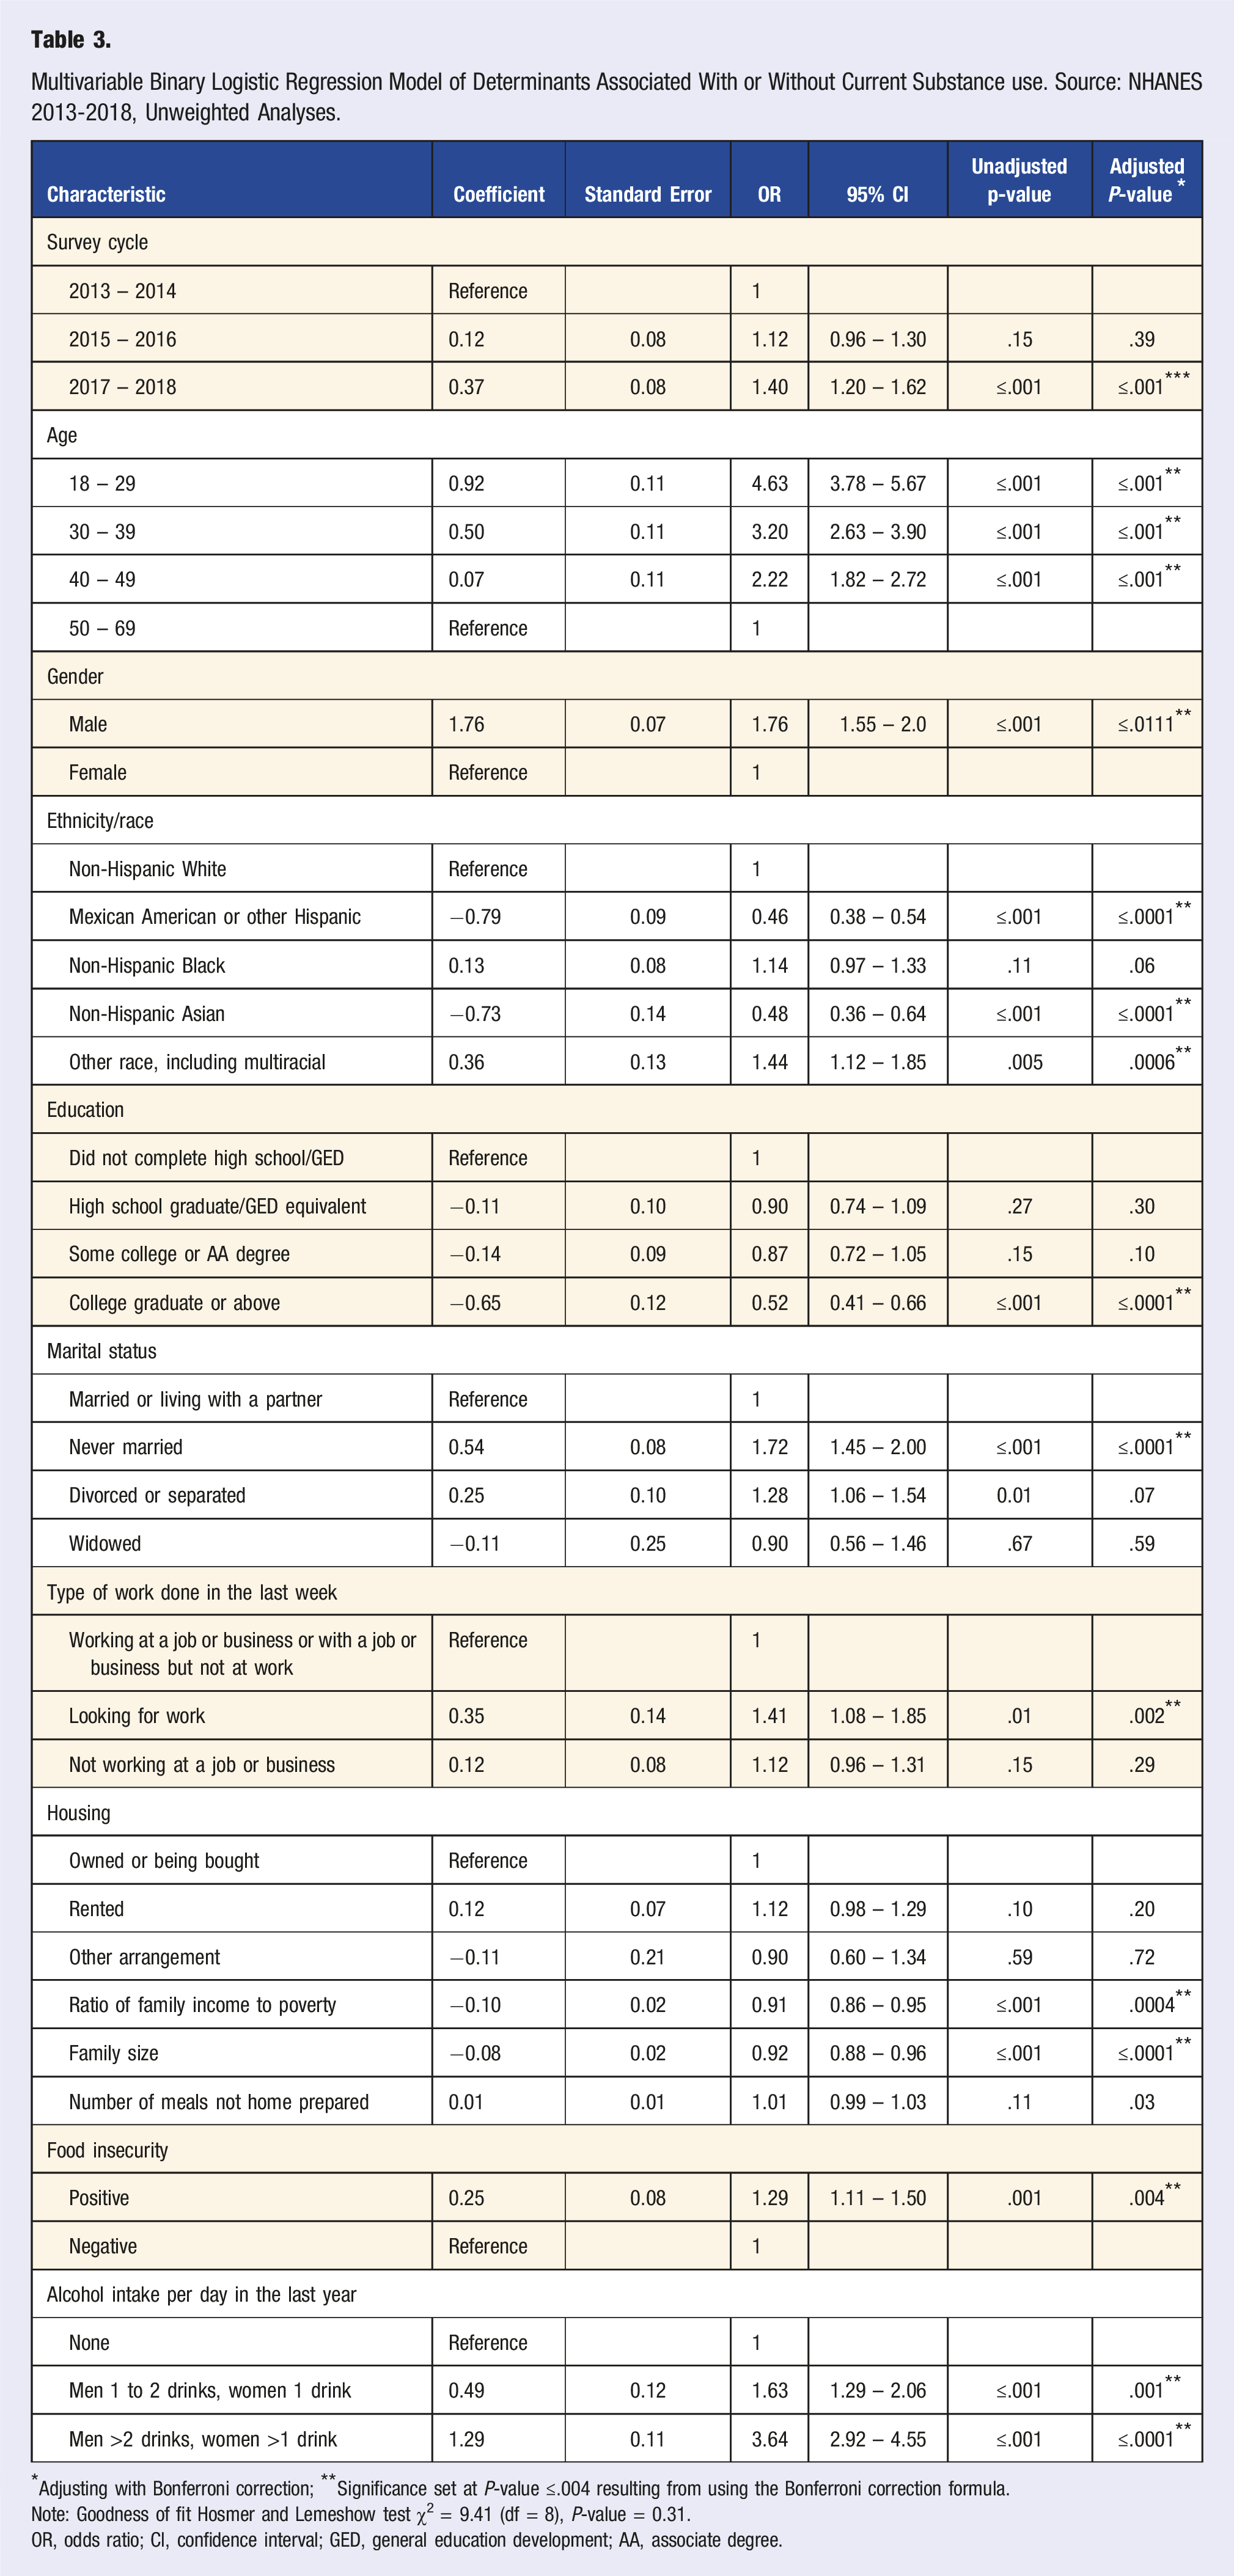
*Adjusting with Bonferroni correction; **Significance set at P-value ≤.004 resulting from using the Bonferroni correction formula.
Note: Goodness of fit Hosmer and Lemeshow test χ2 = 9.41 (df = 8), P-value = 0.31.
OR, odds ratio; CI, confidence interval; GED, general education development; AA, associate degree.
Regardless of the covariates measuring nutrition and behavior related preferences, food insecurity and alcohol intake per day during the last year were significantly associated with the study outcome. We observed participants reporting positive food insecurity were 29.0% more likely to report current substance use, (OR = 1.29, 95% CI = 1.11 – 1.50). Compared to participants who reported not drinking alcohol, men reporting 1 or 2 drinks and women reporting 1 drink per day, were 63.0% more likely to report current substance use, (OR = 1.63, 95% = 1.29 – 2.06). Compared also to the group not drinking alcohol, men who had more than 2 drinks and women who reported more than 1 drink per day, were more than 3 times likely to report current substance use, (OR = 3.64, 95% CI = 2.92 – 4.55). See Table 3. We tested two-way interactions focused on the covariates measuring nutrition and behavior related preferences, but none was significant.
Assuming all variables in the model stay at mean values, we conducted analysis of margins and calculated the predicted probabilities and 95% CI’s of current substance use by categories of age and daily alcohol consumption in the previous year. We found the highest probabilities (0.34) of current substance use in the younger group of participants (18 to 29 years) who reported daily consumption of alcohol in the previous year of more than 2 drinks (men) and more than 1 drink (women) than the probabilities (0.14) for the group of the same age who did not consumed alcohol, P-value ≤.001. See Figure 2. Predicted margins of current substance use by categories of daily alcohol consumption reported during the previous year and categories of age. Source: NHANES 2013-2018, unweighted analysis.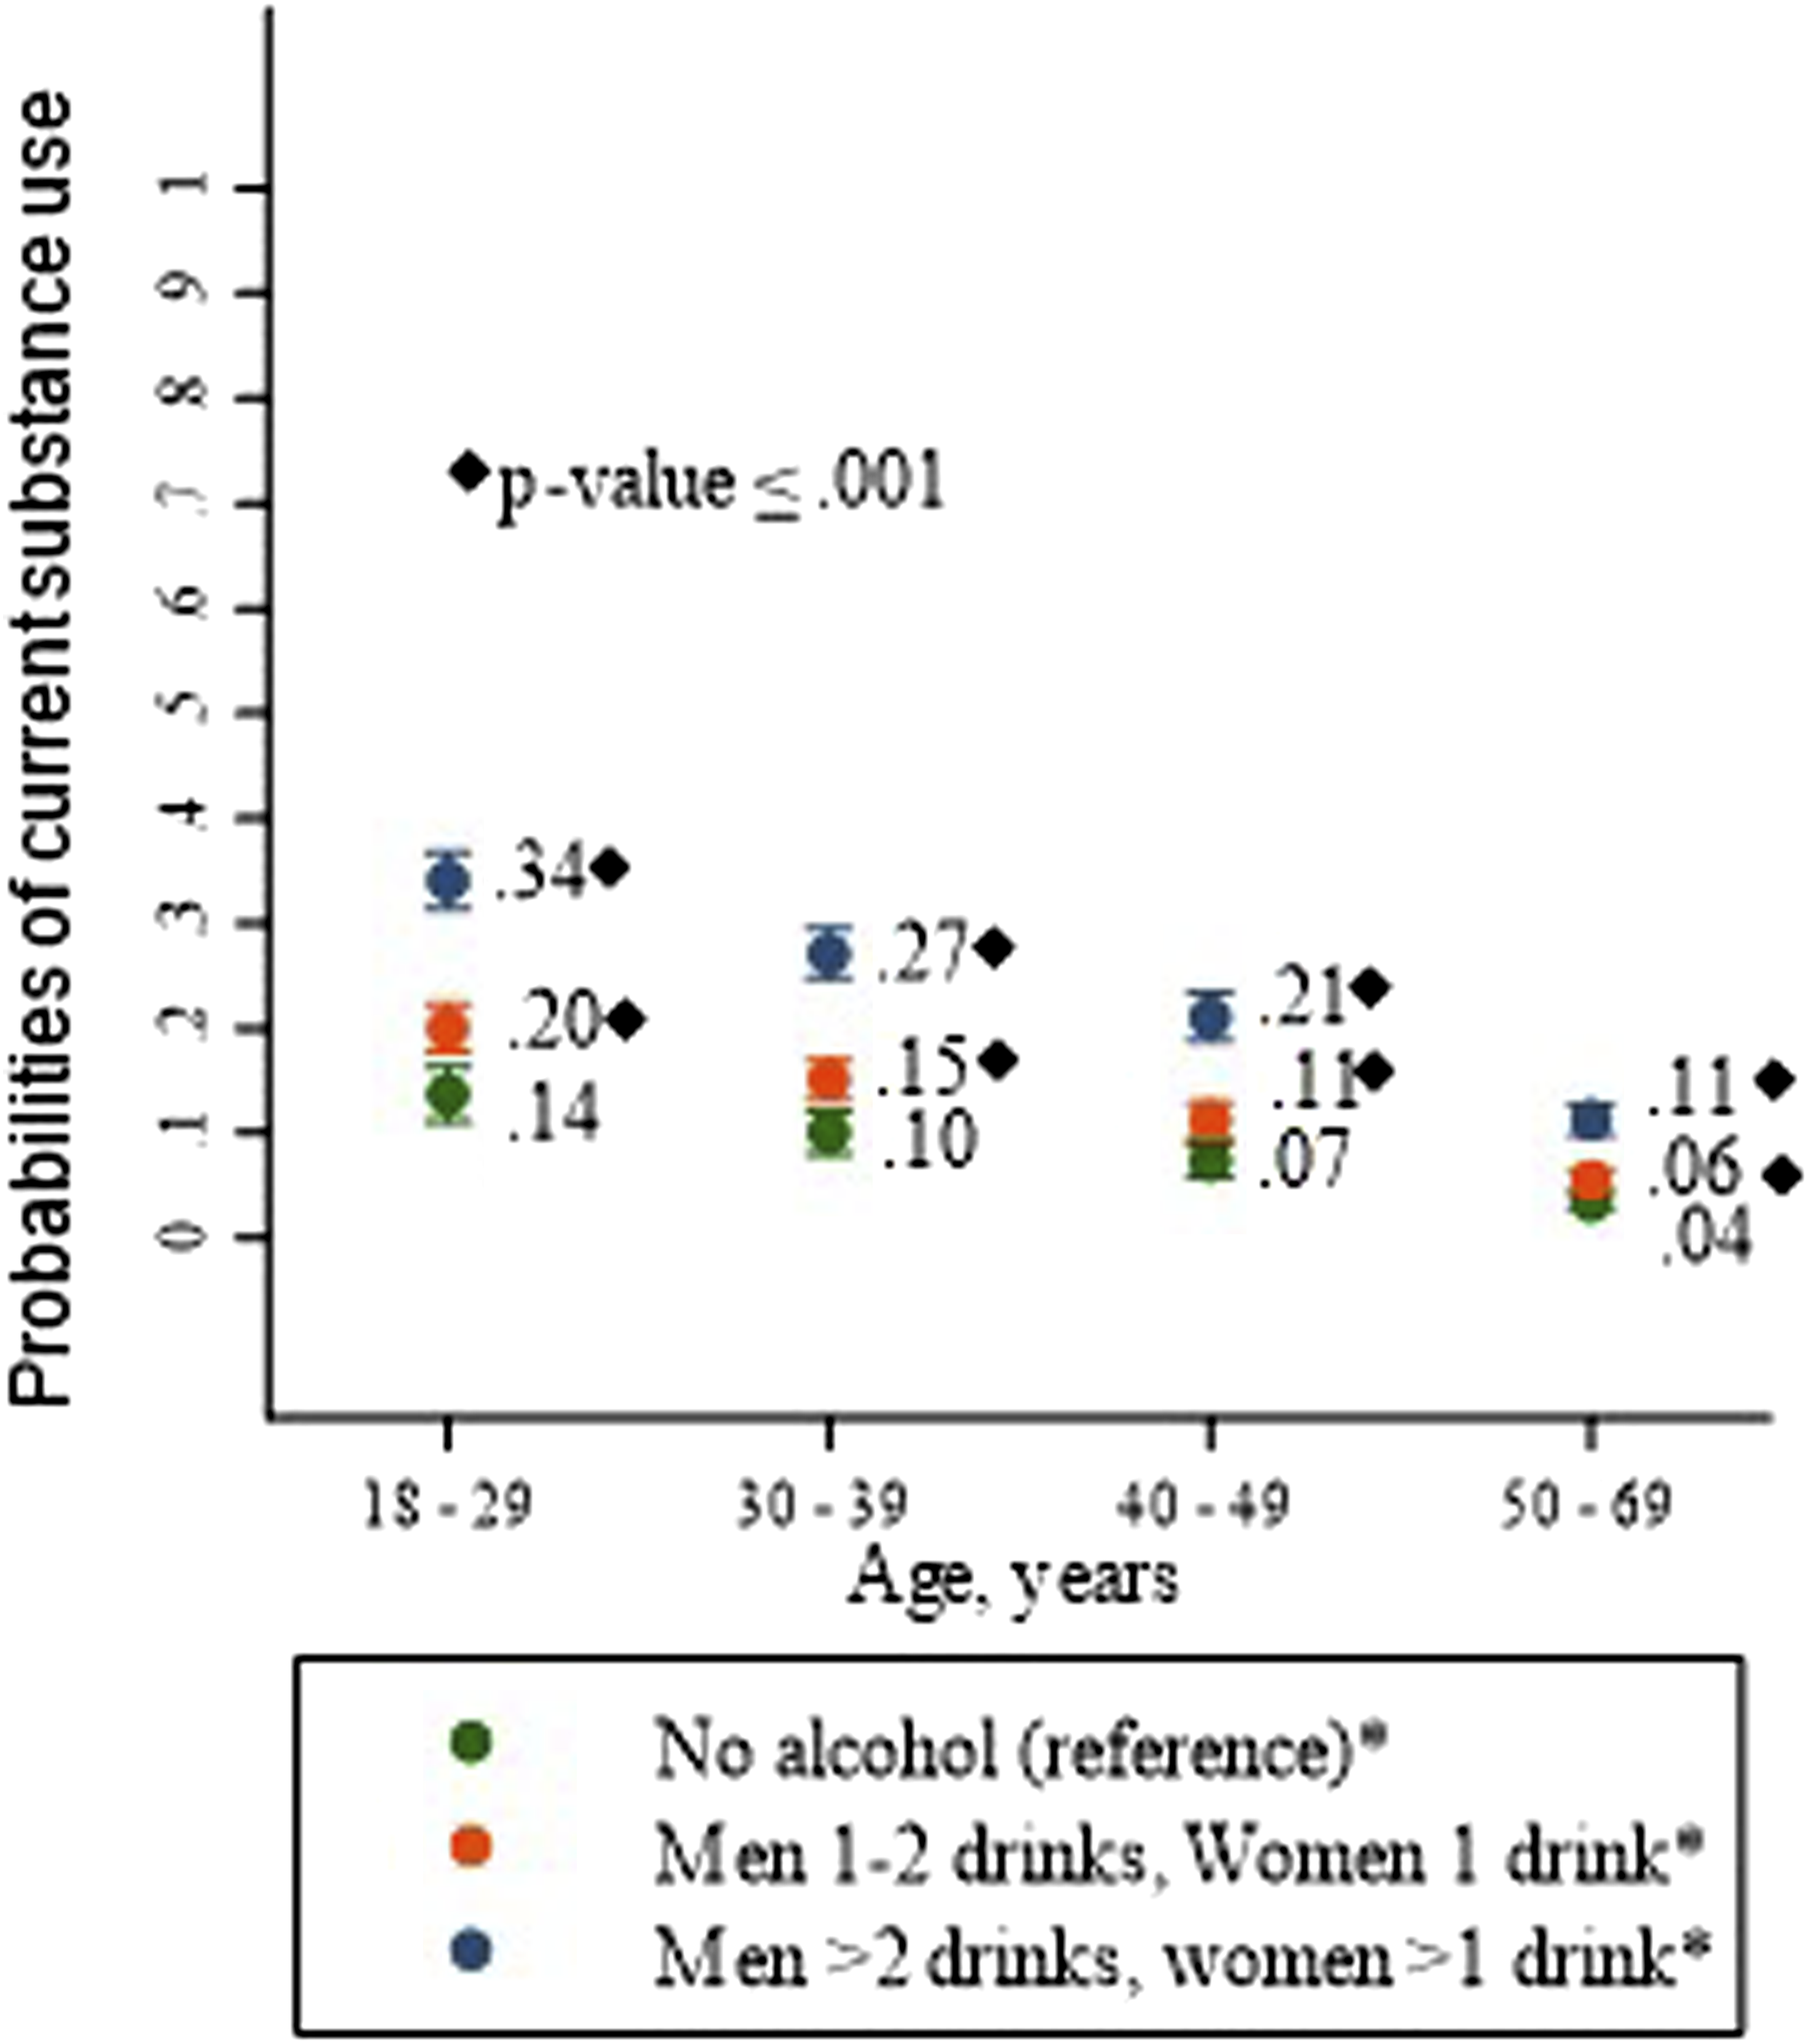
Discussion
This study assessed differences in dietary and consumer behaviors between individuals currently using substances and those not using substances utilizing NHANES data. We found the reported food insecurity and alcohol intake were independently associated with reporting current use of substances. Sociodemographic characteristics including age, gender, ethnicity/race, education, marital status, the type of work done the previous week, the ratio of family income to poverty, and the family size, were also independently associated with the study outcome.
Food insecurity has been associated with poorer diet quality and was more prevalent in the study sample of individuals currently using substances compared to individuals not using substances.43,44 Several qualitative studies have discussed the challenges of accessing healthy food for individuals with food insecurity.45-47 Some barriers included the cost of food, the availability of nutritious food in the neighborhood, and competing fast-food establishments.46,47 While food insecurity presents many challenges to healthy eating, there have been several successful interventions. A California food bank’s pilot program provided fresh fruits, vegetables, and protein sources along with education and healthcare referrals for individuals at risk for diabetes and found improved dietary intake using an adapted version of the Fresh Foods Survey. 48 In a similar population, those with food insecurity and a cardio-metabolic disease or micronutrition deficiency were enrolled in a fresh food prescription program, which at the end of the 12-week intervention demonstrated increased fruit and an increase of a diversity of vegetables not previously consumed or tried. 49 In developing dietary interventions for individuals using substances, it is essential to find ways to increase access to a variety of fresh foods. This may include partnering with local food banks or community businesses.
In addition to food insecurity, we found alcohol consumption was a differentiator. Midanik et al. found heavy alcohol use defined as 5 or more drinks in a day to be associated with drug use. 50 Alcohol is known to affect the absorption of critical nutrients and, similar to drug use, has been associated with malnutrition.13,51 The presence of both drug and alcohol use presents additional challenges and exacerbates poor nutritional health status. The combination of drug use, alcohol and poor dietary and consumer behaviors presents an opportunity for nutrition interventions from clinicians trained in motivational interviewing techniques. Motivational interviewing (MI) is a collaborative, patient-centric, and goal-oriented approach to counseling, and it has been shown to improve adherence and outcomes.52-54 MI has also been successfully used to address alcohol consumption and tobacco use. 55 Using MI, which emphasizes open-ended questions and skillful listening as opposed to a traditional lecture style, can target overall improved health in individuals in active use.
While using MI, it is important to consider sociodemographic barriers and enablers in designing nutritional interventions. Consistent with the literature, being male, younger and single have been associated with substance use.56,57 Individuals with smaller family sizes, which may correlate with being single, were more likely to report current use of substances. Given the higher proportion of renting and other living arrangements, active users may live with friends, roommates, or in recovery housing. As of 2020, there were 17 943 recovery homes in the United States. 58 These housing environments may require sharing a kitchen with others, adding a layer of complexity to the healthy eating process. Targeted interventions for this population should consider nutrition education and meal preparation options for younger, single participants or smaller family sizes to be impactful. Practical strategies for clinicians may include incorporating group sessions into SUD treatment programs that incorporate registered dietitians trained in metabolic dysregulation, micronutrient deficiency, healthy cooking options, and food insecurity. Treatment programs may consider partnerships with food banks and other community organizations that can offer this population low-cost options for nutritious meals.
Because substance use is associated with impulsivity and struggles to delay gratification. 59 And this, combined with dysregulated hunger cues, may make it harder for an individual in active use to plan or prepare a meal, thus turning to fast foods. We suspected a person using substances would consume more meals prepared away from home.12,60,61 While individuals currently using substances did consume more foods prepared away from home, it was not an independent predictor of substance use. Those currently using substances were of younger age and more likely to be male, 2 characteristics previously associated with meals prepared away from home. 60
Similar to meals prepared away from home, no differences between those currently using substances and those not using were observed regarding the ratio of money individuals spent on meal preparation vs eating out were found in the multivariate analysis. Individuals actively using substances are less likely to be employed and tend to have lower incomes, which may limit their financial ability to spend money on eating out. A study by Binkley and Liu examined dietary intake during 2 non-consecutive days and found that individuals with higher incomes and those working more hours were more likely to eat out. 62 Further supporting the impact of income, Wolfson et al 63 found that individuals with partial food security were more likely to cook meals at home.
In addition to purchasing and consumption patterns, this study explored differences in nutrition knowledge as nutrition education is associated with eating a balanced diet rich in whole foods, fruits, and vegetables.64-66 It was suspected that knowledge of MyPlate would be reduced for individuals in active use due to low exposure to this conceptual framework from educational settings; further, nutrition knowledge has been positively associated with education attainment and being female.67,68 However, the results showed an overall lack of understanding of MyPlate, and no significant differences were seen between groups. A Centers for Disease Control and Prevention report found that from 2017 to March 2020, only 25.3% of adults aged 20 and older were aware of MyPlate. 69 This highlights an opportunity for improvement in the roll out of government sponsored nutrition campaigns to increase reach. It is also possible that nutrition education is not a primary driver in the differences in nutritional status and that interventions for this population may need to focus on making healthy food more accessible, which can be challenging in a population with above-average levels of food insecurity.
Although this research identifies potential targets and considerations in designing dietary interventions for individuals using substances and those in recovery, there are limitations. First, the analysis only included marijuana and illicit drug use. Due to the limitations of the data, the misuse of prescription medication was not considered. The 2023 National Survey on Drug Use and Health estimates that 0.6% of U.S. adults misused psychotherapeutic prescriptions in the past month. 57 However, the study was able to obtain a robust sample by combining data from 3 survey cycles. Another limitation is the study’s cross-sectional study design which limits one’s ability to assess temporality and determine causation. Although, substance use may result in many of the conclusions found, it is also possible that the conclusions contributed to substance use. Regardless of directionality, factors such as food insecurity and housing status warrant consideration in the design of dietary interventions for individuals using substances. A third limitation of our study is that due to selection bias and self-reporting, the NHANES population sample may not be a true representation of the population and that individuals in active use who are struggling nutritionally may be underrepresented however, the obtained percent of individuals in active use was comparable to that found in the 2018 National Survey on Drug Use and Health. 70 Finally, although this study identified dietary behavior variables associated with substance use, it cannot determine if they impact outcomes such as nutritional status or substance use treatment and recovery. However, this study identified variables suitable for further exploration and possible future intervention targets.
Individuals currently using substances have higher rates of food insecurity and consume more alcohol. They are more likely to be male, younger, single, and have lower incomes. Additionally, they are less likely to have their own home and may be living with roommates or others, given the reported household sizes. Based on these findings, and the growing evidence for lifestyle interventions as adjunctive treatments to substance use disorder, teaching basic cooking techniques, cooking for 1, and cooking meals in advance for easy preparation may be essential. 71 If appropriate, it may be beneficial to encourage community meals. Sharing meals can have many benefits, including improved nutritional status and lower levels of depression. 72 Cooking at home may not always be available; thus, guiding low-cost, high-nutrient prepared foods is essential. It is vital to address the food insecurity of this population and assist clients in accessing resources. Research on dietary interventions for individuals with substance use is in its early stages, future work may eventually benefit from examining nutritional interventions by substance use type. 10
Footnotes
Author Contributions
Conceptualization—ASC, MCT, and TCL; Data curation—ASC; Formal analysis—MCT; Writing—original draft—ASC, and MCT; Writing—review and editing—AL, and TCL; Supervision—TCL. All authors read and approved the final manuscript.
Declaration of Conflicting Interests
The author(s) declared no potential conflicts of interest with respect to the research, authorship, and/or publication of this article.
Funding
The author(s) received no financial support for the research, authorship, and/or publication of this article.
Ethical Approval
This study utilized data from the National Health and Nutrition Examination Survey (NHANES), which is publicly available and conducted by the National Center for Health Statistics (NCHS). NHANES data collection protocols are approved by the NCHS Research Ethics Review Board, ensuring compliance with ethical standards for human subject research. All participants provided informed consent, and their confidentiality is protected by strict data handling procedures.
Informed Consent
Informed consent was obtained from all individual participants included in the study.
Data Availability Statement
The variable names and responses to questions from the Drug Use Questionnaire used to classify participants as currently using substances or not using substances,within the last 30 days. Source: NHANES cycles 2013 to 2018
*Available at the variable keyword search of the CDC/National Center for Health Statistics NHANES Search Variables (cdc.gov). **Calculated variable not available in the NHANES variable keyword search. DUQ, Drug use questionnaire.
Study Outcome: Individuals Currently Using Substances vs Individuals Not Using Substances during the Last 30 days
Variable name*
Questions
DUQ200
Have you ever, even once, used marijuana or hashish? (yes/no)
DUQ220Q
How long has it been since you last used marijuana or hashish? (Number)
DUQ220U
How long has it been since you last used marijuana or hashish? (Units: days, weeks, months, years)
DUQ220D**
Calculated variable: If DUQ200 answer is yes, the number of days since you last used marijuana or hashish by using variables DUQ220U and DUQ220Q
DUQ240
Have you ever used cocaine, crack cocaine, heroin, or methamphetamine? (yes/no)
DUQ250
Have you ever, even once, used cocaine, in any form? (yes/no)
DUQ270Q
How long has it been since you last used cocaine, in any form? (Number)
DUQ270U
How long has it been since you last used cocaine, in any form? (Units: days, weeks, months, years)
DUQ250D**
Calculated variable: If DUQ240 answer is yes and DUQ250 is yes, the number of days since you last used cocaine in any form by using variables DUQ270U and DUQ270Q
DUQ290
Have you ever, even once, used heroin? (yes/no)
DUQ310Q
How long has it been since you last used heroin? (Number)
DUQ310U
How long has it been since you last used heroin? (Units: days, weeks, months, years)
DUQ290D**
Calculated variable: If DUQ240 answer is yes and DUQ290 is yes, the number of days since you last used heroin in any form by using variables DUQ310U and DUQ310Q
DUQ330
Have you ever, even once, used methamphetamine? (yes/no)
DUQ350Q
How long has it been since you last used methamphetamine? (Number)
DUQ350U
How long has it been since you last used methamphetamine? (Units: days, weeks, months, years)
DUQ330D**
Calculated variable: If DUQ240 answer is yes and DUQ330 is yes, the number of days since you last used heroin in any form by using variables DUQ350U and DUQ350U
DUQ370
Have you ever, even once, used a needle to inject a drug not prescribed by a doctor? (yes/no)
DUQ400Q
How long ago has it been since you last used a needle to inject a drug not prescribed by a doctor? (Number)
DUQ400U
How long ago has it been since you last used a needle to inject a drug not prescribed by a doctor? (Units: days, weeks, months, years)
DUQ370D**
Calculated variable: If DUQ240 answer is yes and DUQ370 is yes, the number of days since you last used heroin in any form by using variables DUQ400U AND DUQ400Q
Individuals currently using substances
Answer yes to any variable DUQ200, DUQ240, DUQ250, DUQ290, DUQ330, or DUQ370 and ≤30 days since last use in any variable DUQ220D*, DUQ250D*, DUQ290D*, DUQ330D*, or DUQ370D*
Individuals not using substances
Answer no to all variables DUQ200, DUQ240, DUQ250, DUQ290, DUQ330, or DUQ370 or answer yes to any variable DUQ200, DUQ240, DUQ250, DUQ290, DUQ330, and >30 days since last use in any variable DUQ220D, DUQ250D, DUQ290D, DUQ330D, or DUQ370D