
Abstract
Objective: Present study explored the influence of self-reported health on diff between observable and unobservable health factors. Method: Data obtained through the 2017-2020 pre-pandemic dataset of the National Health and Nutrition Examination Survey (NHANES). A series of analyses of covariance were conducted with self-reported health as the independent variable, and measures of blood pressure, waist-to-hip ratio, fasting glucose and total cholesterol as dependent variables. Family income served as a covariate. Results: Results revealed significant differences in self-reported health and blood pressure, waist-to-hip ratio, and fasting glucose. Individuals who rated their health excellent or very good tended to have better health numbers than those who rated their health as fair or poor. No statistically significant difference was found with self-reported health and cholesterol. Conclusion: It is possible that health numbers that can be observed (or assessed) at home, without a health care professional, may be more aligned with how individuals perceive their own health. Health care professionals may want to further help patients recognize their own health status. The use of wearable technologies may provide added health information resulting in more accurate perception of health. A more accurate perception of a patient’s own health may aid health care professionals in further improving patient care.
Keywords
Introduction
Most everyone has a view (i.e., perception) about themselves relative to physical, mental, and emotional characteristics. These perceptions of ourselves and the world around us can influence our thoughts and actions. An accurate perception can lead to appropriate behaviors, while an inaccurate perception can lead to inappropriate behaviors. For example, an individual who is obese, but does not perceive themselves as overweight, may not be amenable to a physician’s recommendation to lose weight. A better understanding of the factors that are aligned with self-perceptions, can be of value to a physician’s ability to optimize patient care.
Assessing a patient’s perceived health status is a method for predicting mortality risk. 1 It can provide insight into a patient’s physical well-being, and aid in assessing their objective health status.1,2 Perceived health can be measured by asking patients to rate their health on a scale from excellent to poor.3,4 Researchers have explored the influence of self-reported health on health factors such as body measures, 5 oral health, 4 chronic illnesses, 6 psychological distress, 7 depression, 8 and diabetes. 9 In a study of 2058 cardiac arrest survivors, researchers explored the difference in self-reported health between cardiac survivors with good cerebral performance, and survivors with moderate cerebral performance. 10 Results revealed survivors with moderate cerebral performance self-reported poorer health than those with good cerebral performance.
Interestingly, research in perception of health, tends to focus on the association between self-reported health and observable or measurable health numbers.4-6 Specifically, health numbers that the patient can see, such as weight, feel such as depression, or measure on their own such as blood pressure and glucose. Could there be differences in self-reported health between observable health numbers and unobservable health numbers? To investigate this question, we selected a set of health numbers that are often grouped as a collective measure of health. The American Heart Association, 11 and the Heart, Lung, and Blood Institute, 12 highlight the need to know four health numbers: blood pressure, body measures (i.e., waist and hip circumference), fasting glucose, and total cholesterol. Three of these numbers can be self-observed or easily self-assessed by the patient. They include blood pressure, body measures, and fasting glucose. Conversely, to assess cholesterol, the patient generally needs the assistance of a clinic and/or lab. While cholesterol home tests are available, their use is not common. 13
Observable Health Numbers
Blood pressure is measured manually or by an automated digital monitor. The measurement can be done in a clinical setting or at home using a validated device. Regular home monitoring allows for a more accurate and comprehensive understanding of a patient’s blood pressure, aiding in better management and control of hypertension and reducing the risk of complications.
Measurement of height and weight has long been used to assess adiposity. Body Mass Index (BMI) has been the classical measure. BMI is a calculation that uses a person’s weight and height to estimate body fat. Recently, alternative measurements such as waist-to-hip ratio (WHR) have come into favor as a more accurate measure of central adiposity, which is the fat stored around the abdomen. 14 For WHR, the waist circumference is divided by hip circumference. Assessment of WHR can be done at home using a measuring tape, and an online calculation tool.
Blood glucose is monitored with 2 primary measurements: serum blood glucose and glycated hemoglobin (A1c). At home, individuals can check their fasting and non-fasting serum glucose using pinprick glucometers, which require a drop of blood to provide an instant reading. Additionally, continuous glucose monitors (CGMs) are wearable medical devices that provide real-time continuous monitoring of blood sugar levels to a mobile device. The use of CGMs is increasing as their value in diabetes management becomes better understood. 15
Unobservable Health Number
A lipid panel consists of measurements of high-density lipoprotein (HDL), low-density lipoprotein (LDL), triglycerides, and total cholesterol. Lipids are routinely monitored during general health screenings as an additional measure of cardiovascular health and an aid to determining cardiovascular disease (CVD) event risk. While home cholesterol kits exist, 16 they are not commonly used. 13
Research Questions
The present study investigated 2 research questions: 1) What is the influence of self-reported health and the four health numbers being, blood pressure, waist-to-hip ratio (WHR), fasting glucose, and cholesterol? 2) How does self-reported health differ between observable (blood pressure, waist-to-hip ratio, fasting glucose) and the unobservable health number of cholesterol, while including ratio of family income to poverty level as a covariate?
Method
Data were obtained through the 2017- March 2020 pre-pandemic dataset of the National Health and Nutrition Examination Survey. 17 The NHANES program was designed to assess the health status of adults and children in the United States. NHANES is a program of the National Center for Health Statistics (NCHS), which is part of the Centers for Disease Control and Prevention. 18 The survey includes questionnaire data, dietary, physical examination, and laboratory data. Initial interviews are completed in the participant’s home, while physical examination and laboratory data are obtained during a Mobil Examination Center (MEC) visit by trained medical staff. Each participant receives compensation and medical outcome reporting.
The data is made publicly available and organized in data files by year. Each annual data file is separated into several datasets. The present study exported the following datasets (with associated NHANES dataset name): a demographics dataset (P_DEMO_Data), which includes information such as age, gender (Female / Male), race (Mexican-American, Other Hispanic, Non-Hispanic White, Non-Hispanic Black, Other Race—Including Multi-Racial), and ratio of family income to poverty level. A dataset containing blood pressure (P_BPXO_Data), which includes 3 blood pressure measurements with 1 minute of rest between measurements. The dataset with body measures (P_BMX_Data), includes height, weight, waist, and hip circumference. Total cholesterol (P_TCHOL_Data), and fasting glucose (P_GLU_Data), were obtained from separate datasets. Finally, self-reported general health condition (P_HSQ_Data) was collected. For this item, interviewers asked the following question, “I have some general questions about your health. Would you say your health in general is.” Response options included: Excellent, Very Good, Good, Fair, or Poor.
The datasets were individually downloaded from the NHANES website (CDC website) in a .XPT format. The files were then converted to .SAV files using the Statistical Package for the Social Sciences (SPSS) version 29.0.2.0. Following conversion, the datasets were merged into a single SPSS file for analysis. Within SPSS, variables were appropriately labeled, values were coded, and each variable’s scale of measurement was designated as nominal, ordinal, or scale. Since the dataset was very large with over 10 000 participants, observations with missing values pertinent to the variables of interest were excluded from the final analysis.
The dataset prior to excluding outliers included 15 560 participants with an age range from 2 months to a capped age category of 80 years. For the purpose of the present study, we removed all participants under the age of 18 years, but also participants who did not report age. This resulted in a sample of 9697 participants (4977 females, 4720 males). The average age of the participants was 49.59 (SD = 18.61). A total of 1131 participants self-reported as Mexican-American, 991 as Other Hispanic, 1172 as Non-Hispanic Asian, 2559 as Non-Hispanic Black, 3370 as Non-Hispanic White, and 474 as Other Race—Including Multi-Racial. Finally, average ratio of family income to poverty was 2.57 (SD = 1.63).
Statistical Analysis
To explore the unique contribution of self-reported general health on the four health numbers, while considering ratio of family income to poverty, a series of analyses of covariance (ANCOVAs) were conducted. For all ANCOVA’s the independent variable was self-reported general health with 5 response options: Excellent, Very Good, Good, Fair, and Poor. The dependent variables that were entered into individual models included systolic blood pressure, diastolic blood pressure, waist-to-hip ratio, fasting glucose, and cholesterol. Since factors such as age, income, and education may play a role in health condition, a covariate was included in the model. The covariate was ratio of family income to poverty level, which ranged from 0 to 5.0. Scores below 1 represented income below the poverty level, while scores above 1 represented income above the poverty level. The ratio was not computed for responders who reported income as a category of < $20,000 or ≥ $20,000. Additional variables such as education level were not included as covariates due to risk of multicollinearity between income and education. That is, since education and income tend to be highly correlated, the inclusion of both variables could result in less reliable statistical inferences.
Since the NHANES examination includes the collection of 3 measurements of blood pressure, we used an average of the 3 measurements to serve as our measure of systolic and diastolic blood pressure. To document WHR, we divided waist circumference by hip circumference. Since interpretation of WHR is based on sex, we conducted separate analyses for females and males for WHR only. The fasting glucose and total cholesterol variables were exported from the laboratory data.
To investigate the significance and magnitude of the results, we considered both p-value and effect size. Since the p-value is sensitive to methodological factors such as a large sample size, 19 we used a p-value of .005 as an indicator of statistical significance. This value was based on the recommendation of a consortium of researchers to change the default p-value threshold for statistical significance from .05 to .005. 20 Further, since the American Psychological Association 21 and the International Committee of Medical Journal Editors 22 recommend the avoidance of using the p-value as the single determinant for statistical testing, we also considered an indice of effect size (η2 – pronounced eta-squared).
Results
During the design of the study, four assumptions were documented, 1) the dependent variables were continuous, 2) the independent variable was categorical, 3) the covariate was continuous, and 4) there was independence of observations. Prior to analysis, 3 assumptions were explored to determine if the data fits the ANCOVA model. These assumptions included, 1) assessment of outliers in the groups of the independent variables in terms of the dependent variable, 2) the covariate should be linearly related to the dependent variable at each level of the independent variable, and 3) there should be homogeneity of regression slopes.
Results revealed several outliers as defined as scores being greater than 3 box-lengths from the edge of the box in a boxplot. A total of 92 scores for systolic blood pressure, 62 scores for diastolic blood pressure, six scores for glucose, and 80 scores for total cholesterol were removed from the dataset. There were no outliers for waist-to-hip ratio.
Descriptive Statistics.
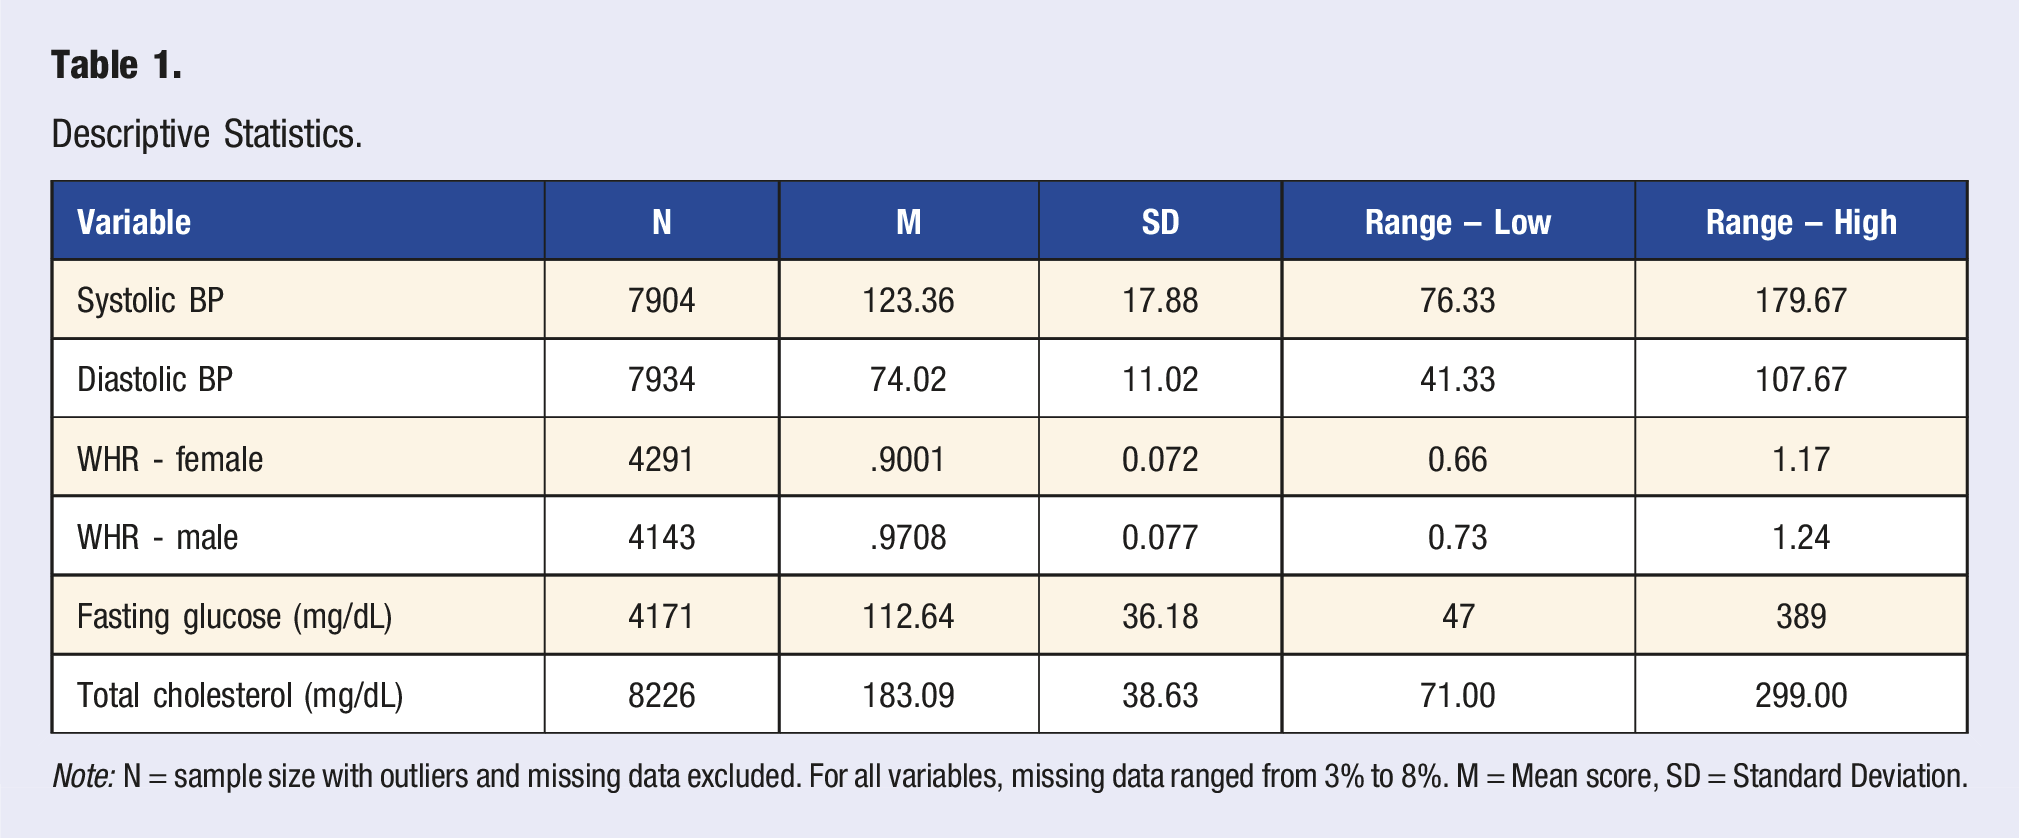
Note: N = sample size with outliers and missing data excluded. For all variables, missing data ranged from 3% to 8%. M = Mean score, SD = Standard Deviation.
The next assumption, covariate should be linearly related to the dependent variable at each level of the independent variable, was assessed by scatterplots. There was a linear relationship for each dependent variable and each category of the independent variable being general health condition, as assessed by visual inspection of a scatterplot. The final assumption consider was there should be homogeneity of regression slopes. This assumption checks that there is no interaction between the covariate, ratio to family income to poverty level, and responses to general health condition. Results revealed the assumption was met for all variables except total cholesterol. However, we continued with the analysis as ANCOVA is fairly robust to minor deviations to regression slopes. 23
ANCOVA Results With Ratio of Family Income to Poverty as Covariate.
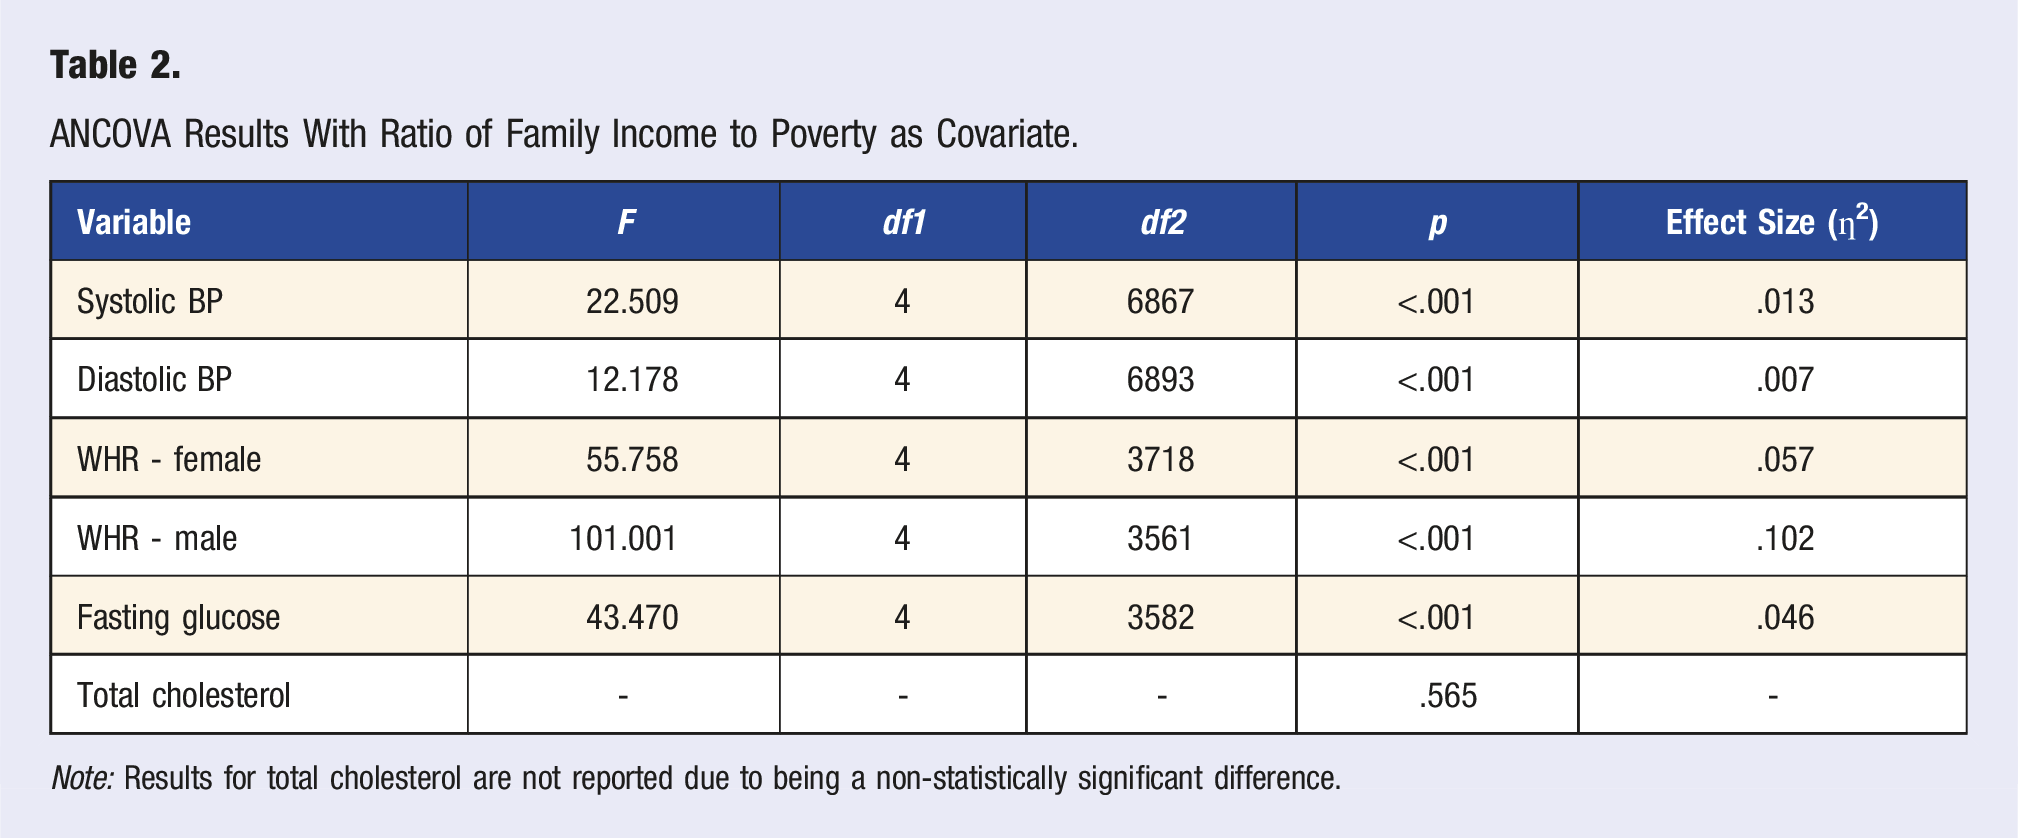
Note: Results for total cholesterol are not reported due to being a non-statistically significant difference.
Post-hoc analysis using Bonferroni method found statistically significant differences (p < .05), and non-statistically differences between self-reported general health and some of the health numbers. As illustrated in Figure 1, non-significant differences (p > .05) are stated while remaining comparisons were statistically significantly different (p < .05). Since total cholesterol was non-significant, post-hoc results were not reported. Self-reported general health condition and the four health numbers.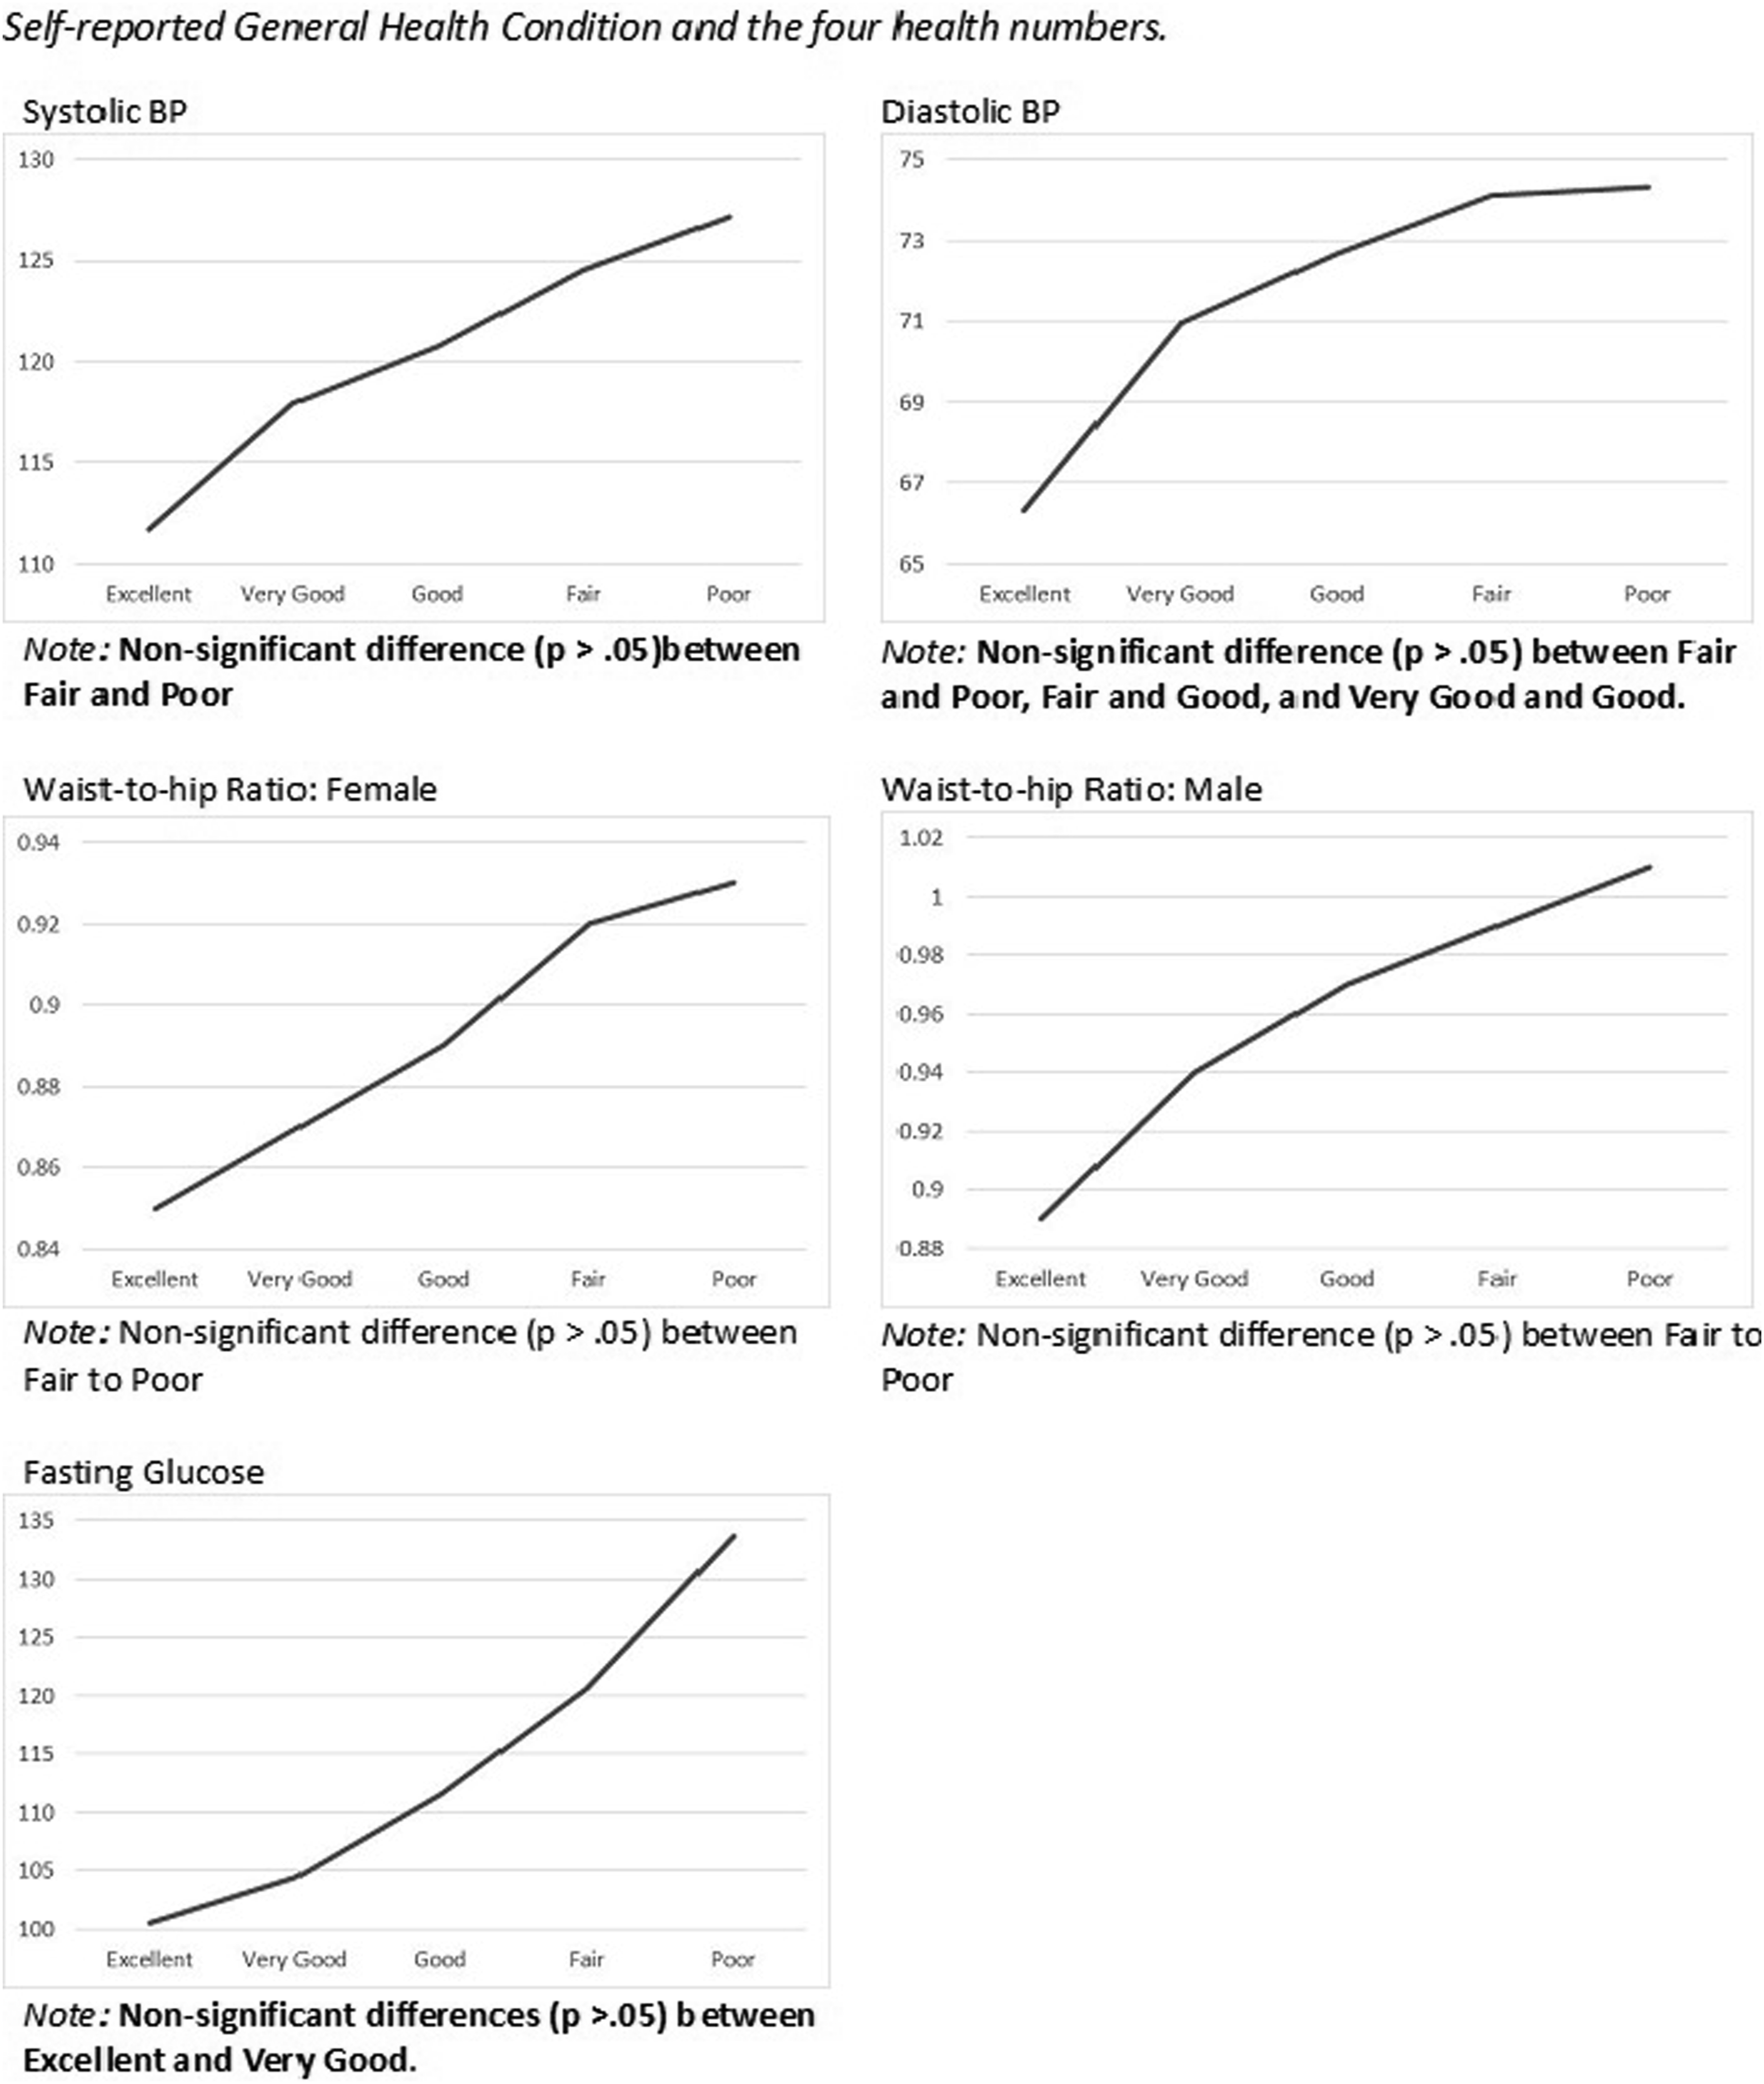
Discussion
Using a large publicly available database (NHANES), 17 the present study explored the influence of self-reported general health on the four health numbers being, blood pressure, waist-to-hip ratio (WHR), fasting glucose, and total cholesterol. Results revealed a linear relationship between self-reported general health condition and blood pressure, waist-to-hip ratio, and fasting glucose, Individuals who rated their health as excellent or very good, tended to have better health numbers than those who rated their health as fair or poor. In addition the magnitude of the effect ranged from small (ƞ2 = .007) to medium (ƞ2 = .102).24,25 Interestingly, there was no association between self-reported general health and total cholesterol.
Relative to the first research question, what is the influence of self-reported general health and the four health numbers being, blood pressure, waist-to-hip ratio (WHR), fasting glucose, and cholesterol, there were noteworthy results. While fasting glucose levels increased as participants self-reported poorer health, the mean level for fasting glucose was 112.64 mg/dL. Further review of the data revealed 42.1% (N = 1756) of the sample had fasting glucose levels below 100 mg/dL. From the sample of individuals with fasting glucose levels below 100 mg/dL, a total of 74.4% (N = 1587) self-reported their health as either excellent, very good, or good.
Pertaining to waist-to-hip ratio (WHR) in the female group, all the participants scored in the high health risk category, that being a WHR greater than .86. For males, those who self-reported their health as excellent, were in the low-risk category (<.95). Those who self-reported their health as very good, good or fair, had WHRs at the moderate risk level (.96 to 1.0), while those who self-reported poor health, had WHRs at the high-risk level (>1.0).
Systolic and diastolic blood pressure (BP) both appeared to follow expected results. That is, as participants self-reported poorer health, systolic and diastolic BP increased. Finally, of noteworthy interest was the results for cholesterol. While the average score for cholesterol was 183.09 mg/dL, there was no statistical difference in cholesterol levels and self-reported general health condition.
Relative to the second research question, how does self-reported health differ between observable (blood pressure, waist-to-hip ratio, fasting glucose) and the unobservable health number of cholesterol, while including ratio of family income to poverty level as a covariate, results revealed significant difference for observable and non-significant differences for the unobservable health numbers. Specifically, participants who rated their health more positively, tended to have better health numbers (blood pressure, fasting glucose, WHR) than those who rated their health as more negative. Interestingly, this trend was not found for total cholesterol. That is, the participants rating of their general health, did not associate with cholesterol levels. As an additional investigation, we conducted analyses to explore if general health condition would influence LDL cholesterol and HDL cholesterol. Similar to total cholesterol, there were no statistically significant differences between general health condition and LDL or HDL cholesterol (p > .05).
Why would there be differences between these health numbers? A potential reason may be linked to the patient’s ability to assess their own health numbers. The health numbers of blood pressure, fasting glucose, and WHR can be assessed by individuals on their own, in the home. Easy-to-use blood pressure monitors, weight scales, measuring tapes, and home glucose monitors are readily available online and at local retailers. Obtaining a measurement of cholesterol typically requires a blood analysis at a clinic or laboratory. While cholesterol home tests are available, their use is not common. 13 In addition, while certain factors exist such as cognitive dissonance, it may be that self-perception requires at least a degree of knowledge of health numbers.
The present study provides evidence that observable, and/or measurable (e.g., blood pressure), health numbers appear to be more aligned with self-reported general health than unobservable (i.e., cholesterol) health numbers. This may suggest that self-reported health is fundamentally based on factors that the individual can see, feel, and/or readily assess. This is an interesting finding as an accurate perception of one’s health is an important factor in maintaining one’s health. Self-perception is a psychological concept that involves a person’s view of their own mental or physical attributes that constitute the self. 26
There is evidence as to the value of accurate self-perception and the desire to maintain or change thoughts, feelings, or actions.27-29 In a study of 507 adolescents, health perceptions had a positive effect on sports participation. 27 In another study, researchers found that individuals who recognize their own weight status as overweight or obese tend to seek help more than those who do not recognize their weight status as overweight or obese. 29 Indeed, our self-perceptions often drive our actions to maintain or improve our physical, mental, and emotional health. Health care professionals may want to further help patients recognize their own health status. Further, based on the findings of the present study, it may be of value for health care professionals to encourage the use of wearable technologies that can provide personal health data.
Strengths and Limitations
There are strengths and limitations of the present study. A strength of the study is the large sample size. The NHANES data collection process includes collection of data from multiple cities throughout the United States. Another strength of the study is in the consistency of the questions and laboratory data collected. The survey script for NHANES is read verbatim to every participant. In addition, lab work is performed on site in the NHANES Mobile Examination Center. A limitation of the study is that medications taken by the participants were not considered in the data analysis. Further, NHANES does not include information relative to participants frequency of assessing blood pressure, glucose or weight.
There are theoretical and practical implications of the present study. Theoretically, researchers could explore perceived health and the frequency of practices such as taking one’s blood pressure or glucose level. Researchers could also create surveys to explore how health practices such as taking blood pressure and assessing weight are associated with health numbers. It is possible that the frequency of assessing one’s own health mediates an association between perception of health and real health. Practically, clinicians and medical device developers could develop more at home testing instruments that individuals can use to assess more health indicators.
Conclusion
The present study explored the influence of self-reported general health and the four health numbers being; blood pressure, waist-to-hip ratio (WHR), fasting glucose and cholesterol, while including ratio of family income to poverty as a covariate. Results revealed significant differences in self-reported general health condition and observable health numbers of blood pressure, waist-to-hip ratio, and fasting glucose. Specifically, individuals who rated their health excellent or very good tended to have better health numbers (e.g., lower blood pressure) than those who rated their health as fair or poor. Interestingly, there was no statistically significant difference in self-reported general health condition and total cholesterol. It is possible that health numbers that can be observed (or assessed) at home, without the need for a health care professional, may be more aligned with how individuals perceive their own health. Health care professionals may want to further help patients recognize their own health status. Further, the use of wearable technologies may provide added health information resulting in a more accurate perception of health. Indeed, a more accurate perception of one’s own health, may aid health care professionals in the quest of further improving patient care.
Footnotes
Declaration of Conflicting Interests
The author(s) declared no potential conflicts of interest with respect to the research, authorship, and/or publication of this article.
Funding
The author(s) received no financial support for the research, authorship, and/or publication of this article.