
Abstract
“Our findings convincingly demonstrate the link between unhealthy lifestyle behaviors, cardiometabolic/cancer diagnoses and arthritis.”
Health indices vary widely within the United States (U.S.), with clear “belts and epicenters” where the prevalence of unhealthy lifestyle behaviors, chronic disease, and disability are all high and follow strikingly similar spatial patterns that correspond to specific U.S. culture regions.1-3 This evidence suggests the U.S. is in the midst of a synergistic unhealthy lifestyle—chronic disease—disability crisis. Certainly, one of the common entry points to this poor health trajectory is chronic unhealthy lifestyle behaviors, such as a sedentary lifestyle and poor nutrition, significantly increase the risk for obesity and lead to other adverse health outcomes. 4 These include increased risk of acquiring a chronic disease and disabilities. Moreover, we have explored the potential drivers of observed regional patterns of poor health in the U.S. and identified social vulnerability, community safety, political ideology, and unique cultural influences as conceptualized through the American Nations model.1,5-8 Collectively, the health crisis centered on the synergies amongst unhealthy lifestyle behaviors, chronic disease, and disability, along with key potential driving factors, meets the definition of a syndemic: “two or more health conditions or diseases that cluster by person, place or time which adversely interact with and negatively affect the outcomes of one another.” 9
In this context, the geographical patterns of arthritis prevalence have not been previously explored. According to the Centers of Disease Control and Prevention (CDC), it is estimated 53.2 million adults in the U.S. (≈21.2%) have been diagnosed by a doctor as having some form of arthritis, rheumatoid arthritis, gout, lupus, or fibromyalgia. 10 Arthritis is considered a significant public health burden, occurring in approximately 21% of U.S. adults and accounting for ∼21% of years lived with disability. 11 Moreover, the federal government’s Healthy People 2030 objectives include reducing the “proportion of adults with arthritis who have moderate or severe joint pain” from the current level of 55.3% to a target of 52.1%. 12 Achieving this goal will require better understanding of the interrelated patterns of arthritis, unhealthy lifestyle behaviors, chronic disease, disability, and their potential drivers. For example, obesity is known to be one of the leading risk factors for knee osteoarthritis, likely related to inflammation. 13 Previous work also indicates racial disparities in arthritis pain and function (higher in African-American patients) that appear to be significantly influenced by excess body weight and depressive symptoms. 14 In turn, arthritis, once diagnosed, appears to be a significant risk factor for developing chronic disease. 15 From a broader perspective, the prevalence of arthritis globally further highlights the significance of this condition. The Global Burden of Disease Study reported 595 million individuals were diagnosed with osteoarthritis in 2020, equating to 7.6% of the global population and a 132.2% increase in cases compared to 1990. 16 In this current study, we hypothesize the prevalence and patterns of arthritis in the U.S. mirror other leading health issues in the U.S., further substantiating our assertion that we are experiencing a syndemic warranting urgent attention.
Materials and Methods
Study Design
Descriptive, cross-sectional, retrospective analysis.
Arthritis Data Source
2021 county-level, age-adjusted arthritis prevalence data was obtained from the 2023 CDC PLACES database. 17 These PLACES data were generated by the Behavioral Risk Factor Surveillance System survey. 18 The question asked for arthritis was: “Respondents aged ≥18 years who report having been told by a doctor, nurse, or other health professional that they had arthritis.” 19
Disability and Depression Data Source
2021 county-level, age-adjusted depression and disability (i.e., any disability among adults aged ≥18 years) was obtained from the 2023 CDC PLACES database. 17 These PLACES data were generated by the Behavioral Risk Factor Surveillance System survey. 18 The question asked for depression and disability were as follows: (1) Disability: “Respondents aged ≥18 years who answered ‘yes’ to at least one of six disability questions below: (a) Are you deaf or do you have serious difficulty hearing? (b) Are you blind or do you have serious difficulty seeing, even when wearing glasses? (c) Because of a physical, mental, or emotional condition, do you have serious difficulty concentrating, remembering, or making decisions? (d) Do you have serious difficulty walking or climbing stairs? (e) Do you have difficulty dressing or bathing? and (f) Because of a physical, mental, or emotional condition, do you have difficulty doing errands alone such as visiting a doctor´s office or shopping?” 20 ; and (2) Depression: “Respondents aged ≥18 years who report having been told by a doctor, nurse, or other health professional that they had depressive disorder.” 19
Lifestyle Health Index Data Source and Calculation
2021 county-level, age-adjusted risk behaviors, health outcomes and health status prevalence data from the 2023 CDC PLACES database. 17 These PLACES data were generated by the Behavioral Risk Factor Surveillance System survey. 18 The method of calculation for the Lifestyle Health Index (LHI) is as follows:
Sum of county level prevalence for: [
The overall LHI score as well as Risk Behavior, Health Outcome and Health Status sub scores were all calculated for analysis in the current study. For the LHI overall and sub scores: (1) Percentage prevalence is in decimal form (i.e., X/100) for each measure in sum score; (2) All prevalence values are age-adjusted for adults ≥18 years of age. Hence, LHI scores may range between 0 (ideal health – 0% prevalence for all LHI measures) and 15 (poorest health – 100% prevalence for all LHI measures). For the LHI, lower scores represent better health.
Social Vulnerability
The 2020 CDC/Agency for Toxic Substances and Disease Registry (ATSDR) Social Vulnerability Index database provides overall and subtheme SVI scores. 22 It seeks to capture the potential negative effects on communities due to external health stressors using 16 U.S. census variables. There are 4 social vulnerability index subthemes, and each is calculated as the sum of decimal percentages (0 – 1.0) for each constituent variable. Overall, the social vulnerability index is the sum of the four subthemes and higher scores indicate greater social vulnerability. Data used to calculate the 2020 CDC/ATSDR SVI were derived from 5-year (2016-2020) of data collected as part of the American Community Survey. 23
Regional Cultures
The American Nations regional cultures model was obtained from the Nationhood Lab.
24
A brief description of the American Nations model is as follows: Cultural geographers have long recognized First Settler effects on the characteristics of national cultures, with Wilbur Zelinsky’s “Doctrine of First Effective Settlement”
25
arguing that “the dominant culture of a given nation is determined by the characteristics of the first group of settlers…regardless of how small the initial band of settlers might have been.” Regional cultures can thus be discerned and mapped by tracking competing first settlement streams, an exercise that has informed the work of historians26,27 and geographers.28-30 This American Nations model
5
has been applied to explain differences in several areas, including economic development,
31
mortality,
32
gender wage gaps,
33
personality characteristics,
34
voting behavior,
35
social vulnerability,
36
and health characteristics.
2
A detailed description of the American Nations cultures has been previously published.
37
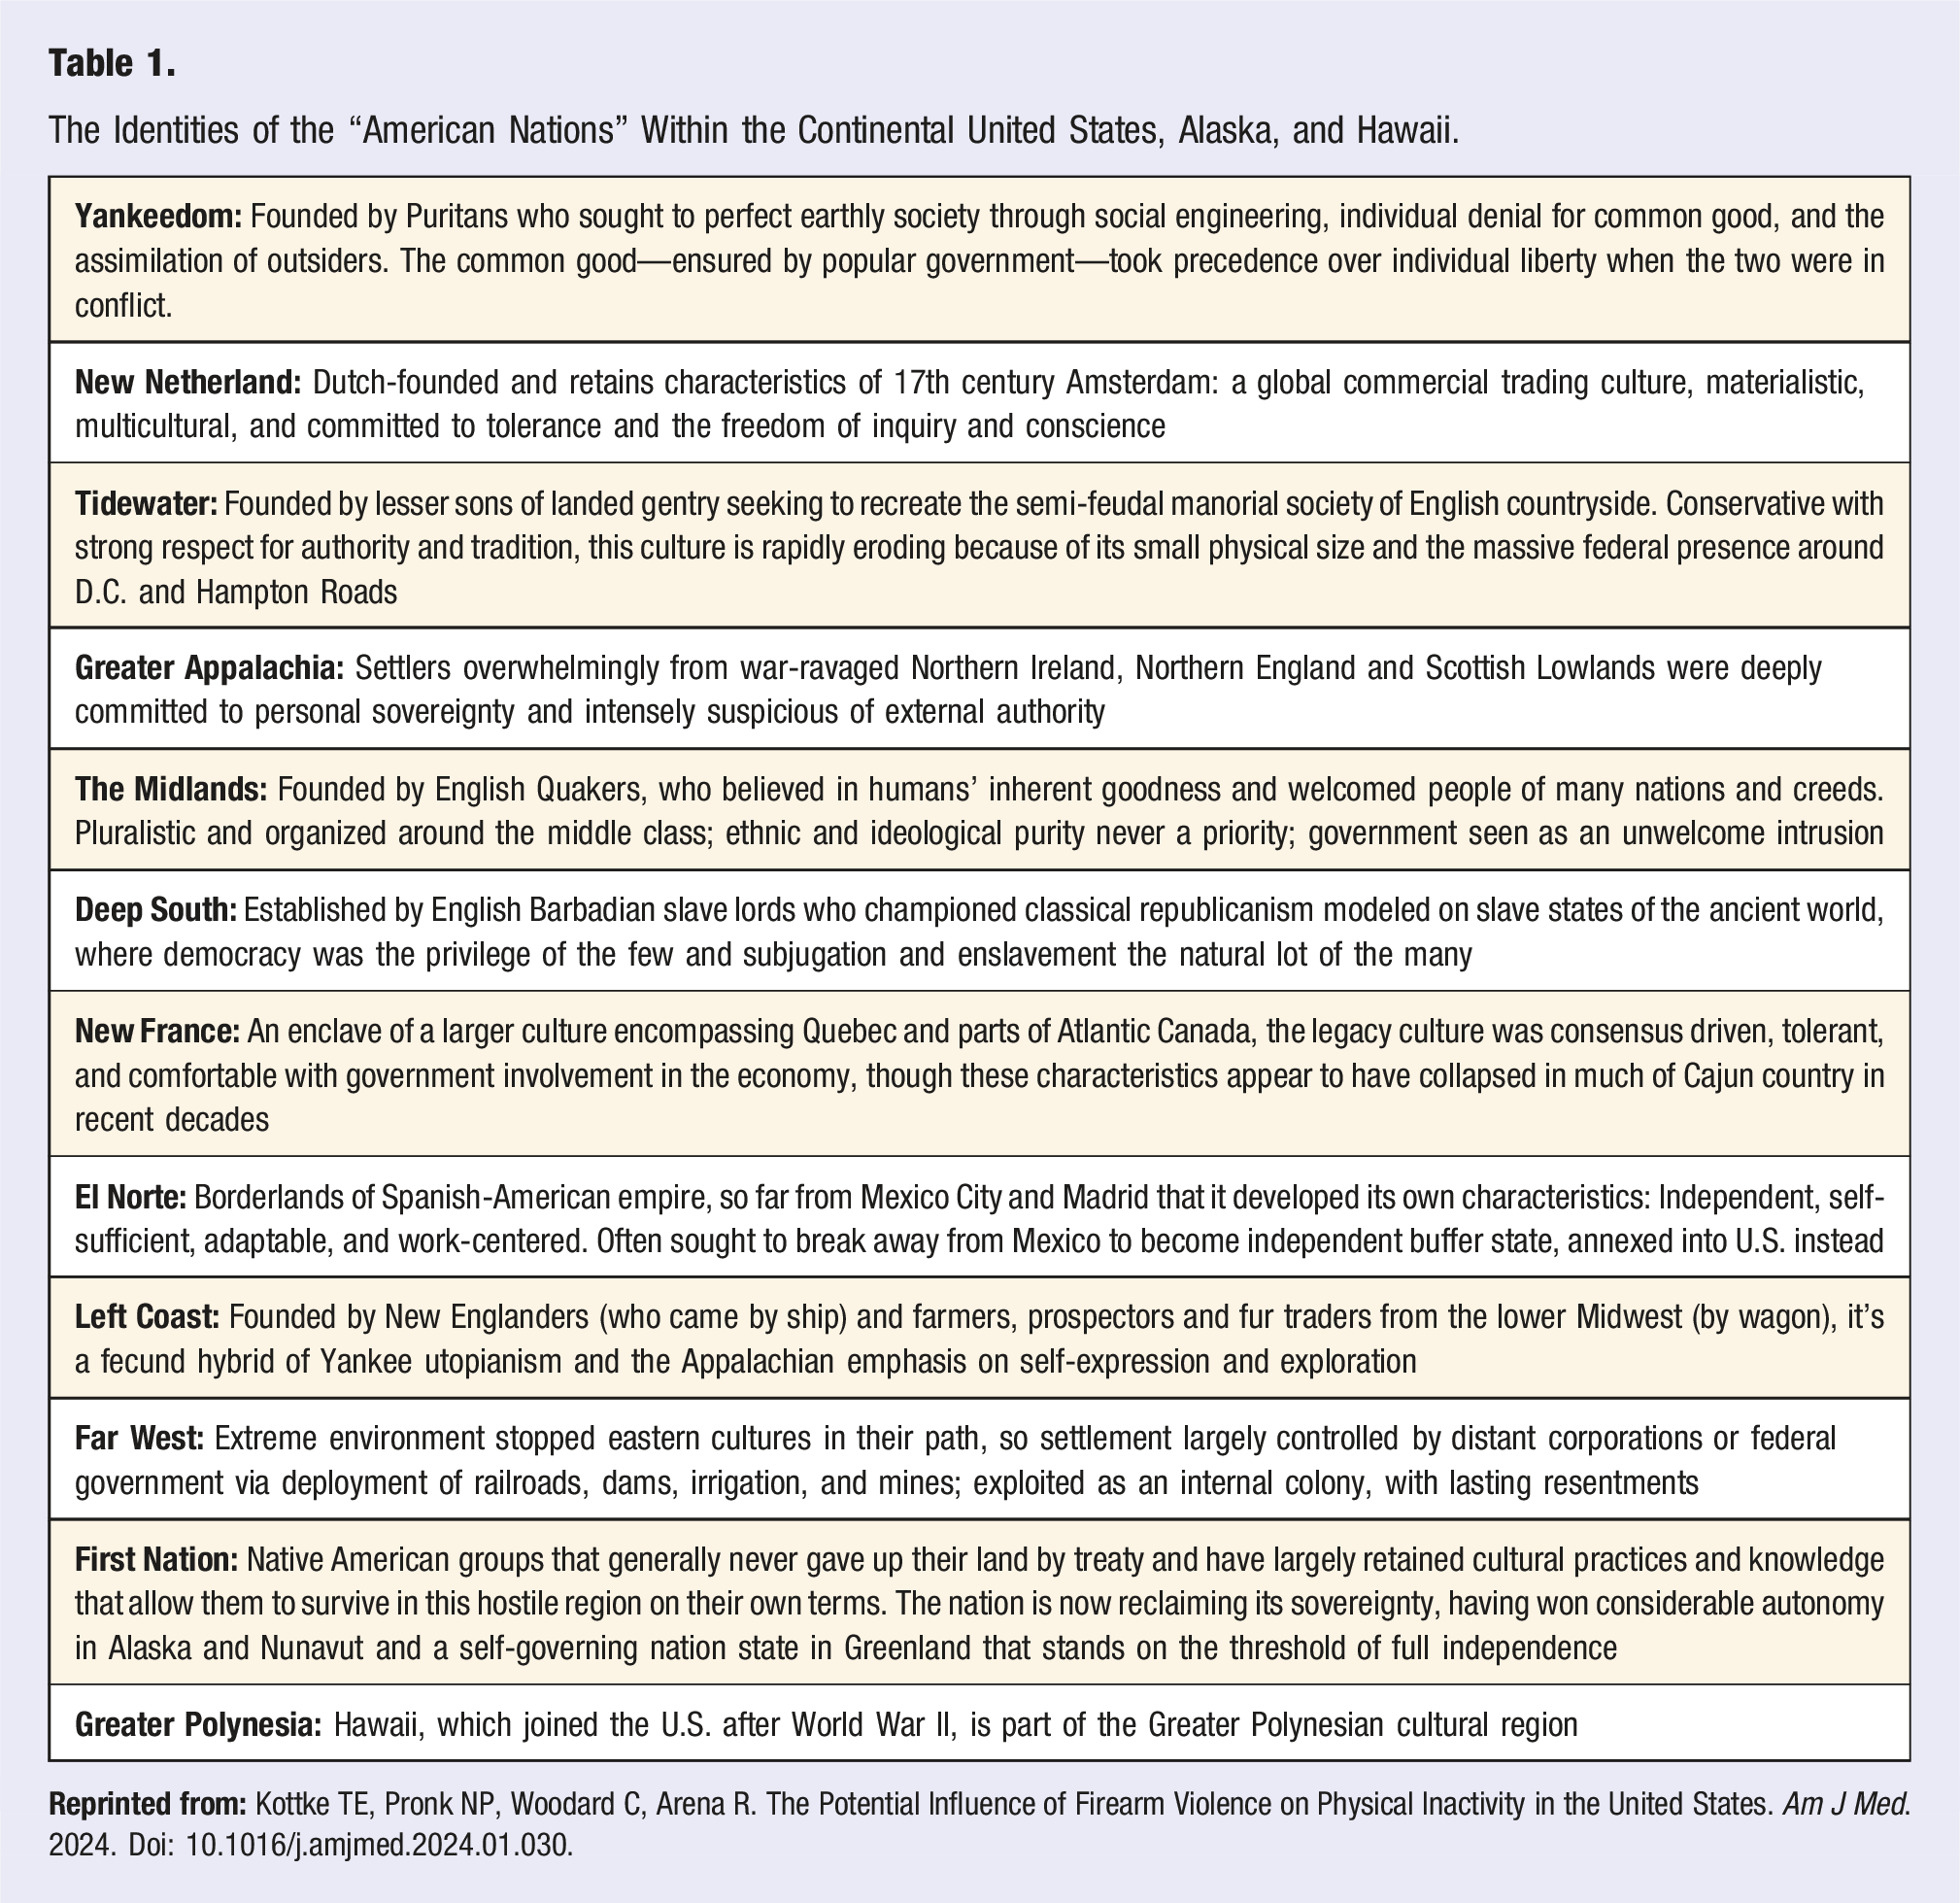
The American Nations cultural model is illustrated in Figure 1, and a synopsis of cultural characteristics of American Nations is provided in Table 1.
2
The American Nations Model. Reprinted with permission: https://www.nationhoodlab.org/a-balkanized-federation/. The Identities of the “American Nations” Within the Continental United States, Alaska, and Hawaii.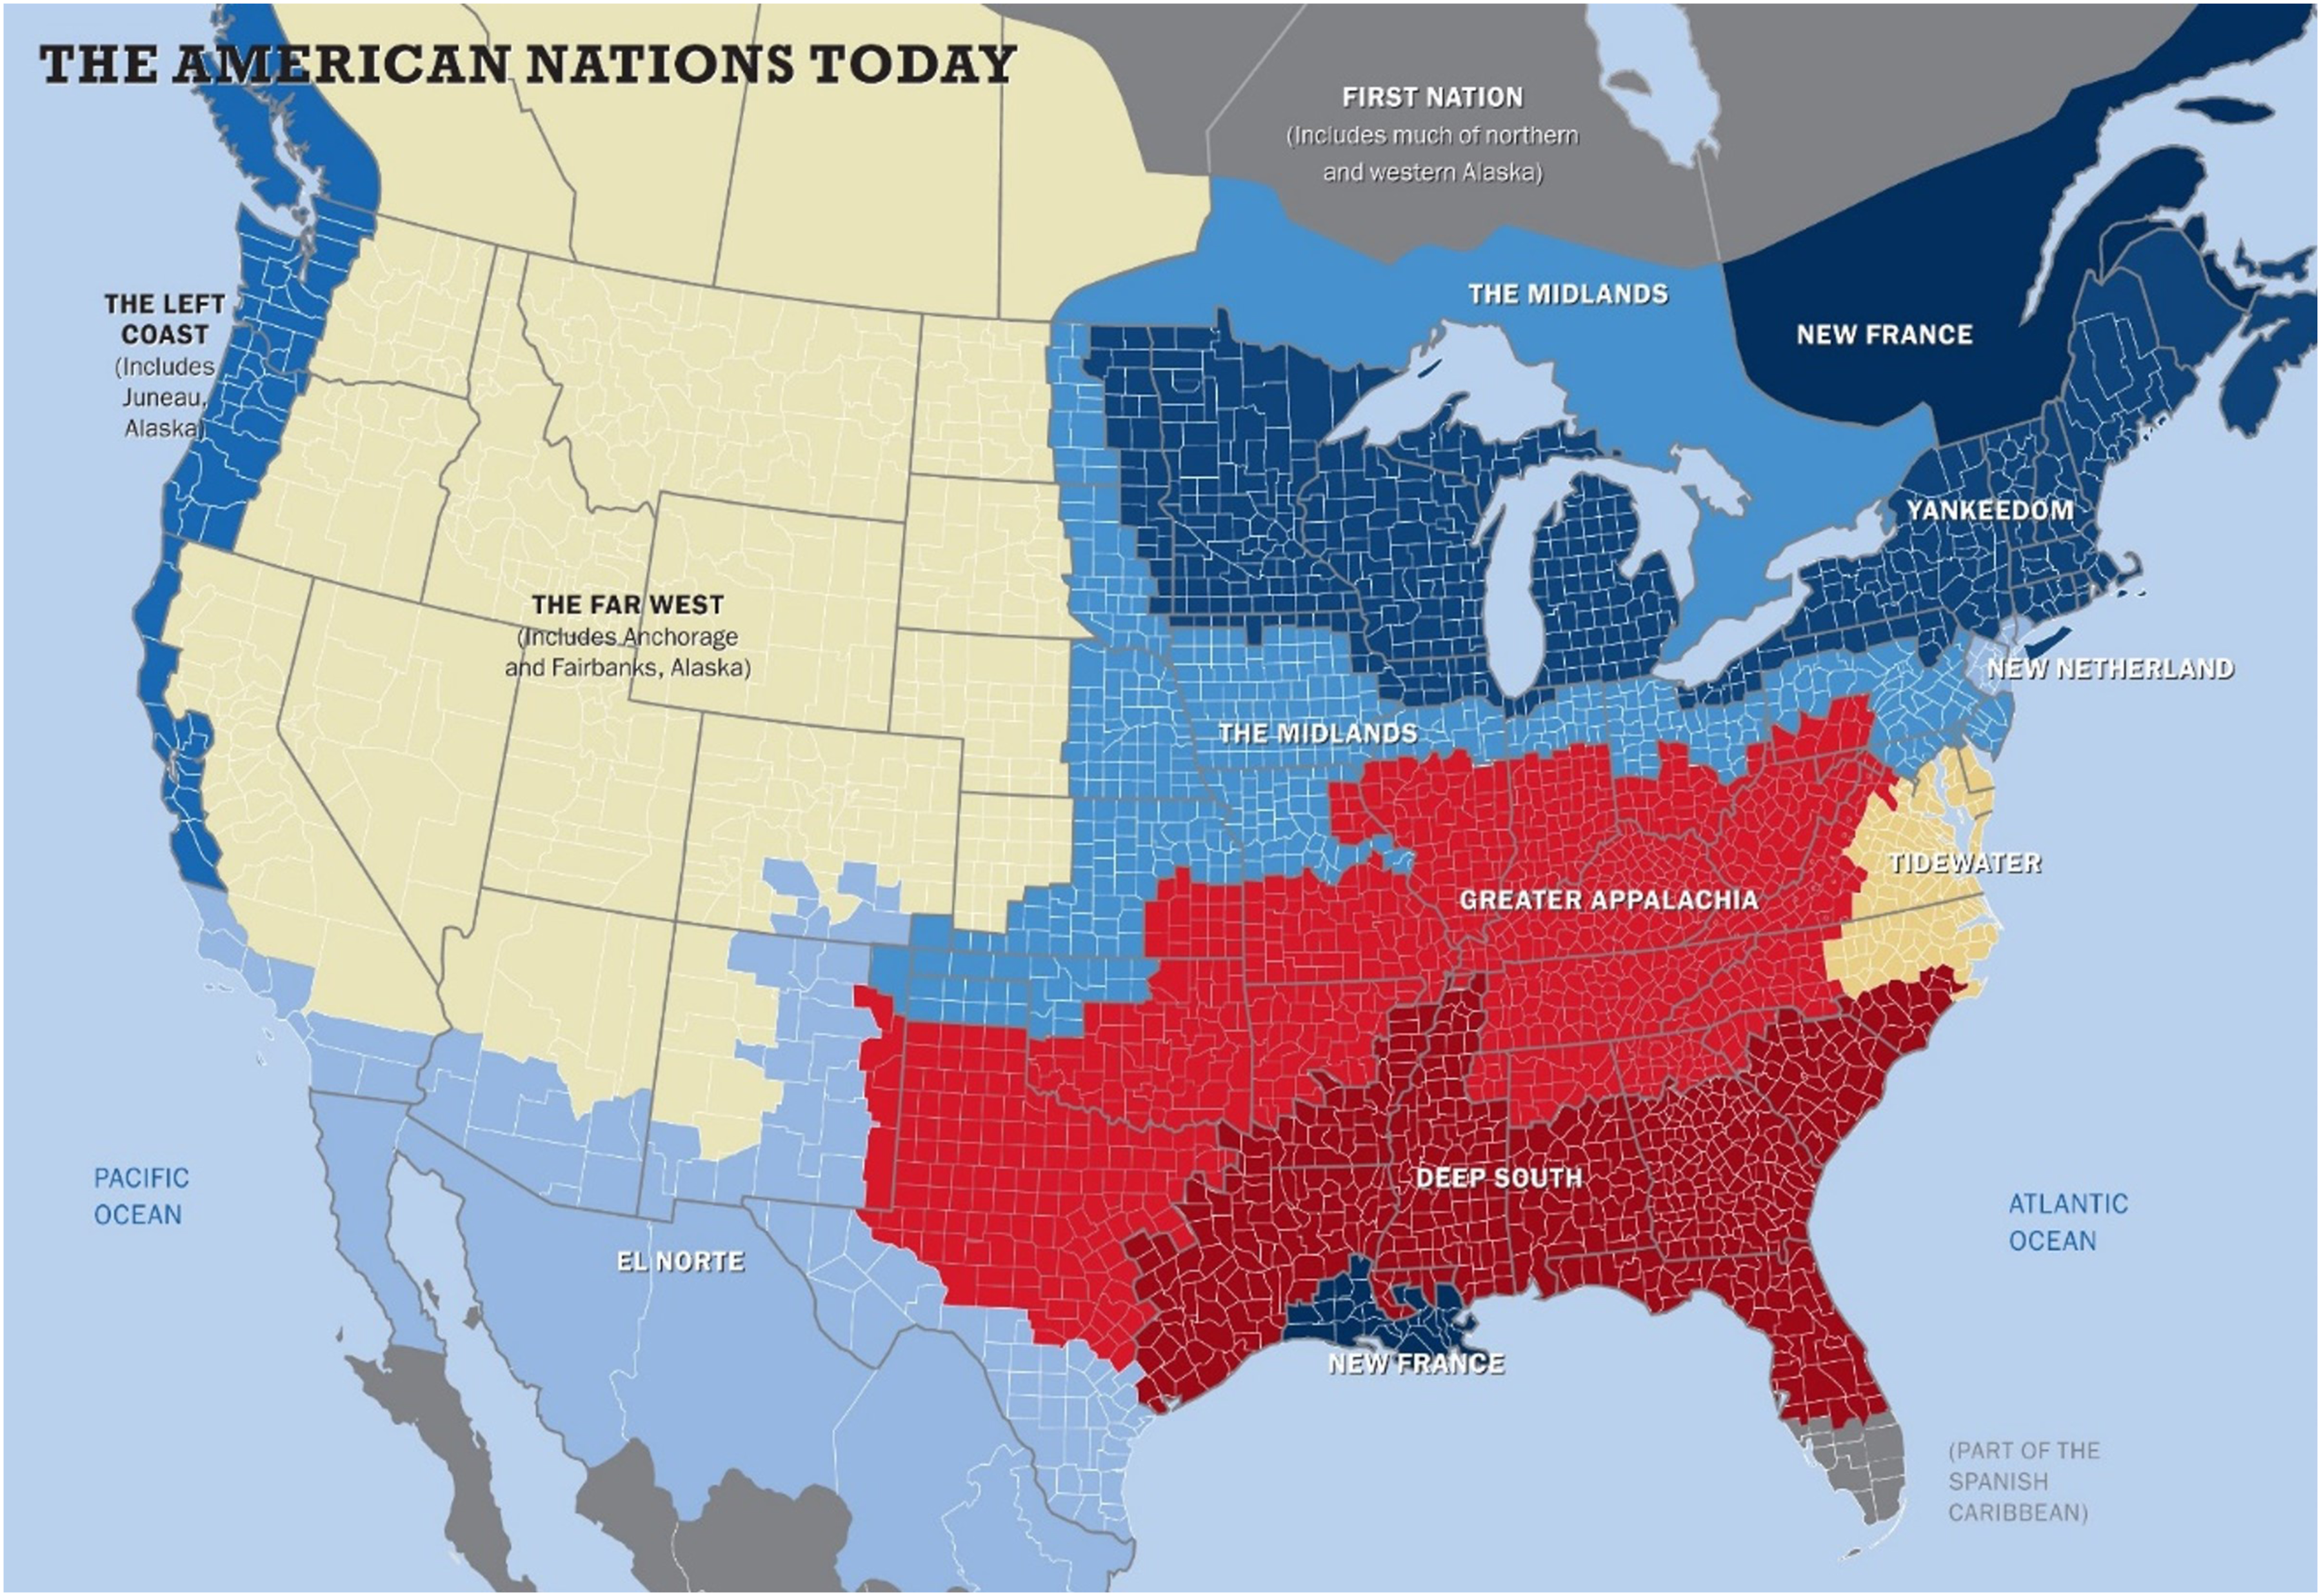
Process for Merging Databases
The CDC PLACES, CDC/ATSDR Social Vulnerability Index, and Nationhood Lab databases all contained U.S. zip-code identifiers. As such, the databases used in the current study were linked through zip-code identifiers using Microsoft Excel (Redmond, WA).
Subject Protection
HealthPartners Institute Research Subjects Protection Program determined that this study is exempt from IRB review and ongoing oversight under 45 CFR Part 46 as it involves the analysis of existing, publicly available data.
Statistical Analysis
Pearson correlation coefficients were used to assess the relationships between arthritis prevalence and: (1) LHI sub scores and overall score; (2) Depression prevalence; (3) Disability prevalence; and (4) SVI. Analysis of variance (ANOVA) with Fisher’s least significant difference post-hoc testing was used to assess: (1) LHI overall score; (2) Depression prevalence; (3) Disability prevalence; and (4) SVI according to arthritis prevalence quartiles. All statistical tests with a P-value <0.05 were considered significant. SPSS (Version 28, IBM, Armonk, NY) was used for all statistical analyses.
Results
Data was available from 3073 U.S. counties for all analyses. Florida did not report the data needed to calculate the LHI in 2021 and was therefore excluded from the current analysis.
Person Product Moment Correlation Results.
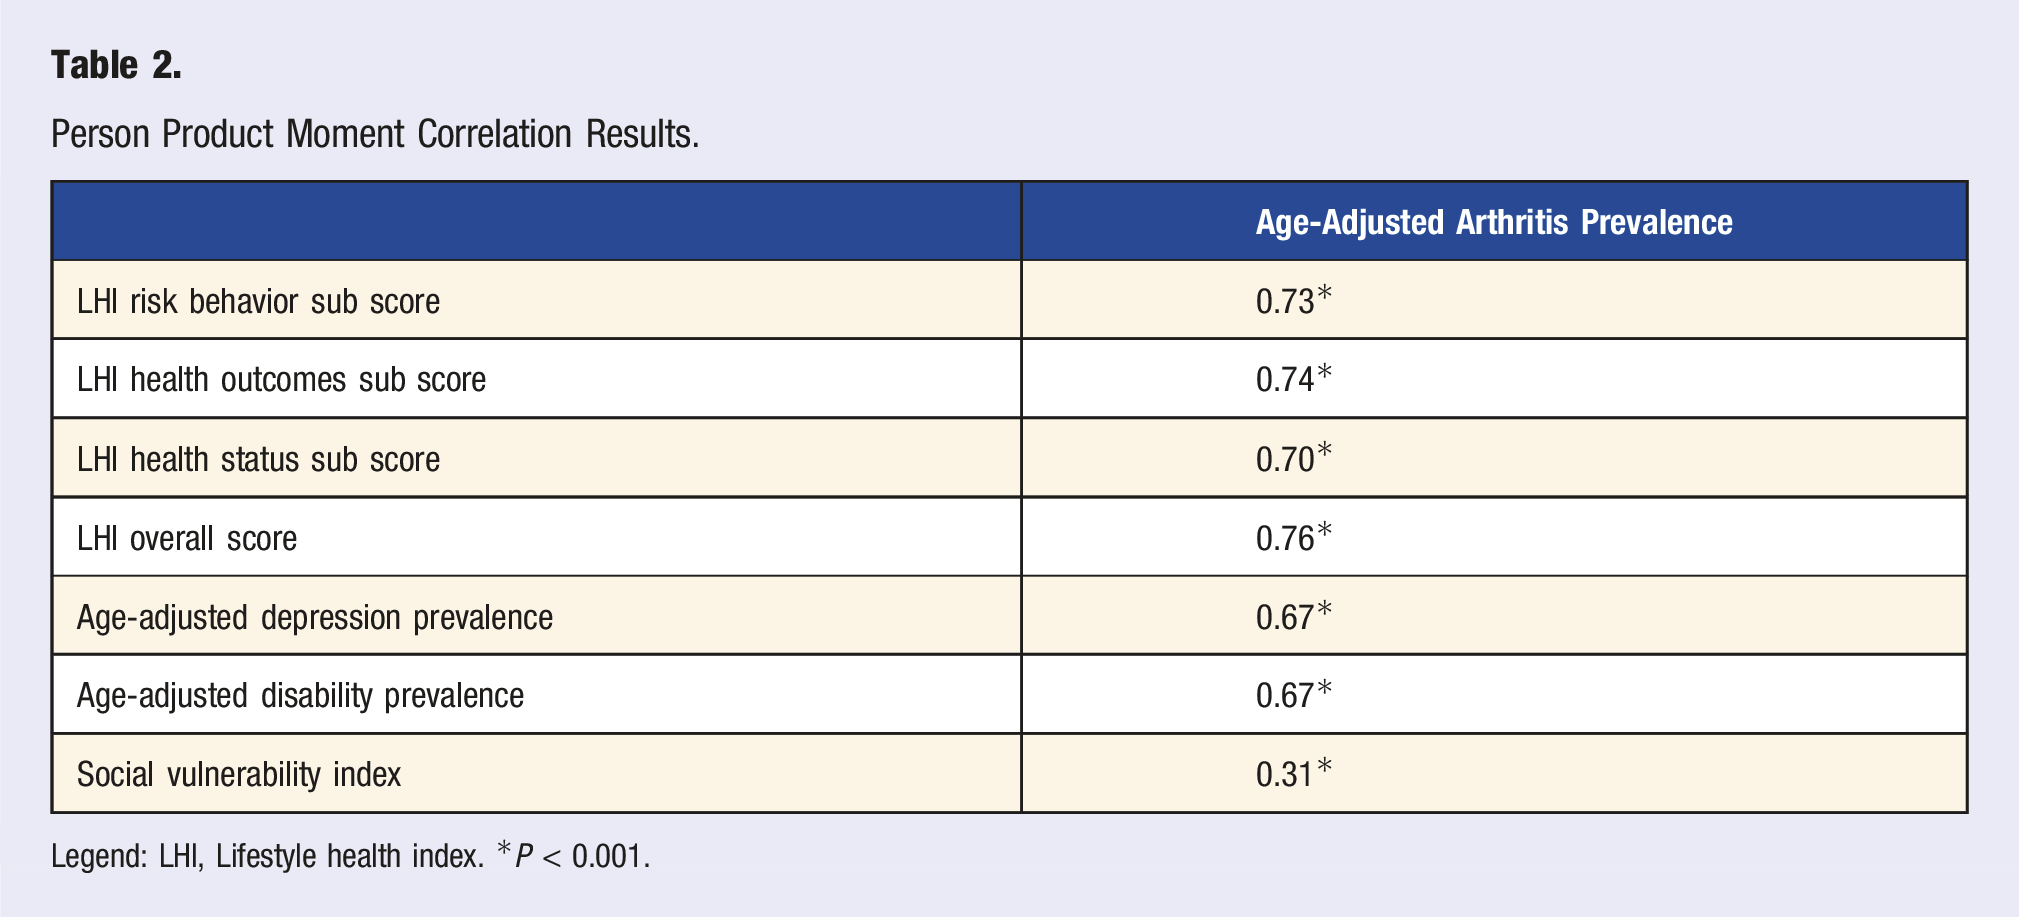
Legend: LHI, Lifestyle health index. *P < 0.001.
Figure 2 illustrates AVOVA results for LHI overall score, age-adjusted depression prevalence, age-adjusted disability prevalence, and SVI according to age-adjusted arthritis prevalence quartile. Post-hoc testing revealed all measures were significantly different according to arthritis prevalence quartiles. Analysis of Variance Results by Age-Adjusted Arthritis Prevalence Quartile. Legend: All post-hoc comparisons by quartile statistically significant at P < 0.05.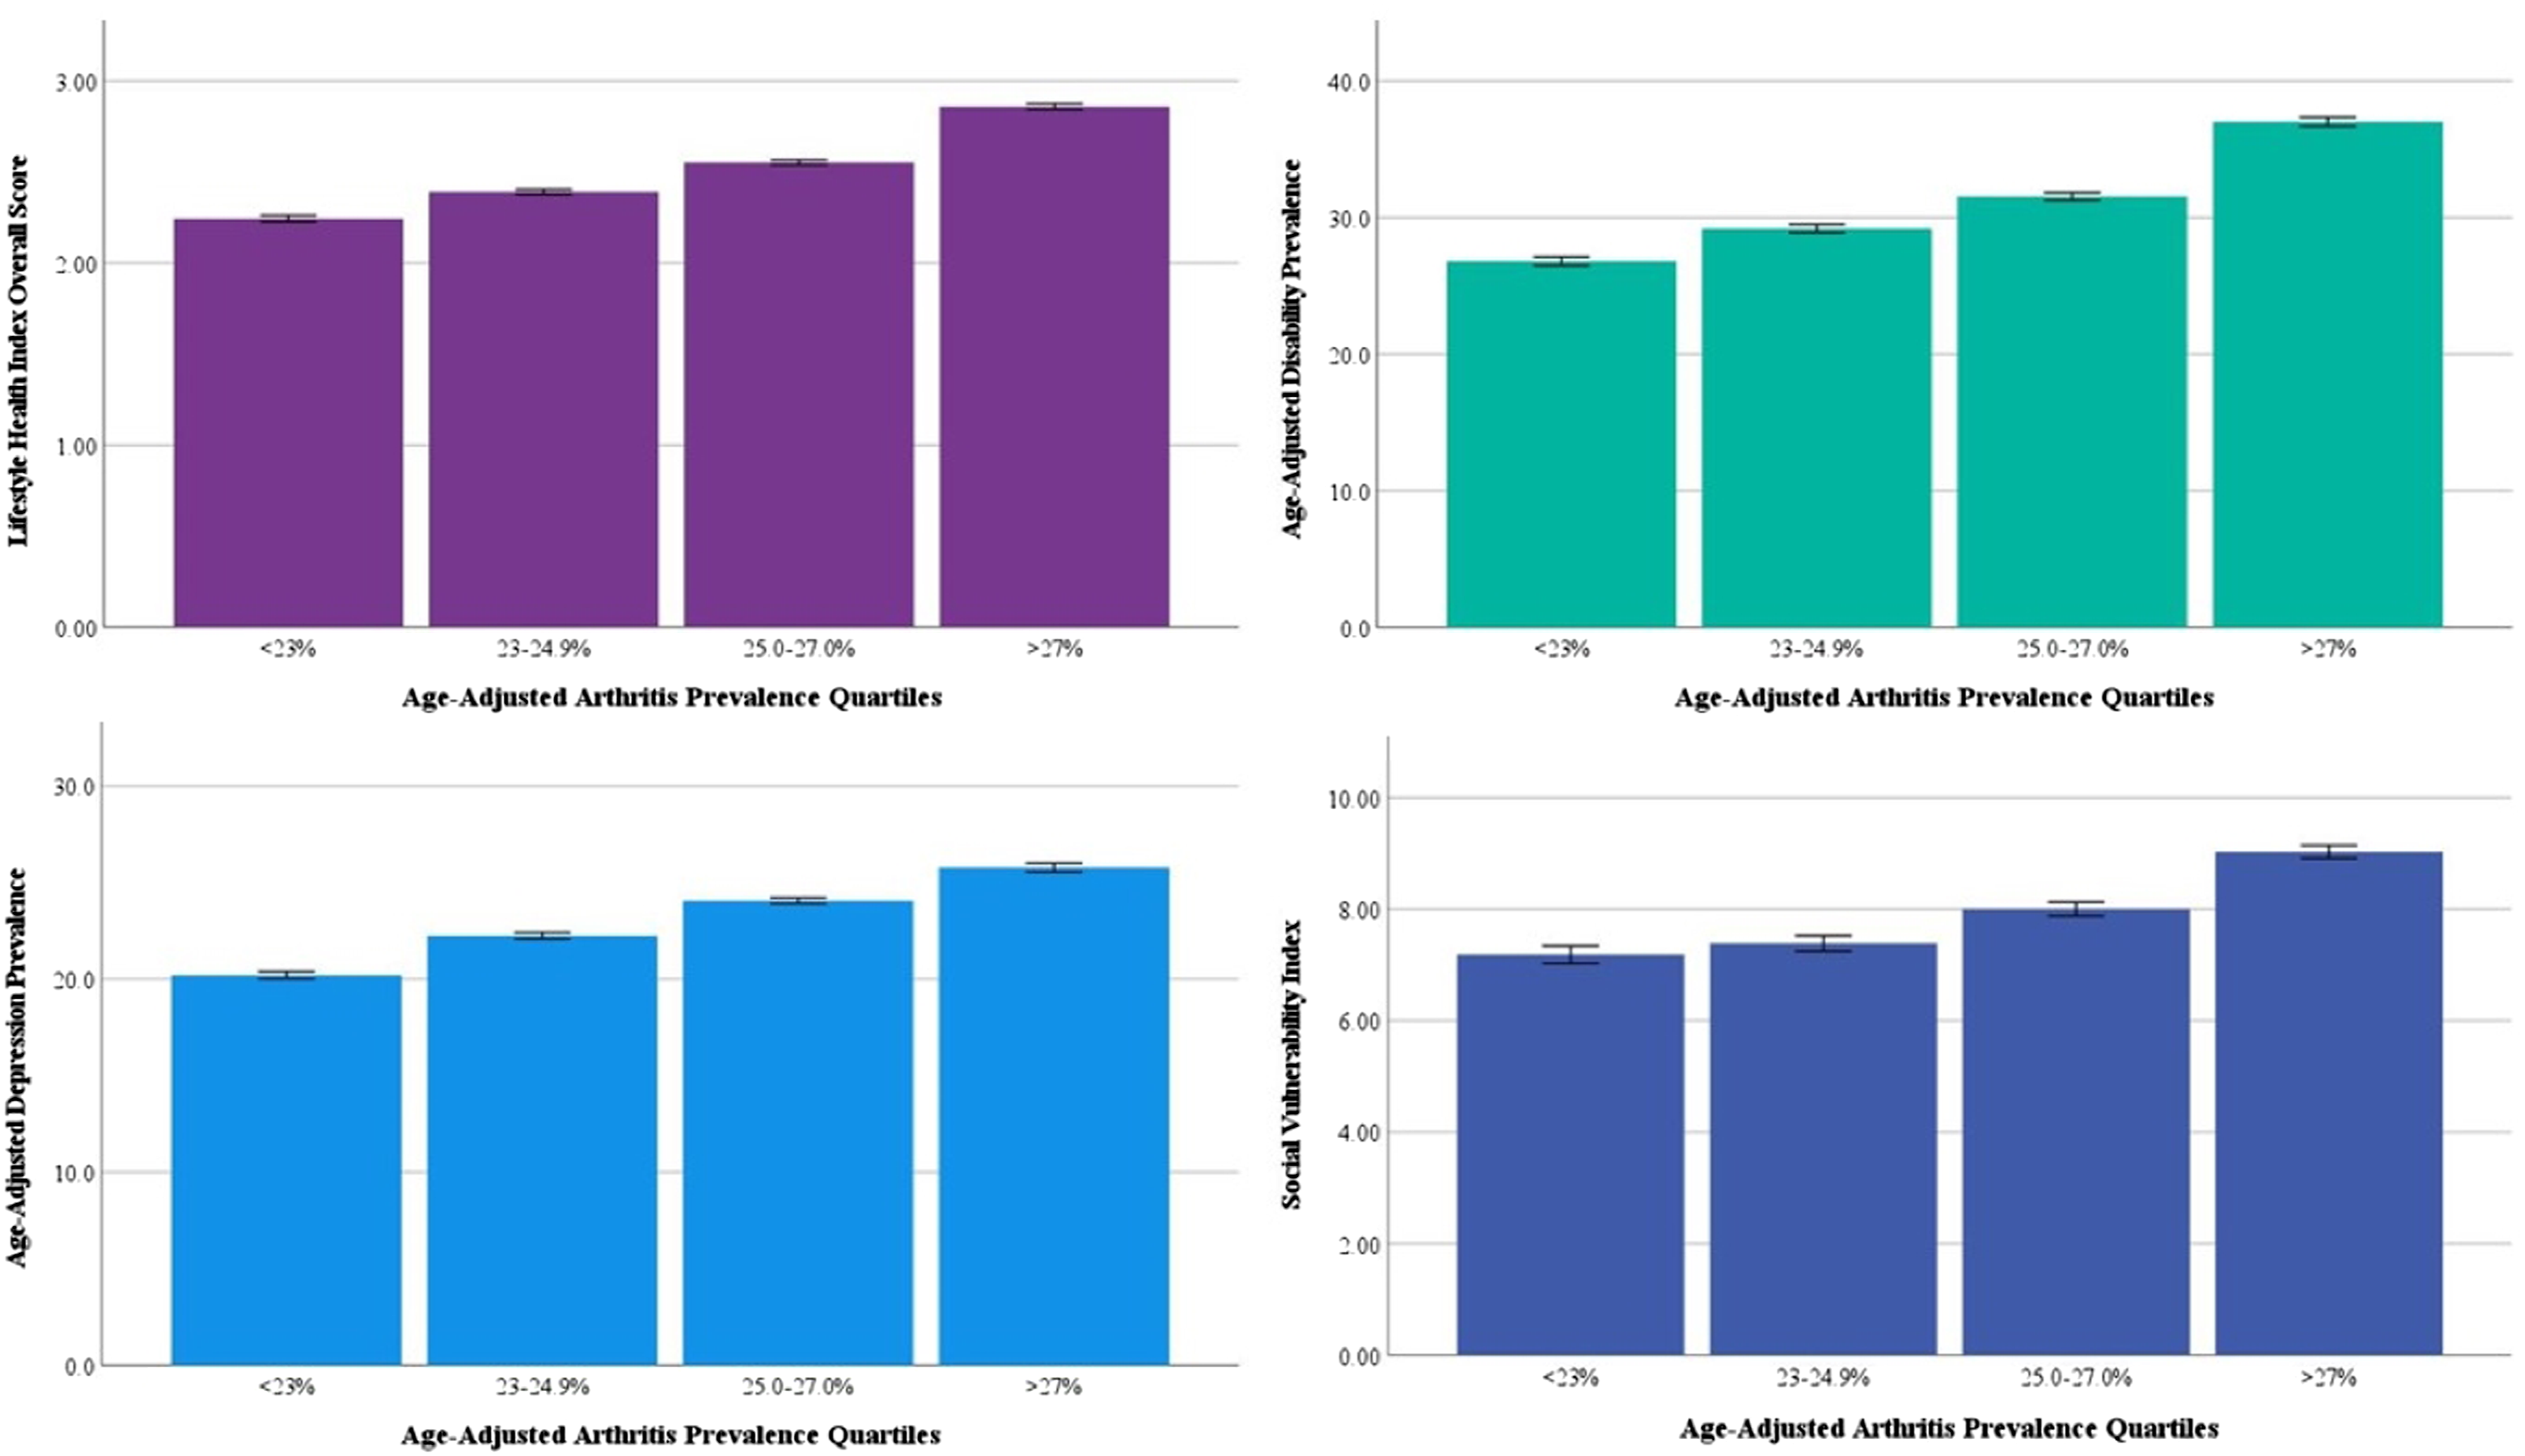
Figure 3 illustrates the geographic distribution of age-adjusted arthritis prevalence according to the American Nations regional cultures model. Figure 3(a) and (b) illustrate the 2021 age-adjusted arthritis prevalence in the American Nations, both as an average arthritis prevalence in each region (3a) and at the county-level (3b), respectively—clear heterogeneity in arthritis prevalence exits across regions. Prevalence of any age-adjusted arthritis among adults aged ≥18 years.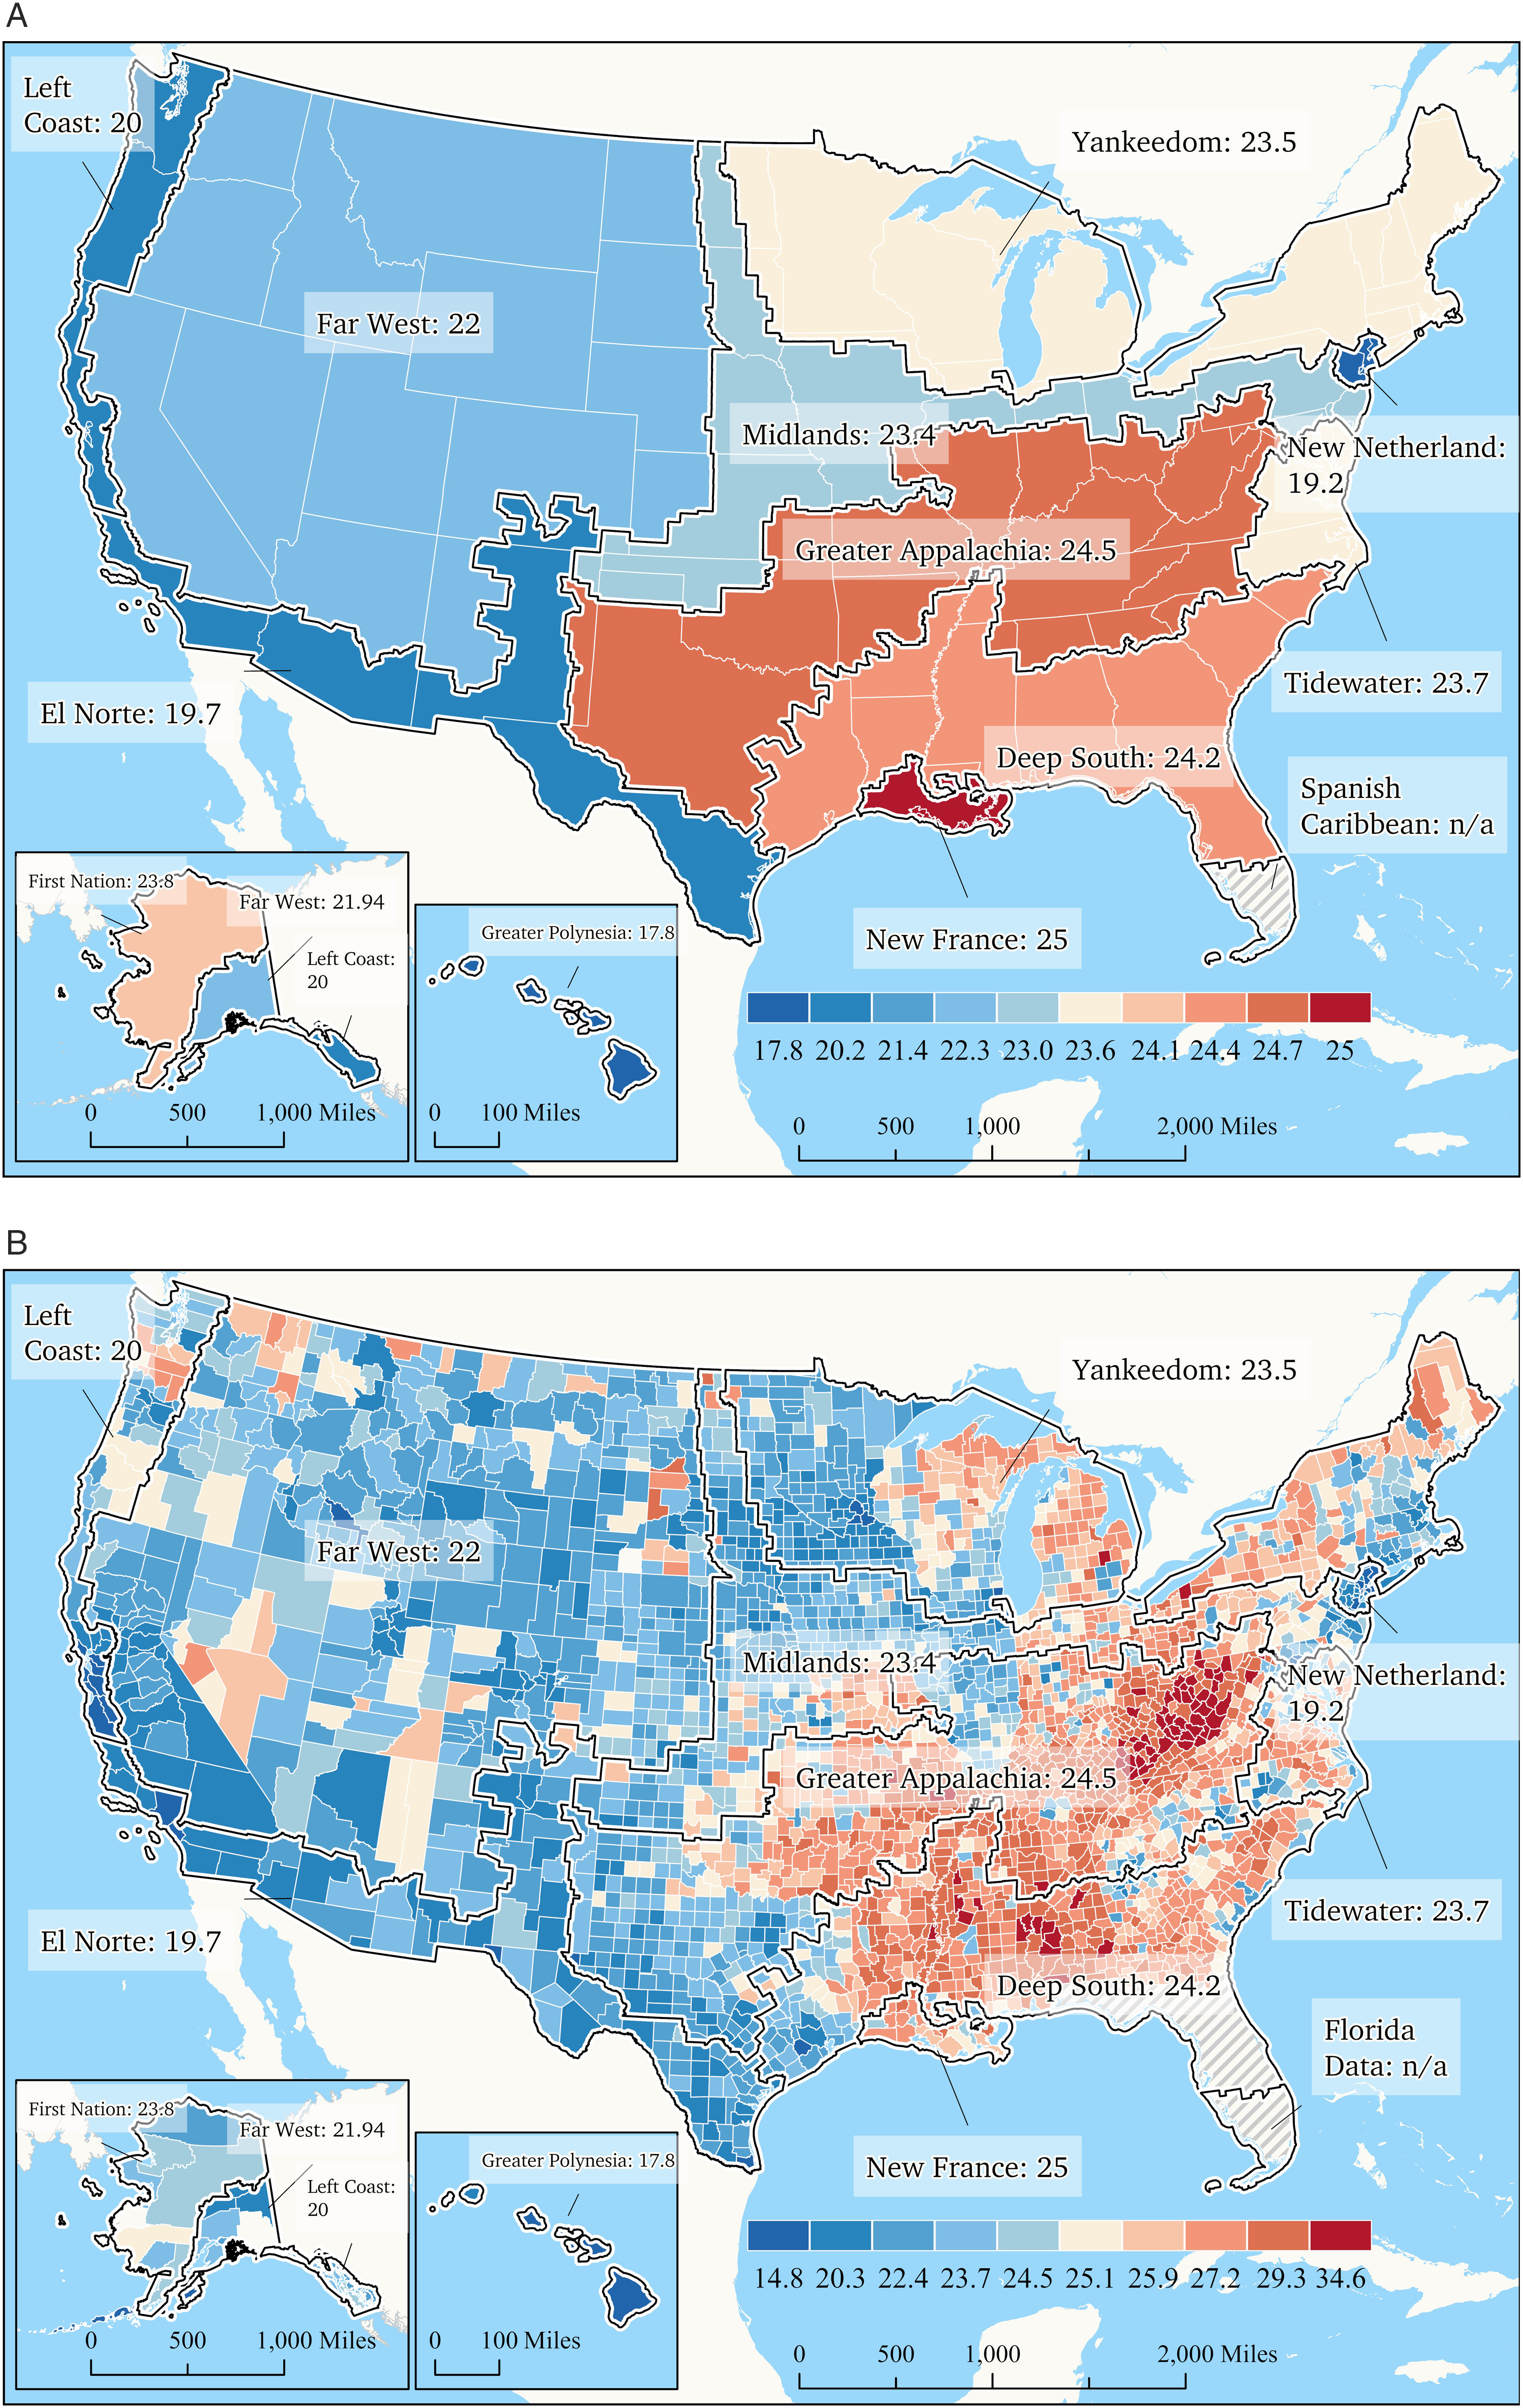
Discussion
Health care is often delivered in a silo—a patient has a condition whose symptoms come to the forefront, facilitating an interaction with one or more health professionals to discretely address them. But in reality, patients often suffer from myriad conditions that are interrelated, interdependent, and interconnected and would ideally be considered and addressed simultaneously in a manner that appreciates this complexity. 38 Such is the case with two broad categories of conditions examined herein—unhealthy lifestyle behaviors and cardiometabolic/cancer diagnoses on the one hand and arthritic conditions in the other. These conditions are actually interrelated. Prior to a clinical diagnosis, unhealthy lifestyle factors that lead to obesity demonstrably increase the risk of cardiometabolic conditions, certain forms of cancer39,40 and arthritis. 13 Arthritis, for its part, further increases the risk of a subsequent cardiometabolic disease diagnosis. 15 In the current analysis, our findings convincingly demonstrate the link between unhealthy lifestyle behaviors, cardiometabolic/cancer diagnoses and arthritis. Previous evidence has demonstrated that social vulnerability plays an important role in unhealthy lifestyle behaviors, specifically physical inactivity. 6 While, Social vulnerability may also play a role in the prevalence of arthritis—thought the relationship is not as strong as with inactivity—warranting further exploration in this area. Strong relationships also exist between the prevalence of arthritis and both depression and disability prevalence. As stated in the introduction, a syndemic is “two or more health conditions or diseases that cluster by person, place or time which adversely interact with and negatively affect the outcomes of one another.” 9 Our group has previously provided evidence that the U.S. is experiencing an unhealthy lifestyle—chronic disease syndemic.41-43 The current analysis further expands on this assertion, proposing arthritis should be included as its prevalence is high and it has clear interrelationships with health and environmental conditions that can compound one another’s negative impacts.
The risk of cardiometabolic conditions, certain forms of cancer, and arthritis are all significantly higher among those who chronically adopt unhealthy lifestyle behaviors.4,13 Moreover, we painfully learned that unhealthy lifestyle behaviors and associated chronic conditions significantly increased the risk of poor outcomes in those infected during the COVID-19 pandemic, 42 further demonstrating the current state of poor U.S. health resiliency. From a health care delivery perspective, the challenges in addressing this syndemic are substantial and, to be successful, will require a radical change in approach from a reactionary, secondary prevention model to one that is proactive and preventative, embracing the principle that healthy living is medicine. 9 Without question, a health care system that integrated physical activity, healthy nutrition, abstention from smoking and the maintenance of ideal body habits would profoundly reduce the prevalence of chronic conditions that currently burden the U.S. population and its health care system.
Absent these needed structural changes, there are important adaptations that can be made to the secondary prevention model that may still have significant positive impacts on health outcomes. Specifically, condition-specific care should be replaced with an approach that treats patients holistically. For example, physical therapy is strongly recommended for individuals diagnosed with arthritis, 44 but care delivered by physical therapists often focuses on the arthritis alone because that is the reason for the referral. For reasons that are not entirely clear, evidence indicates assessment of cardiopulmonary vital signs and risk for cardiovascular disease is infrequent in physical therapy practice.45-47 The findings of the current study indicate patients referred to physical therapy for arthritis are likely to also present unhealthy lifestyle behaviors and cardiometabolic conditions. Given that these conditions are also part of the same syndemic, this presents an important opportunity to address health conditions holistically.
There is another complication to effectively addressing U.S. population health challenges: the U.S. has distinct regional cultures. The American Nations model proposes distinct regional cultural phenotypes in the U.S. based upon settlement patterns (see Table 1). We have previously demonstrated clear, stark contrasts in unhealthy lifestyle behaviors, chronic disease, and social vulnerability amongst the American Nation regions.1,2,6 Age-adjusted arthritis prevalence illustrated in Figure 3 mirrors our previous findings on regional differences in health indices—including life expectancy and COVID-1948,49—with the Deep South and Greater Appalachia cultural regions again showing poor health status and outcomes. The aim of highlighting these unique cultural phenotypes in our work is not to disparage or praise a regional culture. Rather our goal is to highlight culture as an important consideration when crafting tailored approaches so that will be optimally effective on an individual/local level. Clearly, the Deep South and Greater Appalachia regions (see definitions in Table 1) are negatively impacted by a myriad of poor health characteristics and outcomes. Our findings indicate there is a need to better understand underlying cultural drivers of health in these regions and craft health messaging and programs that uniquely resonate with the cultural values of individuals and communities in these regions. As a specific example of the importance of complex cultural influences on health, Lerman et al 50 compared demographic and clinical characteristics in Hmong and non-Hmong patients suffering from gout. The Hmong are an Asian ethnic group from mountainous areas of Laos, Thailand, Vietnam, and China. During the Vietnam War, members of this group served as covert U.S. military operatives and were as a result were subject to reprisals. Many were forced to flee and reside in refugee camps before being evacuated to the US, where many settled in Minnesota, Wisconsin, and California. 50 After adjustment for age, sex and type of clinical encounter, findings revealed Hmong gout patients presented with similar rates of comorbidities (i.e., hypertension, diabetes, and cardiovascular disease) compared to non-Hmong patients with gout. Hmong patients also had a higher likelihood of accessing care through emergency departments and were less likely use medications to treat the disease. The authors noted less favorable characteristics and outcomes in Hmong patients with gout were potentially influenced by unique cultural factors and noted “intensive efforts are needed in the Hmong population for culturally appropriate preventive care management of gout along with diabetes mellitus, hypertension, heart disease, and kidney disease.” 50 Unfortunately, we currently approach public health messaging and health care delivery as a one size fits all enterprise. While lifestyle behaviors and health interventions that are ideal, evidence based, and universally effective are not in dispute (e.g., physical activity is beneficial to all people), adoption, and adherence lags far behind recommendations. This may be due to the failure to consider distinct cultural belief systems on a local level. Based on our previous work and present findings, it would appear current public health messaging and interventions are not resonating in certain U.S. regions. Future work is urgently needed to better understand local/regional drivers of adoption and adherence to healthy lifestyle behaviors and health care interventions. We are not suggesting regional differences in arthritis prevalence is a cultural phenomenon. Rather, variation in arthritis prevalence is a consequence of other factors (e.g., unhealthy lifestyle behaviors) whose adoption or lack thereof is impacted by our failure to consider cultural influences in our messaging and interventions. Specifically, variations in unhealthy lifestyle behaviors across the American Nations may be triggering the observed regional differences in downstream health outcomes, including the risk of chronic disease and arthritis. We would be remiss to recognize other key factors complexly interact with cultural values, as previous work, for example, has demonstrated racial disparities 14 and neighborhood characteristics (i.e., social cohesion and perceived neighborhood resources) 51 impact arthritis characteristics and outcomes. Until we recognize the U.S. is a heterogenous milieu in the context of culture as well as other factors, population health will remain challenging and marked by stark regional contrasts in outcomes. The findings of the current study suggest that, in addition to race 14 and community infrastructure 51 cultural influences are likely a component of the syndemic we have identified.
The line of inquiry opened by the current analysis and our group’s previous work2,3,6,8 is by no means definitive. The relationships between age-adjusted arthritis prevalence and other county-level measures of interest demonstrate strong associations and therefor an increased likelihood of these factors clustering together on an individual level. However, this hypothesis needs to be tested in future investigations that perform detailed analyses of the clustering of conditions as well as potential driving forces, including culture, social vulnerability, community safety, etc. Furthermore, further research is needed to provide a more refined resolution to the relationships reported herein. For example, the surveillance question related to disability, an important downstream effect of arthritis, is broad and different components of disability likely have distinct and uniquely relevant relationships with arthritis. Lastly, innovative approaches to public health messaging and health care delivery must be implemented in real world settings to ensure they resonate on a community level and therefore optimize the likelihood of fostering favorable health outcomes for individuals living in those communities.
In conclusion, poor state of health of the U.S. population is disconcerting. There is no clear path to reversing these trends, particularly with the current model of health care delivery, which is often approached from a siloed (condition-specific vs holistic care), reactionary, secondary prevention model. Moving forward, targeting unhealthy lifestyle behaviors from a proactive, primary prevention approach is imperative. Strategies that meaningfully improve physical activity and reduce obesity on a population level have a high likelihood of reducing negative health consequences downstream, such as chronic disease and arthritis. Moreover, the one size fits all approach to public health messaging and health care interventions falls short; individuals need to be met where they live, work, pray, play, and learn, and their individual/community belief systems need to be considered in the context of health. Primary prevention healthy living strategies must consider cultural drivers on a local level. In the current study, we provide further evidence that arthritis prevalence is part of a larger ongoing syndemic in the U.S. requiring urgent attention and innovation.
Footnotes
Author Contributions
All authors had access to the data. RA prepared the initial draft of the manuscript. RA and CW prepared data analysis. All authors provided critical revisions and new content to the manuscript draft.
Declaration of Conflicting Interests
The author(s) declared no potential conflicts of interest with respect to the research, authorship, and/or publication of this article.
Funding
The author(s) received no financial support for the research, authorship, and/or publication of this article.