
Abstract
“The B’N Fit Power program allowed for the tracking of students’ lifestyle behaviors before and after the COVID-19 shutdown.”
Background
Nearly one in five children in the United States has obesity; these rates are higher among Hispanic and non-Hispanic Black children. 1 Obesity is a multifactorial condition with behavioral and structural components. Lifestyle behaviors commonly employed to prevent childhood obesity include engaging in physical activity 2 and consuming fruits and vegetables, 3 as well as limiting fast food and sweetened beverage consumption. 4 Insufficient sleep and excessive screen time have also been associated with childhood obesity; expert recommendations also recommend targeting these behaviors as part of childhood obesity management.5-7 Less than half of American youth meet CDC physical activity, fruit, vegetable, or sugar-sweetened beverage consumption recommendations.1,8 These behaviors occur in a larger structural context that also contributes to childhood obesity. Children and adolescents in urban settings such as the Bronx face additional barriers to engaging in physical activity, frequently live in food deserts, and have abundant access to fast food and processed snacks. The Bronx has the New York State’s highest proportion of children living in poverty (38% immediately before the start of the COVID-19 pandemic) and is a majority-minority county. 9 Nearly 1/3 of Bronx households experience severe housing cost burdens. 9 Bronx schools have high absentee and low completion rates (68% before the start of the COVID-19 pandemic). 9 Rates of obesity prevalence are higher for Bronx youth of Hispanic and Black background (24% and 19%, respectively) than non-Hispanic white youth (17%). 10 The low-socioeconomic status of Bronx teens limits access to recreational resources, nutrition education, and physical activity opportunities that may enrich their lives and reduce health disparities. 11 Among Bronx adolescents surveyed in 2019, 86.9% reported they were not physically active for at least one hour any day of the week, 14.4% reported they had not had a serving of fruit or 100% fruit juice in the prior week, and 80.9% reported they were not sleeping at least 8 hours nightly. 12 Among New York City youth aged 6-12, 66.1% spent at least 2 hours watching TV/videos; playing on cell phones, tablets, or hand held video games; or using the computer for non-school purposes on an average weekday; 53.0% of students in New York City public high schools spent at least 4 hours doing so. Roughly one-third of residents of Bronx community districts drink sugar-sweetened beverages daily. 13
The COVID-19 pandemic has exacerbated existing socioeconomic and health disparities. The Bronx unemployment rate in 2022 was the state’s highest at 16%, and the Bronx experienced the highest per capita death rate of New York’s 62 counties. 9 While the long-term outcomes of the COVID-19 pandemic are still being evaluated, research suggests that children worldwide engaged in less organized physical activity (PA) during the pandemic 14 and have had less access to healthy food. 15 Meta-analysis shows that other impacts of the pandemic on behaviors such as sleep were variable in adolescents; however, the pooled prevalence of any sleep disturbance during the pandemic was 54%, and the pooled prevalence of children not meeting sleep recommendations was 49%. 16
The objective of this study was to evaluate the impact of the COVID-19 pandemic shutdown on the baseline lifestyle behaviors of Bronx youth participating in the previously studied B’N Fit Power program, 17 a multipronged intervention to increase PA participation, nutrition education, and access to healthy food in the afterschool setting. In 2021, the B’N Fit Power program resumed alongside the full return to in-person classes in New York City public schools. Many students returned to afterschool activities after a year of hybrid physical education classes and canceled sports leagues. Analysis of routinely collected B’N Fit Power program data in the fall prior to the onset of programming offered a unique opportunity to evaluate the impact of the pandemic on youth baseline lifestyle behaviors. This study analyzes changes in baseline lifestyle behaviors in 2 distinct cohorts, 1 before and the other after the COVID-19 pandemic shutdown, 3 years later. Understanding post-shutdown baseline behaviors of youth will help to understand the impact of the pandemic on health behaviors as well as inform future programming efforts.
Methods
Study Design
The objective of this study is to compare students’ lifestyle behaviors at the start of the school year in a pre-COVID-19 shutdown and a post-COVID-19 shutdown cohort. Data was routinely collected as part of programming before and after the start of the COVID-19 shutdown. The Albert Einstein College of Medicine Institutional Review Board (IRB) approved the research (IRB #2015-5917 via full review and IRB #2021-13679 via expedited review).
Setting
The B’N Fit Power program was implemented at 3 public middle schools in the Bronx, New York during the 2021-2022 school year, which coincided with the full return to in-person education in the New York City public schools. One of schools had previously participated in the program in 2016-2017 and 2017-2018 school years. B’N Fit Power integrates daily PA and nutrition education components into community-run afterschool programs. A detailed description of the B’N Fit Power program is described elsewhere. 17 In brief, the program involves physical activity and nutrition education incorporated into larger afterschool programming.
Student Enrollment
All students participating in afterschool programming at the 3 schools received B’N Fit Power programming. This is a change from the pre-COVID-19 shutdown cohort, wherein a subset of students participating in the afterschool program was specifically screened, consented, and enrolled in the study/program, as previously described (IRB #2015-5917). 17 When programming resumed after the COVID-19 shutdown, all data used in the study were already being routinely collected for non-research purposes, thus the requirement for consent was waived (IRB #2021-13679). As the B’N Fit Power programming is embedded within the afterschool program, the students were not provided with incentives to participate in the programming or complete associated surveys.
Data Collection
Program leaders at each afterschool program site provided data on student demographics and surveys to evaluate baseline lifestyle behaviors, which were completed by students on a tablet while supervised by staff or inputted onto the tablet by staff as they asked the students the questions. Survey items were informed by American Academy of Pediatrics Expert Committee Guidelines, Physical Activity Guidelines for Americans, second Edition NHLBI sleep recommendations, and USDA MyPlate and dietary guidelines.7,18-21 Students were asked to consider the week prior to survey administration when describing the frequency they engaged in the following behaviors: how many days they ate breakfast, days they ate lunch, servings of fruit they ate each day, servings of vegetables they ate each day, cups of unsweetened beverages they drank each day, cups of sweetened beverages they drank each day, hours of sleep they got nightly, times they consumed fast food weekly, times they consumed unhealthy snacks weekly, hours a day they engaged in PA, and hours of recreational screen time they had each day. Students whose data were collected from September-October of the 2016-2017 and 2017-2018 school years were defined as the pre-COVID-19 shutdown cohort. A separate cohort of students whose data were collected from September-October of the 2021-2022 school year were defined as the post-COVID-19 shutdown cohort. In both cases, the baseline data collection occurred before students began B’N Fit Power programming.
Statistical Analysis
Data analysis was conducted on data provided by schools. Lifestyle behavior data was collected by administering a self-reported lifestyle behaviors survey directly to afterschool program participants.
The distribution of participant characteristics was summarized using descriptive statistics. The categorical variables were summarized using frequency count and percentages, while continuous scale variables were summarized as mean (standard deviation) or median (interquartile range) as appropriate.
Survey responses to lifestyle behavior were dichotomized as attained/not attained; “attainment” cutoffs were defined according to the same expert committee guidelines that were used to identify the relevant target behaviors that were used in the survey.7,18-21 One point was allocated for each behavior attained. The points were then summed into a multi-component composite score with a maximum of 7; students received 1 point each for (1) eating breakfast and lunch daily, (2) eating 2-3 servings of fruit daily, (3) eating 3-6 servings of vegetables daily, (4) drinking at least 8 cups of water daily and drinking no more than 1 cup of a sweetened beverage daily, (5) getting at least 8 hours of sleep daily, (6) limiting fast food and unhealthy snack consumption to no more than once weekly, and (7) getting at least an hour of physical activity daily. An eight-component composite score was also computed; students could receive an additional point for having 2 hours a day or fewer of recreational screen time. Differences between groups pre- and post-shutdown cohorts were evaluated using the Mann–Whitney U-test for continuous or ordinal variables and Fisher’s exact test for categorical variables. As we additionally included schools 2 and 3 in the post-shutdown cohort, we examined if demographics (sex, race/ethnic group) of school 2 and school 3 (separately) were different from school 1 using a Fisher’s exact test. Subsequently, a subgroup analysis of pre- and post-shutdown comparison was performed including school 1 only. Data were analyzed in R 4.2.0.
Results
Demographic Information of Afterschool Programming Students.
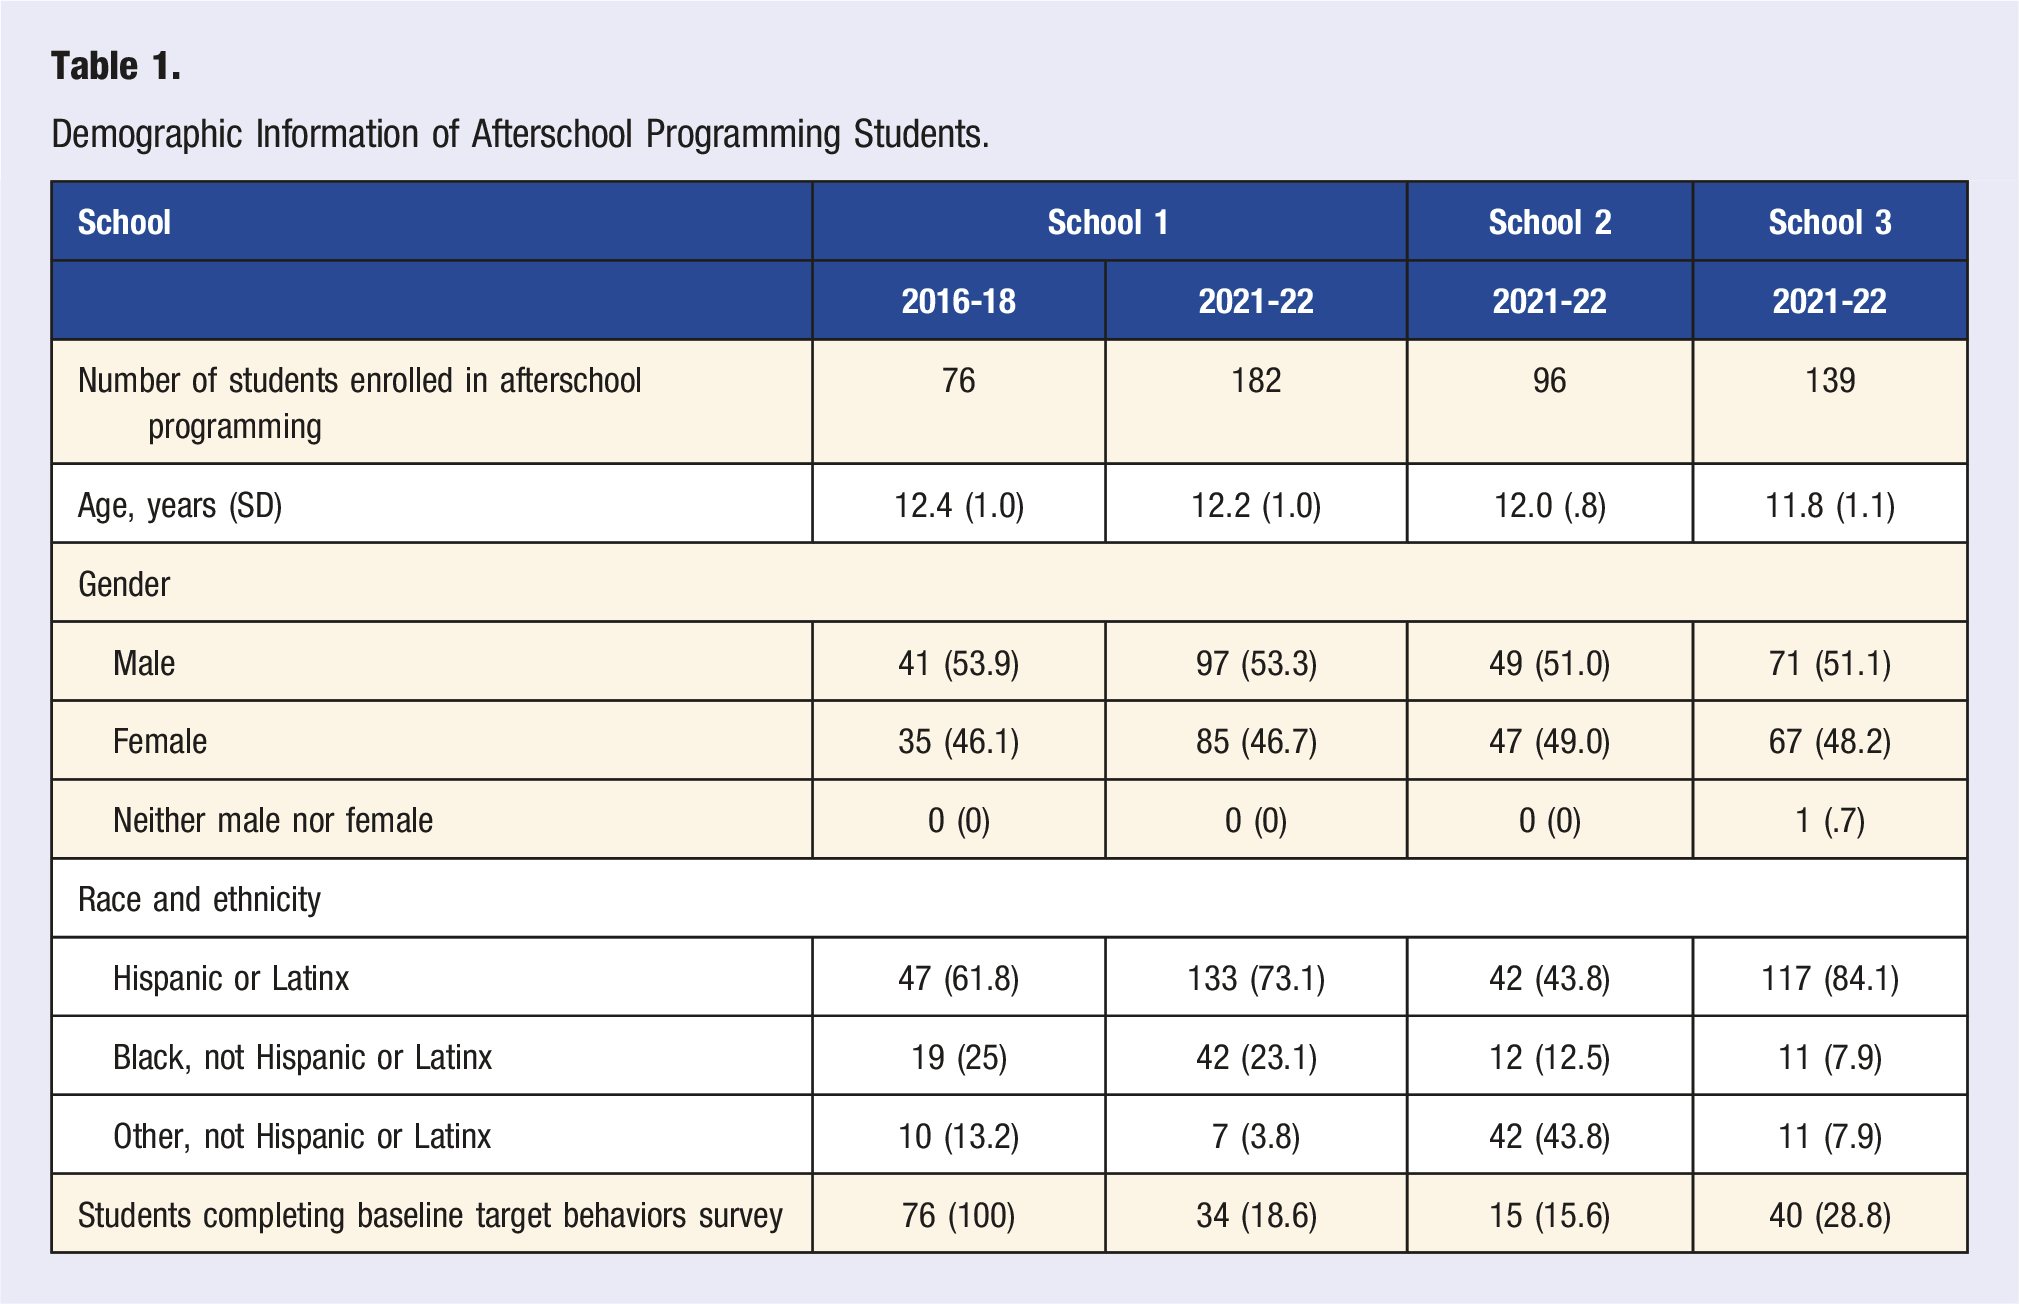
In the pre-COVID-19 cohort, 46% of students were female; among the post-COVID-19 shutdown cohort, 48% were female (P = .969). Among the pre-COVID-19 cohort, 62% were Hispanic or Latino, and 70% were Hispanic or Latino among the post-COVID-19 cohort (P < .0001). The difference in the distribution of demographic characteristics by schools was assessed. No difference was observed among genders; however, there was a difference (P < .0001) in the distribution of race and ethnicity among schools. Specifically, schools 1 (73%) and 3 (84%) had more Hispanic students compared to school 2 (43.8%).
Comparison of Baseline Target Behavior Attainment and PA Hours Completed.
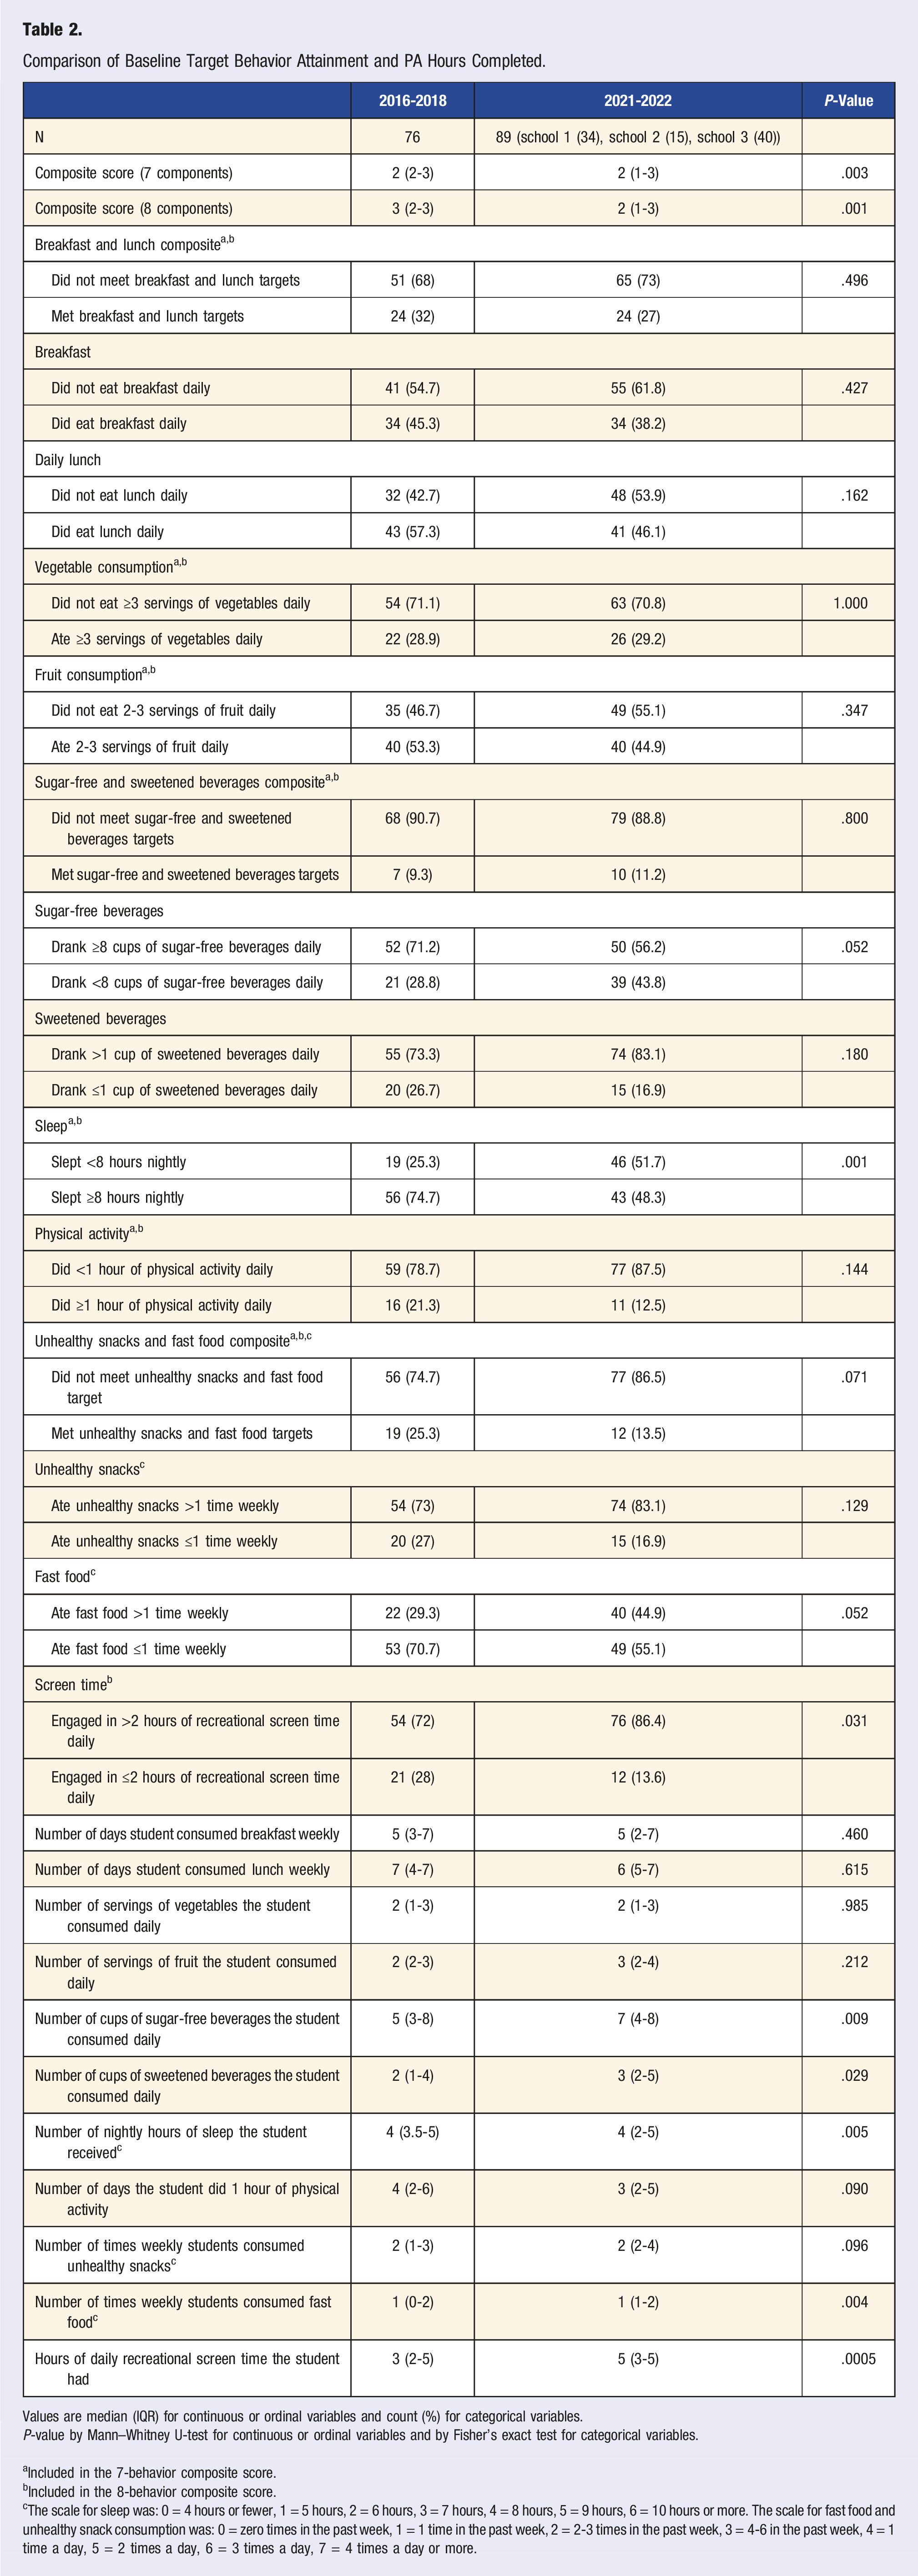
Values are median (IQR) for continuous or ordinal variables and count (%) for categorical variables. P-value by Mann–Whitney U-test for continuous or ordinal variables and by Fisher’s exact test for categorical variables.
aIncluded in the 7-behavior composite score.
bIncluded in the 8-behavior composite score.
cThe scale for sleep was: 0 = 4 hours or fewer, 1 = 5 hours, 2 = 6 hours, 3 = 7 hours, 4 = 8 hours, 5 = 9 hours, 6 = 10 hours or more. The scale for fast food and unhealthy snack consumption was: 0 = zero times in the past week, 1 = 1 time in the past week, 2 = 2-3 times in the past week, 3 = 4-6 in the past week, 4 = 1 time a day, 5 = 2 times a day, 6 = 3 times a day, 7 = 4 times a day or more.
Differences in individual pre- and post-COVID-19 pandemic shutdown lifestyle behaviors at the beginning of the school year were also evaluated (Table 2, Figure 1). From pre- to post-COVID-19 pandemic shutdown, consumption of unsweetened beverages increased from 5 cups daily (IQR = 3-8) to 7 cups daily (IQR 4-8, P = .009), yet consumption of sweetened beverages increased from 2 cups daily (IQR = 1-4) to 3 cups daily (IQR = 2-5, P = .029). There were also statistically significant differences in hours of sleep and fast food consumption frequency. Although the median response was the same between 2 time points, we observed that in post-COVID-19 pandemic shutdown, sleep hours were more skewed to less hours and fast food frequency was skewed to more frequencies (Figure 1). The number of hours of daily screen time students engaged in increased significantly from 3 (IQR 2-5) to 5 (IQR 3-5, P = .0005). The number of self-reported days in which students engaged in an hour of PA trended toward a significant decline from a pre-pandemic of 4 days (IQR 3.5-5) to 3 (IQR 2-5, P = .090). There were no other significant changes between pre- and post-COVID-19 shutdown behaviors. Distribution of target behavior responses across all sites. Legend: BRK = number of days student consumed breakfast weekly; LCH = number of days student consumed lunch weekly; VEG = number of servings of vegetables the student consumed daily; FRT = number of servings of fruit the student consumed daily; SFB = number of cups of sugar-free beverages the student consumed daily; SB = number of cups of sweetened beverages the student consumed daily; SLP = number of nightly hours of sleep the student received; PA = number of days the student did one hour of physical activity; US = number of times weekly students consumed unhealthy snacks; FF = number of times weekly students consumed fast food; STR = number of daily hours spent on recreational screen time, * = P-value .05, ** = P-value .01.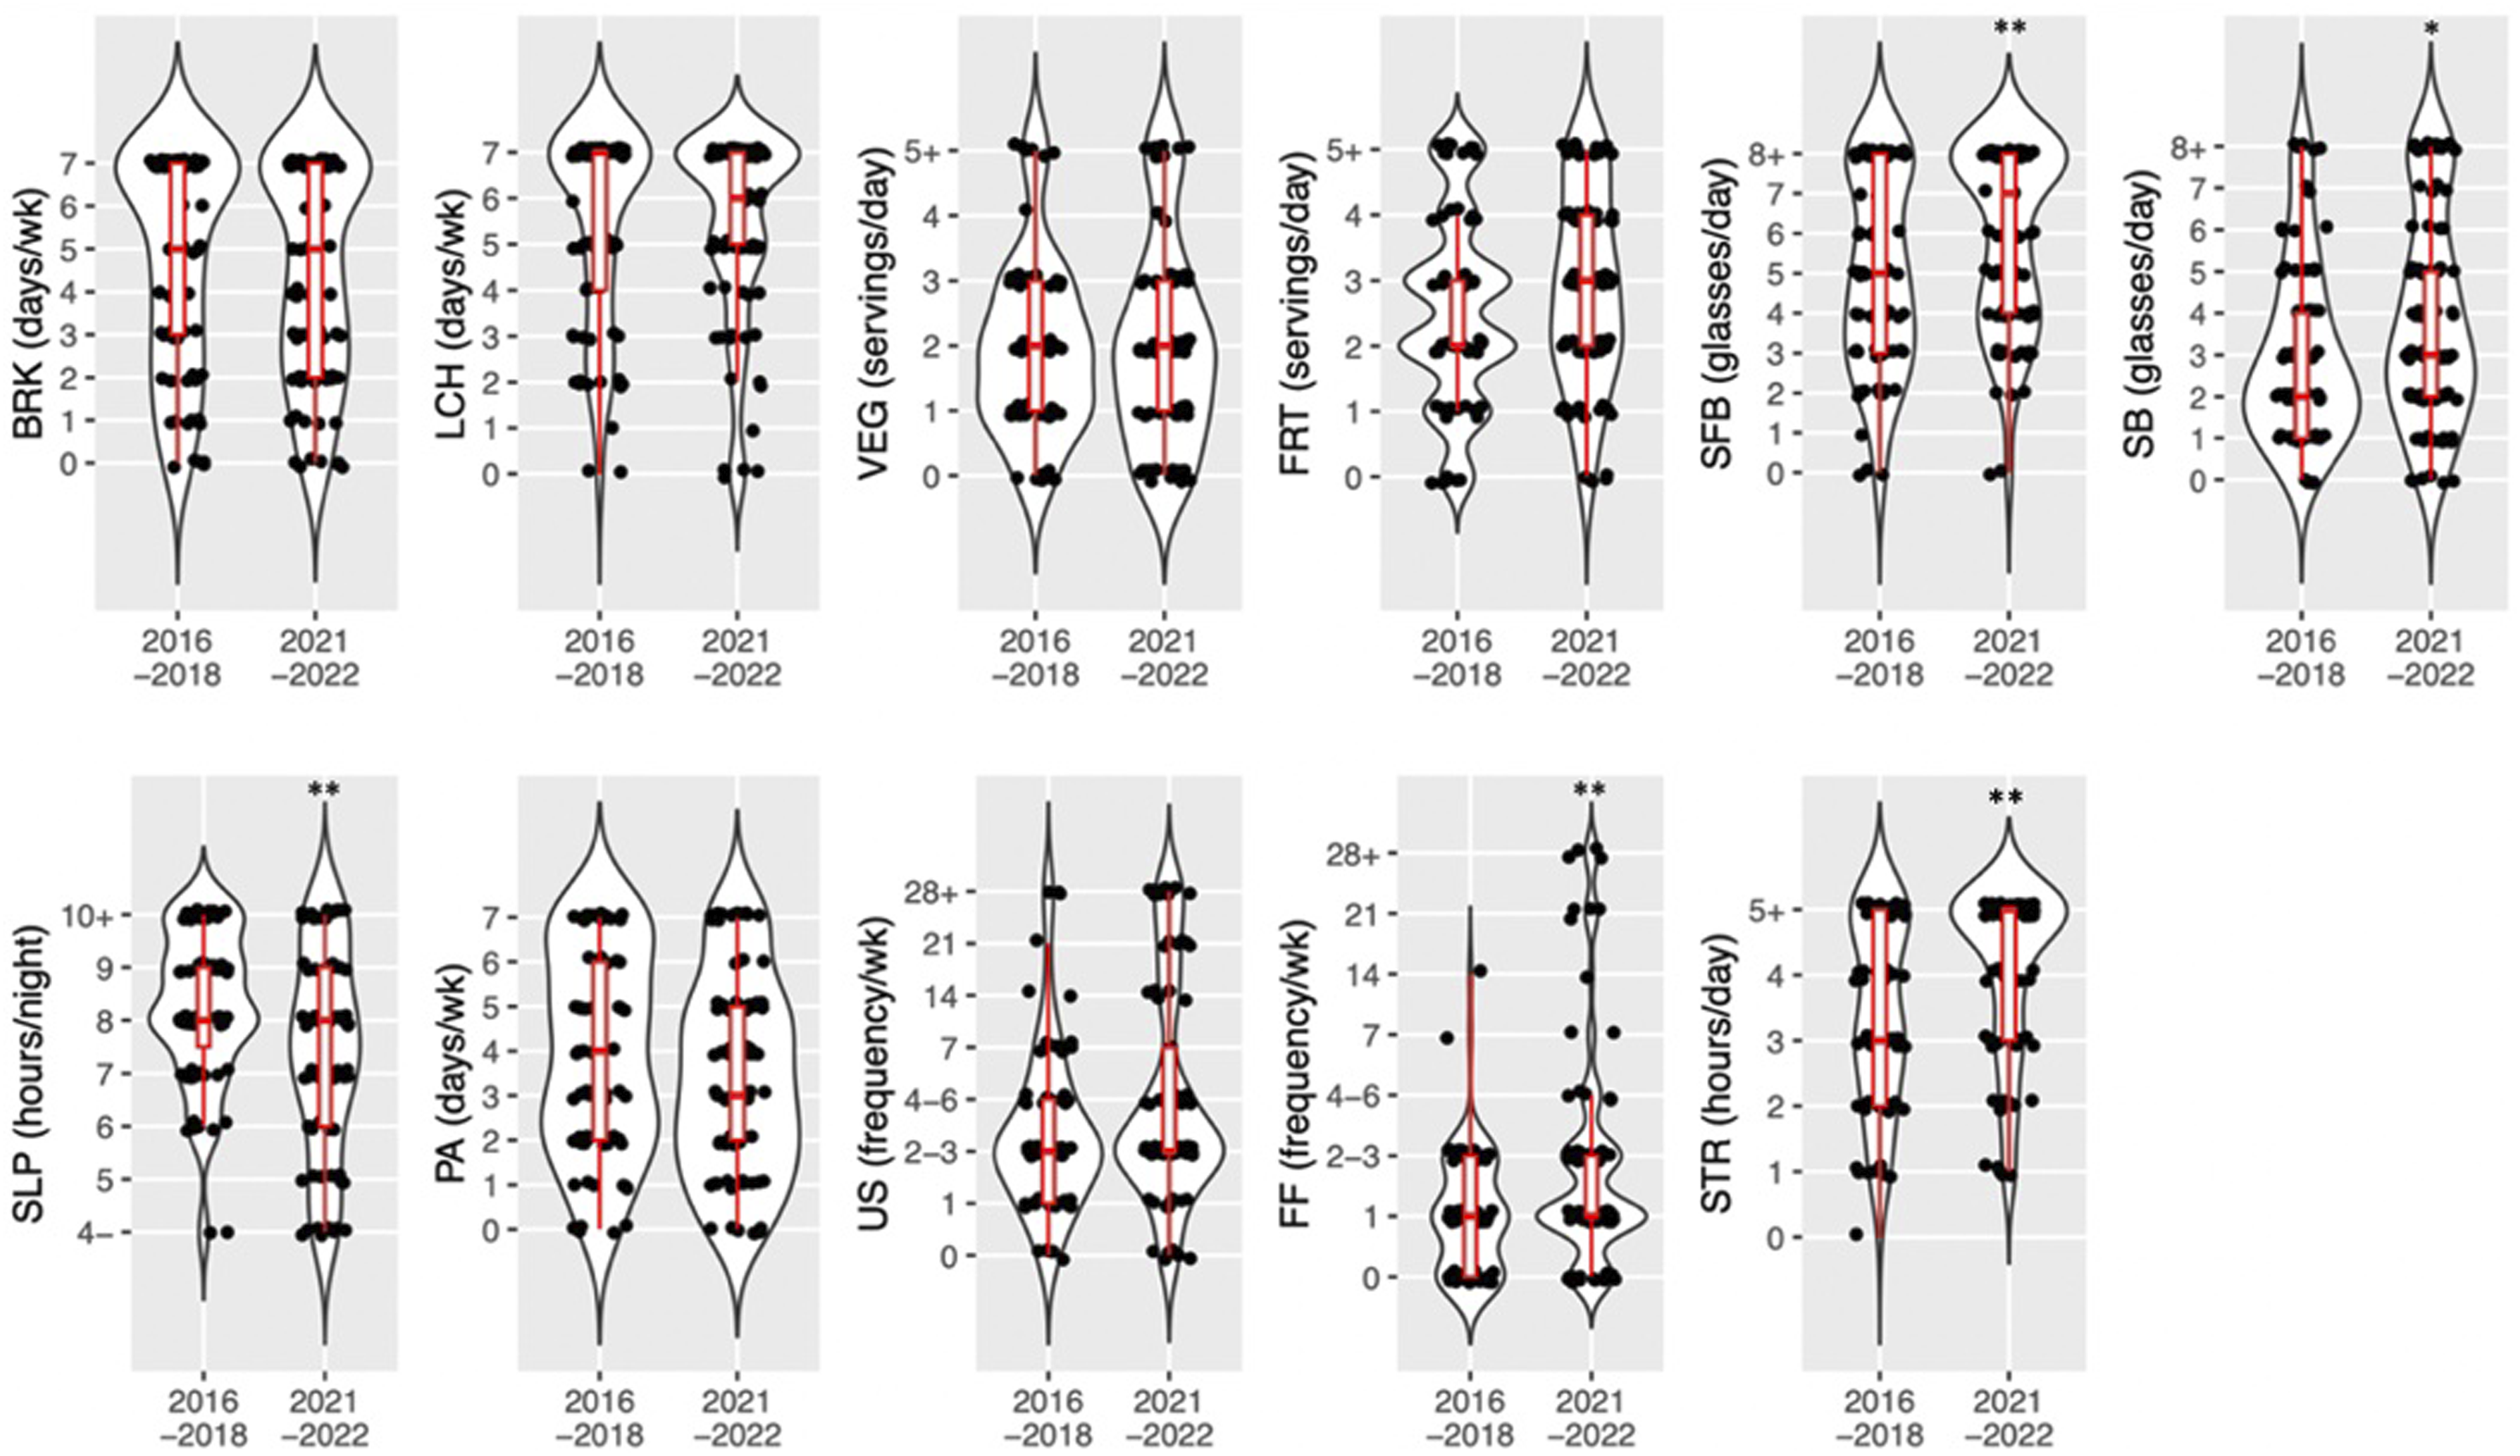
In the pre-pandemic period, 20% of students identified getting 1 hour of PA as their lifestyle behavior goal; post-pandemic shutdown, 12% identified this as their goal. Pre-pandemic, 16% of students identified eating breakfast and lunch daily as their lifestyle behavior goal; post-shutdown, 29% identified this as their goal (Figure 2). Goal target behaviors.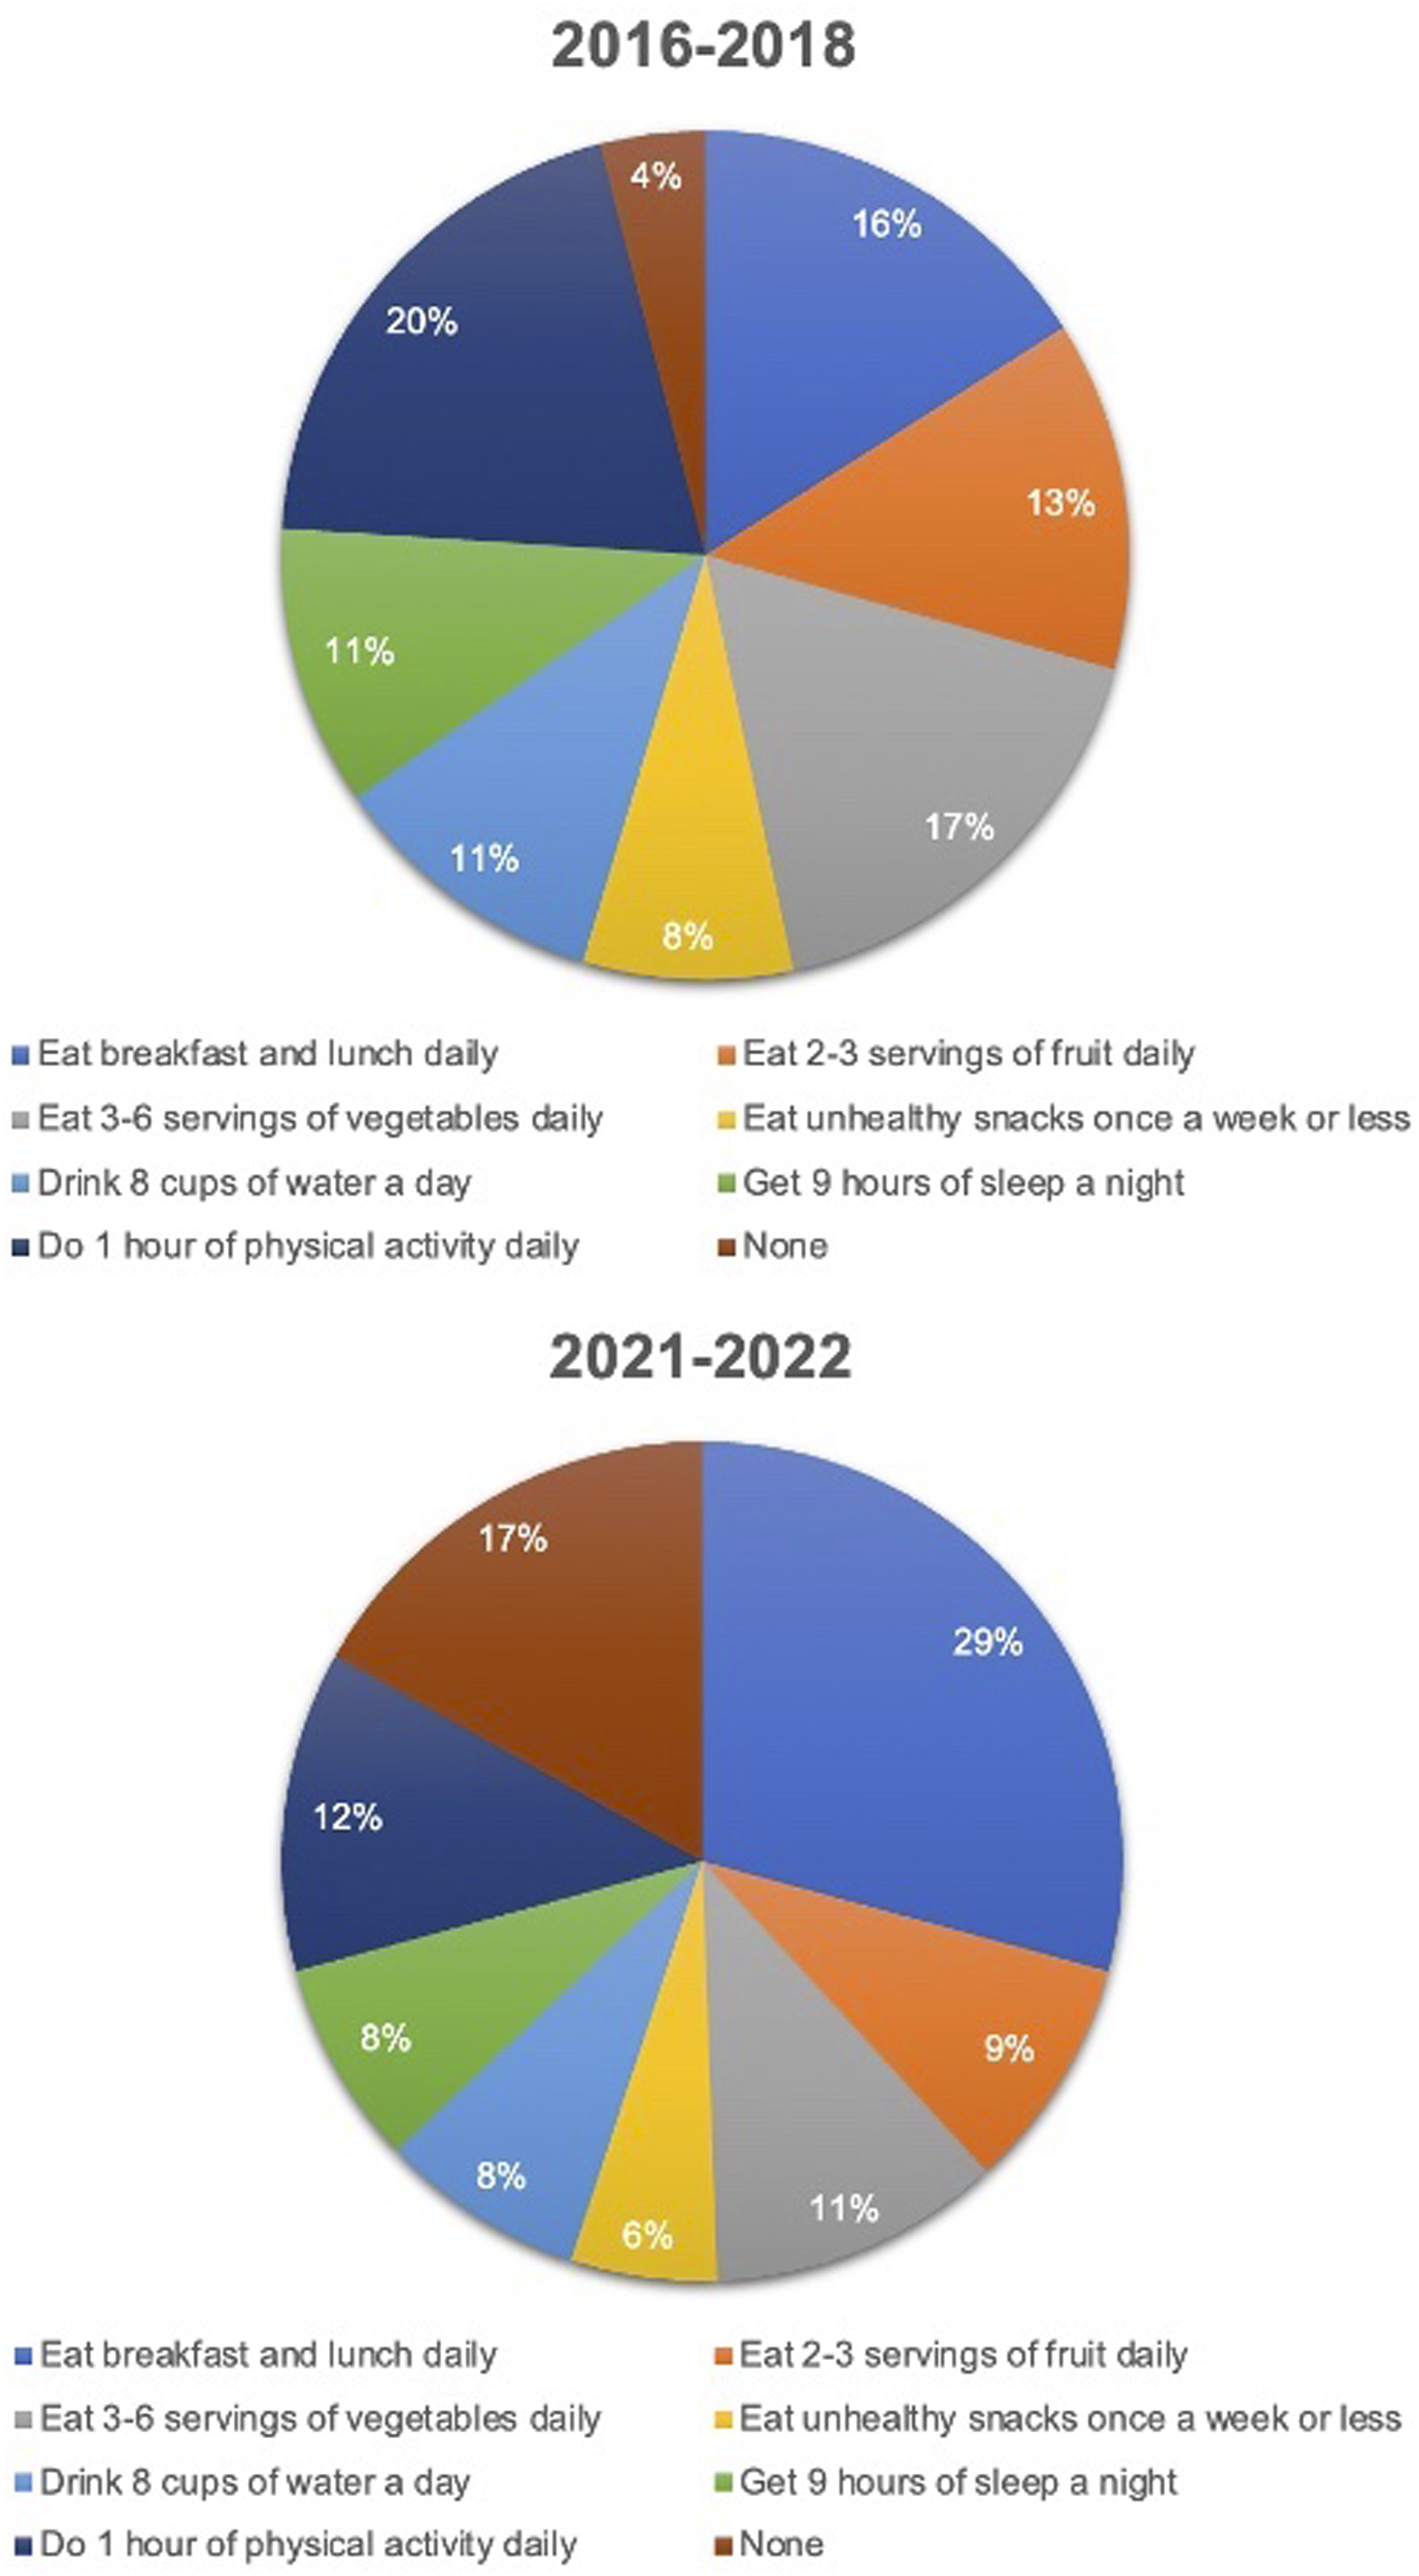
Subgroup Analysis
Comparison of Baseline Target Behavior Attainment and PA Hours Completed, School 1.
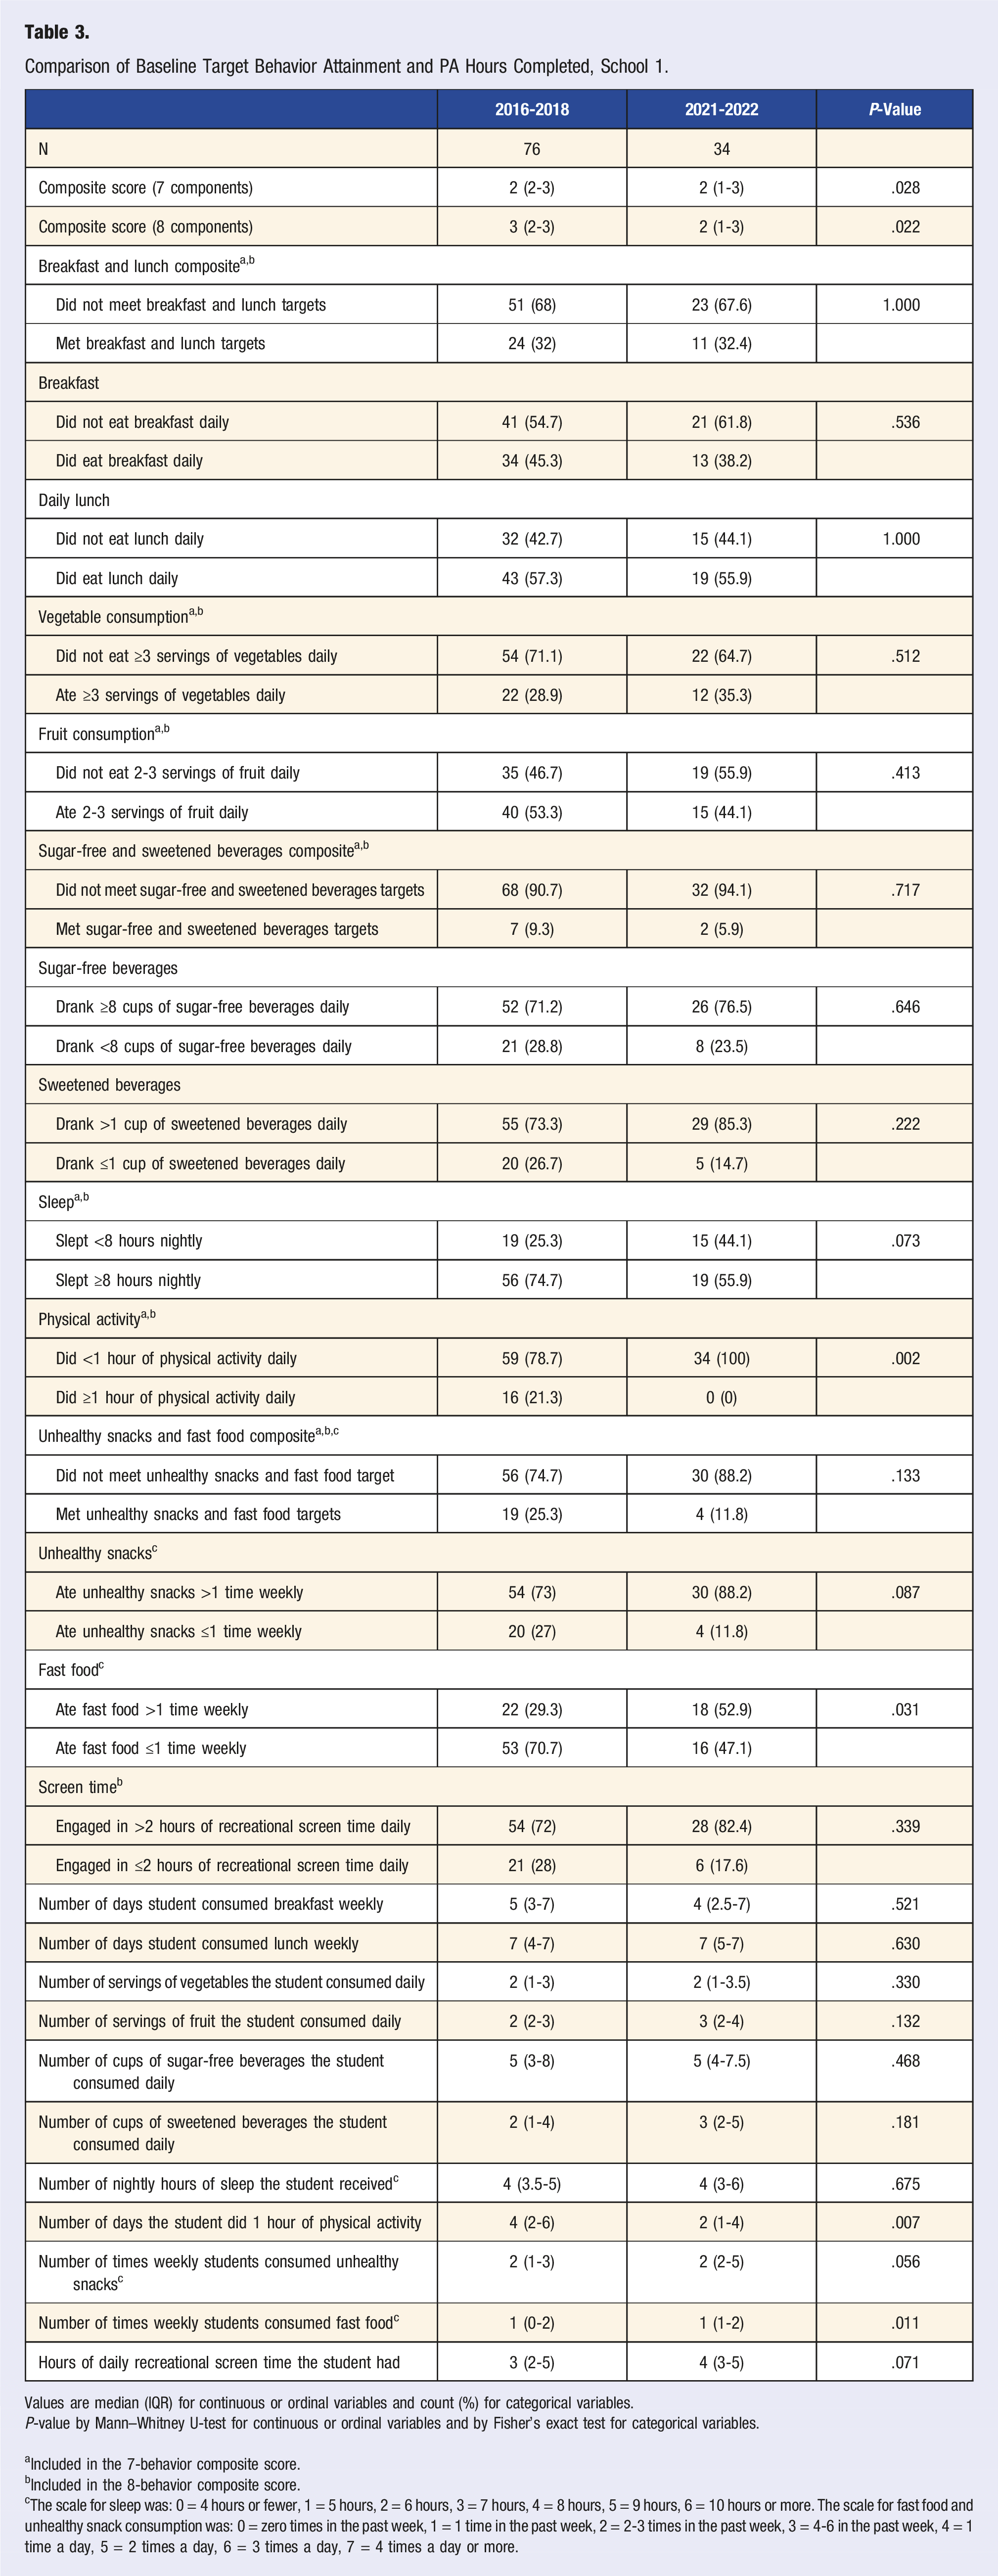
Values are median (IQR) for continuous or ordinal variables and count (%) for categorical variables. P-value by Mann–Whitney U-test for continuous or ordinal variables and by Fisher’s exact test for categorical variables.
aIncluded in the 7-behavior composite score.
bIncluded in the 8-behavior composite score.
cThe scale for sleep was: 0 = 4 hours or fewer, 1 = 5 hours, 2 = 6 hours, 3 = 7 hours, 4 = 8 hours, 5 = 9 hours, 6 = 10 hours or more. The scale for fast food and unhealthy snack consumption was: 0 = zero times in the past week, 1 = 1 time in the past week, 2 = 2-3 times in the past week, 3 = 4-6 in the past week, 4 = 1 time a day, 5 = 2 times a day, 6 = 3 times a day, 7 = 4 times a day or more.
Discussion
The B’N Fit Power program allowed for the tracking of students’ lifestyle behaviors before and after the COVID-19 shutdown. Self-reported lifestyle behavior attainment fell during the COVID-19 pandemic, with median composite scores declining in the post-COVID-19 shutdown cohort compared to the pre-COVID-19 cohort. Additionally, the proportion of students identifying PA as the lifestyle behavior they wanted to improve fell by nearly half. In contrast, the proportion who identified eating daily breakfast and lunch as their goal nearly doubled. A subgroup analysis of 1 school that had received pilot programming demonstrated similar trends in behavior pre- and post-COVID-19 pandemic shutdown, supporting the notion that observed changes were possibly due to the impacts of the pandemic shutdown, rather than differences between school populations.
When examining this data, post-pandemic shutdown, students appeared to drink more water and sweetened beverages, sleep less, engage in higher screen time, and consume fast food more frequently. Additionally, a decline in the number of days participants had an hour of physical activity tended toward a significant decrease, from 4 to 3 days weekly. While consumption of fruits, vegetables, and breakfast/lunch was lower than the goal, no significant pre/post-pandemic shutdown differences in behavior were observed. Similar observations were made in the subgroup analysis, except for changes in sleep and unsweetened beverage consumption.
The rise in childhood inactivity during the COVID-19 pandemic has been previously described in the literature. 14 Regular physical activity and healthy diet behaviors are not only associated with obesity prevention and management in youth but are also critical for maintaining health into adulthood. 22 This study reveals that several behaviors were negatively impacted by the pandemic, including increased utilization of screen time recreationally, increased consumption of fast food and sweetened beverages, and decreased sleep. Additionally, a decline in the number of days participants engaged in 1 hour of daily PA participation trended toward significance.
This study’s backslides in lifestyle behavior attainment underscore the importance of building opportunities to participate in healthy behaviors in children’s environment, including their school and afterschool programming. Declines in PA participation could be due to various factors, including adjusting PA options to be COVID-safe, interruptions in attendance due to personal illness, and scaling back programming compared to pre-pandemic levels. While meeting daily PA recommendations is important in its own right, data show that this goal can also improve other behaviors, such as sleep and screen time.23,24 It is vital to continue to provide robust PA programming to stem any backslide in daily PA participation. Utilizing a composite score, similar to the one developed for the B’N Fit Program, student attainment of behaviors can be summarized and individual behavior changes can be tracked. This will help monitor the efficacy of programming to address the challenges students face in engaging in a healthy lifestyle.
Pre-pandemic, the lifestyle behavior that a significant proportion of students were interested in working toward was participating in 1 hour of daily PA; post-COVID-19 pandemic shutdown, the lifestyle behavior with the most interest was consuming daily breakfast and lunch. However, there was no significant shift in the median number of days students consumed these meals. This observed discrepancy between the desire to consume daily breakfast and lunch without any significant change in the frequency students engaged in this behavior may reflect increasing food insecurity; there was a nearly one-third increase in food insecurity nationwide during the COVID-19 pandemic. 15 Food insecurity and obesity are often coexisting phenomena in low-socioeconomic communities 25 ; it is essential that programming be conscious of this. Alternatively, it is possible that students selected this goal because it seemed attainable due to changes in school lunch programming; since 2017, NYC public schools have offered universal free school lunches. 26 The students who participated in the B’N Fit pilot pre-COVID-19 cohort selected a goal while the roll-out of universal free school lunch was occurring; increased access to school lunch for students taking the survey in the 2021-2022 school year may have influenced their choice.
One limitation of this research is the differential completion of baseline lifestyle behavior surveys pre- and post-pandemic shutdown. All students participating in the pre-COVID-19 cohort completed the lifestyle behaviors survey. However, during the program expansion in the 2021-22 school year, all students participating in afterschool programming received the B’N Fit Power program. While this increased the program’s reach, staffing limitations prevented all students from taking the baseline behaviors survey; consequently, the survey response rate was lower in the post-COVID-19 shutdown cohort than in the pre-COVID-19 cohort. This non-response rate represents a source of bias in our analysis. Additionally, data about the demographics of the schools at large were unavailable, so this research is unable to evaluate how the demographics of students participating in the programming differ from the populations of the schools at large, as the need for and utilization of afterschool programming differs by family. While this limits our ability to generalize our findings to the broader school populations, the consistency of trends in the subgroup analysis and overall analysis in composite scores and in several individual lifestyle behaviors despite ethnic/racial differences suggest the validity of our findings for a more heterogeneous population with a predominantly minority population. Another potential limitation to this research is the reliability of adolescents in providing survey data. However, data from large scale survey-based studies of youth, including the Youth Risk Behaviors Survey conducted by the CDC, have found that such data are reliable and valid.27,28 Finally, though socioeconomic determinants impact access to community resources that contribute to obesity prevention, this study did not survey students about specific socioeconomic barriers such as housing cost burdens or family income below the poverty line. Accordingly, we were unable to evaluate the specific impact that such factors may have on students behaviors at baseline.
Our findings from this real-world program provide insight into how specific obesogenic behaviors can be tracked using simple tracking tools such as a brief lifestyle behavior assessment survey with a multi-component composite score and can guide future programming to help children engage in healthier lifestyle behaviors and reduce their risk of obesity. We have also demonstrated the specific impacts of that COVID-19 pandemic on youth PA, nutrition, and other obesogenic behaviors among students attending afterschool programming. Whether at a single site or multiple sites, knowledge about students baseline attainment of specific health behaviors can be utilized to modify and enhance programming services to impact these lifestyle behaviors.
This research can inform future programming by further investigating participant desires and aligning programming to them. If, as hypothesized, the shift to identifying daily breakfast and lunch as a goal reflects increased food insecurity, then expanding programming that supports food security will likely be beneficial. For example, the sites are currently working to begin hydroponics garden towers; these towers will provide fresh produce to participants, potentially promoting vegetable consumption and reducing burdens created by food insecurity.
Conclusion
Overall, this study found that lifestyle behavior attainment for behaviors related to obesity prevention in youth participating in the B’N Fit program trended toward a significant decline in a post-COVID-19 shutdown cohort compared to a pre-COVID-19 cohort. Consumption of sugar-sweetened beverages and fast food increased, while hours of sleep declined. As programming resumes and expands to additional sites, these insights can increase the number of PA hours offered, provide education on healthy nutrition and sleep habits, and tailor programming to specific student needs.
Footnotes
Acknowledgments
Thank you to our partner schools, Mosholu Montefiore Community Center, and Wellness in the Schools.
Author Contributions
EY contributed to the study design and writing the manuscript. JYM performed the statistical analysis and wrote the results section. VS contributed to the study design, statistical analysis, interpretation, and manuscript editing. PM and JWR contributed to the paper’s study conception, design, and revision. JR contributed to study design, implementation, and oversight of data collection and interpretation, writing and substantively revising the manuscript. All authors have read and agreed to the published version of the manuscript.
Declaration of Conflicting Interests
The author(s) declared no potential conflicts of interest with respect to the research, authorship, and/or publication of this article.
Funding
The author(s) disclosed receipt of the following financial support for the research, authorship, and/or publication of this article: This study was made possible with funding from the Human Resources and Services Administration (HRSA) Healthy Tomorrows Partnership for Children Program grant (PI: Rieder Grant Numbers H17MC29435, H17MC33892, and H17MC40191) and the Life Course Methodology Core (LCMC) of the New York Regional Center for Diabetes Translation Research via a grant from the National Institute of Diabetes and Digestive and Kidney Diseases (grant numbers DK111022–8786 and P30 DK111022). The HRSA funding has provided salary support for JR, JYM, and VS related to study design, analysis, and interpretation of the data and to write the manuscript. The content is solely the responsibility of the authors and does not necessarily represent the official views of the HRSA or National Institutes of Health.
Ethical Statement
Data Availability Statement
The datasets generated during and/or analyzed during the current study are not publicly available. Questions about access can be directed to the study PI, Dr Jessica Rieder (H17MC29435, H17MC33892, and H17MC40191).