
Abstract
Sedentary behaviors, activities spent sitting, or lying down during waking hours, are of significant public health importance. Television-viewing (TV-viewing) hours and total hours sitting are common self-report measures of sedentary behaviors. Given the widespread usage of these measures, the study purpose was to measure the concordance between TV-viewing hours and total hours sitting to determine whether they can be used as interchangeable measures of time spent in sedentary behavior. Using a sample (n = 2687) of workers from a group-randomized control trial, the current study assessed the concordance between weekday total hours sitting and TV-viewing hours. Tertiles were created based on the distribution of total hours sitting and TV-viewing hours. Weighted Kappa (Kappaw) statistics were calculated for the full sample and subgroups. Half of the sample reported 2 to 3 daily hours of TV-viewing hours and the most reported total hours sitting was 8 hours (14%). Kappaw statistics for tertiles of total hours sitting and TV-viewing hours were 0.005 (95% CI = −0.02 to 0.03), indicating little agreement. Kappaw statistics for subgroup analyses (body mass index categories, gender, and intervention assignment) showed poor agreement. Results do not support the use of total hours sitting and TV-viewing hours as interchangeable measures of sedentary behavior.
‘Sedentary behavior is composed of multiple domains . . .’
Sedentary behaviors, activities that do not increase energy expenditure, are activities spent sitting or lying down during waking hours.1,2 Sedentary time has been found to be associated with the risk of multiple adverse health outcomes, including cardiovascular disease (ie, coronary heart disease, angina, fatal and nonfatal myocardial infarction, stroke), obesity, metabolic syndrome, hypertension,1,3-9 and overall mortality.3-5 Sedentary behaviors appear to be highly prevalent in the US population. Self-report data from the 2005-2006 National Health and Nutrition Examination Survey (NHANES) showed that 67.5% of American adults spend at least 2 hours or more watching television per day and 25.2% use computers outside of work or play video games for 2 or more hours per day. 10 When measured objectively by accelerometers worn consecutively for 7 days during waking hours, NHANES 2003-2004 and 2005-2006 data show that adult participants (age 20-85 years) spent an average of 8.44 hours daily in sedentary behaviors. 11
Sedentary behavior is composed of multiple domains (eg, hours watching television, working or playing on a computer, time spent in transit, workplace sitting, talking with friends, etc) and has been quantified using both subjective measures (eg, self-report data) and objective measures (eg, accelerometers). Because of cost and participant burden, self-report measures have been used to measure sedentary behavior for population-based research.3-8,10,12-14 Common self-report measures of sedentary behavior include questionnaires assessing time spent in sedentary behavior measured in continuous hours and categories of hours for typical weekdays/weekend days, past 7 days, and past month, as well as 24-hour recalls, time use diaries, and behavioral logs.3-9,10,12-14 Objective measures of sedentary behavior include the use of accelerometers, heart rate monitors, and other electronic monitors.1,5,9,11,13-19 Among subjective measures, television-viewing (TV-viewing) hours and total hours sitting questionnaires are the most frequently used measures to represent time spent in sedentary behavior. However, TV-viewing time13-17 and total hours sitting13,14,18,19 has been found to have poor and poor to moderate agreement with objectively measured sedentary time, respectively.
Additionally, TV-viewing hours and total hours sitting may not capture similar information regarding time spent in sedentary behaviors since TV-viewing is an activity specific measure and total hours sitting represent multiple activities (eg, TV-viewing, computer time, reading, etc). To our knowledge, it is unknown whether TV-viewing hours and total hours sitting are highly correlated. In other words, will individuals who are classified as sedentary using one measure also be classified as sedentary using the other measure? If the answer is no, using either of the 2 measures to individually represent total sedentary behavior may lead to inaccurate estimates of not only the population prevalence of sedentary behaviors but also of the magnitude and/or direction of the association between sedentary behaviors and morbidity and mortality.
To test the assumption that TV-viewing hours and total hours sitting can both be used to represent sedentary behavior interchangeably, we used previously collected data from a group randomized trial to compare measurements of sedentary behavior by total hours sitting and TV-viewing hours. We hypothesized that total hours sitting and TV-viewing hours will identify the same participants as sedentary and can be used interchangeably to represent sedentary behavior.
Methods
Study Population
Data were obtained from the Images of a Healthy Worksite study, a worksite-randomized trial conducted in a single corporation with multiple sites in Northeastern United States. Ten worksites were randomized to a multiple component (eg, nutrition, physical activity, and sedentary behavior) environmental intervention to prevent weight gain and no intervention. Data were collected from 2 cross-sectional samples of employees, one at baseline (February to October 2006) and another at postintervention (January to June 2009). Additional details have been published elsewhere.20,21 The current study consists of a subsample of 2687 employees with complete data for sedentary behavior, weight, and height. Demographic data were self-reported via paper survey. The subsample consisted of participants in both the control and intervention groups as well as those at baseline and postintervention. If a participant had measurements at baseline and postintervention, only the baseline time point was used in the current analyses. All procedures were approved by the institutional review board at the University of Rochester Medical Center; all employees who participated in baseline and postintervention measurements provided written informed consent.
Measures
To measure the sedentary behavior construct 2 questionnaires were used. TV-viewing hours per day was self-reported by participants (“How many hours do you watch television each day?”) and answer options included 5 distinct categories (1 hour or less, 2-3 hours, 4-5 hours, 6-7 hours, and 8 or more hours). Self-reported TV-viewing as a means to measure sedentary behavior has shown good reliability (mean intraclass correlation coefficient = 0.61, 95% CI = 0.55-0.68) but weak validity (ρ = 0.30, P < .01).12,22 Total hours sitting on a typical weekday came from the sitting item from the International Physical Activity Questionnaire (IPAQ-Short) that asks “During the past 7 days, how much time did you usually spend sitting on a weekday?” 23 Participants answered the total hours and minutes spent sitting on a weekday, which was operationalized into total hours sitting on a weekday. The IPAQ-Short has shown good reliability (pooled ρ = 0.76, 95% CI = 0.73-0.77), weak criterion validity (pooled ρ = 0.30, 95% CI = 0.23-0.36), and good concurrent validity (pooled ρ = 0.58, 95% CI = 0.51-0.64) and has been tested in multiple populations.24,25 Other measures used in the study are weight and height, which were measured in a private area, with employees wearing street clothing and no shoes. A Tanita electronic scale was used to measure employees’ weight (in kilograms) and a Shorr stadiometer was used to measure height (to the nearest 0.1 cm). Body mass index (BMI) was calculated as weight (kilograms)/height (meters)2. BMI was categorized as healthy weight (BMI < 25 kg/m2), overweight (BMI 25-29.9 kg/m2), and obese (BMI ≥ 30 kg/m2).
Statistical Analyses
We ran descriptive statistics for participant characteristics, including frequency tables for our main variables of interest. Improbable values for BMI (2 participants with BMI values plus or minus 3 standard deviations from the mean) were considered outliers and we excluded them from our analyses. To explore the concordance between the TV-viewing hours and the total hours sitting measures, we created 3 different groupings of total hours sitting and TV-viewing hours (ie, 5 matching categories, quintiles, and tertiles). First we categorized total hours sitting into categories to match the number of categories of TV-viewing hours (5 categories of hours of TV-viewing as described in the Measures section). This resulted in 5 matched categories of total hours sitting, including (1) 1 hour or less (n = 61, 2.3%), (2) 2-3 hours (n = 369, 13.7%), (3) 4-5 hours (n = 472, 17.6%), (4) 6-7 hours (n = 502, 18.7%), and (5) 8-15 hours (n = 1283, 47.8%). Next we created quintiles of total hours sitting so that approximately 20% of the sample was in each category resulting in the following quintiles of total hours sitting: (1) 3 hours or less (n = 430, 16.0%), (2) 4-5 hours (n = 472, 17.6%), (3) 6-7 hours (n = 502, 18.7%), (4) 8-9 hours (n = 540, 20.1%), and (5) 10-15 hours (n = 743, 27.7%). Finally, we collapsed the total hours sitting into tertiles (eg, 33% of the sample in each category) to increase the number of participants in each grouping. This resulted in tertiles of total hours sitting, including (1) 5 hours or less (n = 902, 33.6%), (2) 6-8 hours (n = 873, 32.5%), and (3) 9-15 hours (n = 912, 33.9%). We also collapsed TV-viewing hours into 3 categories to match the sample distribution of total hours sitting: (1) 1 hour or less (n = 889, 33.1%), (2) 2-3 hours (n = 1499, 55.8%), and (3) 4 hours and more (n = 299, 11.1%). Given the distribution of answers in the TV-viewing hours we were unable to create exact tertiles as more than half of the sample had endorsed the category of 2-3 hours.
To measure the concordance between our 3 different groupings of total hours sitting and TV-viewing hours, we performed weighted Kappa statistics. This analysis is suggested for ordinal scale as the weighted Kappa will adjust for the degree of disagreement between the 2 measures. 26 Concordance was also tested by BMI groups and gender, as prior research has shown differences in time spent in sedentary behavior based on these characteristics.8,27 Additionally, we examined concordance by intervention and control groups as 20% (n = 526) of the total observations used in the current study were from the post-intervention data collection and 70.5% (n = 371) of the postintervention observations were exposed to the intervention. Furthermore, we graphically examined the distribution of total hours sitting by TV-viewing hours. All analyses were conducted in SAS 9.2 (SAS Institute, Cary, NC).
Results
Sample characteristics are found in Table 1. Of the respondents, more than half were men (61.8%) and the sample had a mean age of 47.8 years (SD = 7.4). More than three quarters of participants were married and approximately 60% had an annual income of more than $60 000. The majority of respondents were college educated (62.2%) and nonsmokers (64.3%). The mean BMI was 28.4 kg/m2 (SD = 5.3) and more than two-thirds were overweight or obese (72.2%). Over half of the participants reported watching between 2 and 3 hours of television per day (55.8%) and the most reported total hours sitting value was 8 hours per typical weekday (13.8%). Eighty percent of the participants (n = 2,161) were from baseline data collection with the remaining having postintervention data (n = 526, 19.6%).
Sample Characteristics (N = 2687).
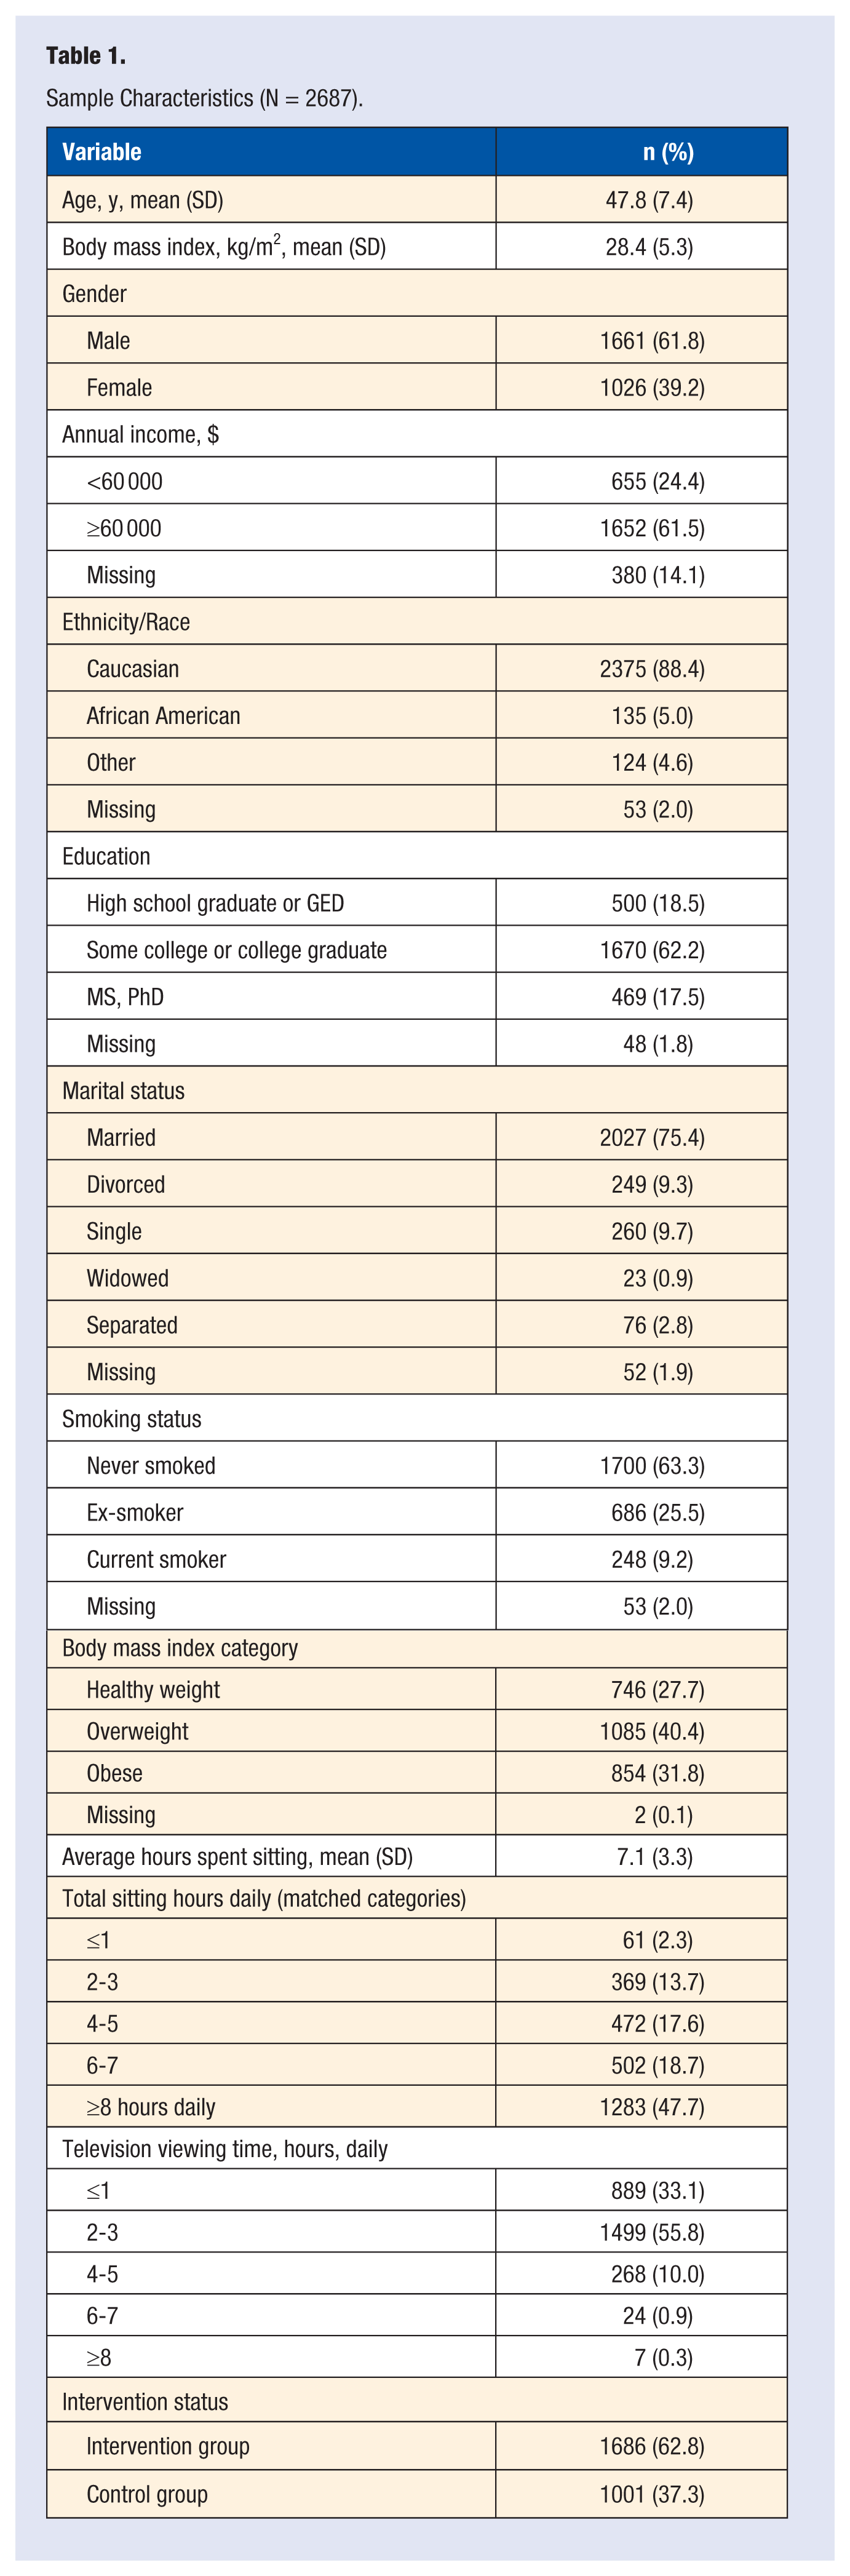
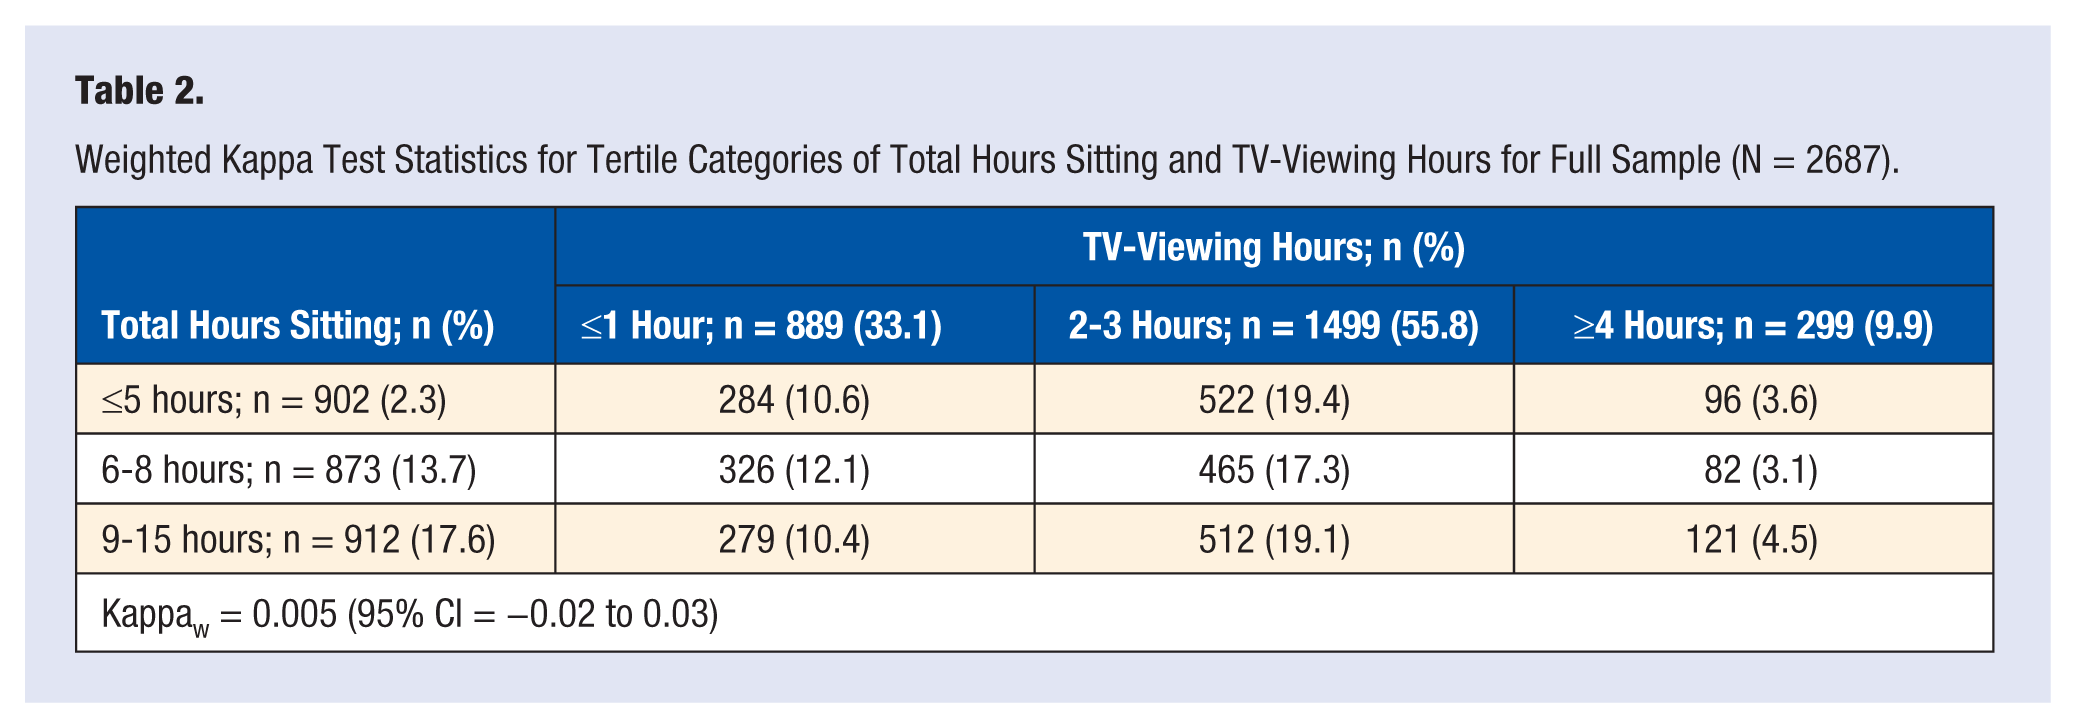
TV-viewing hours included 5 categories: 1 hour or less (n = 889, 33.1%), 2-3 hours (n = 1499, 55.8%), 4-5 hours (n = 268, 10.0%), 6-7 hours (n = 24, 0.9%), and 8 or more hours (n = 7, 0.3%). Almost 99% of the sample reported TV-viewing hours of 5 hours or less, with the remaining participants reporting TV-viewing hours of 6 or more hours per day. Total hours sitting ranged from a minimum of 0 hours to a maximum of 15 hours (mean = 7.1, SD = 3.3). Weighted Kappa statistic for the 5 matching categories and the quintiles of total hours sitting and TV-viewing hours were 0.009 (95% CI = 0.004-0.01) and 0.001 (95% CI = −0.01 to 0.01), respectively, indicating little agreement. Weighted Kappa statistics for tertiles also indicated poor agreement (Kappaw = 0.005, 95% CI = −0.02 to 0.03). Given the small numbers of participants in each category in the five matching categories and quintiles, we present only the data for the tertile analyses (see Table 2).
Weighted Kappa Test Statistics for Tertile Categories of Total Hours Sitting and TV-Viewing Hours for Full Sample (N = 2687).
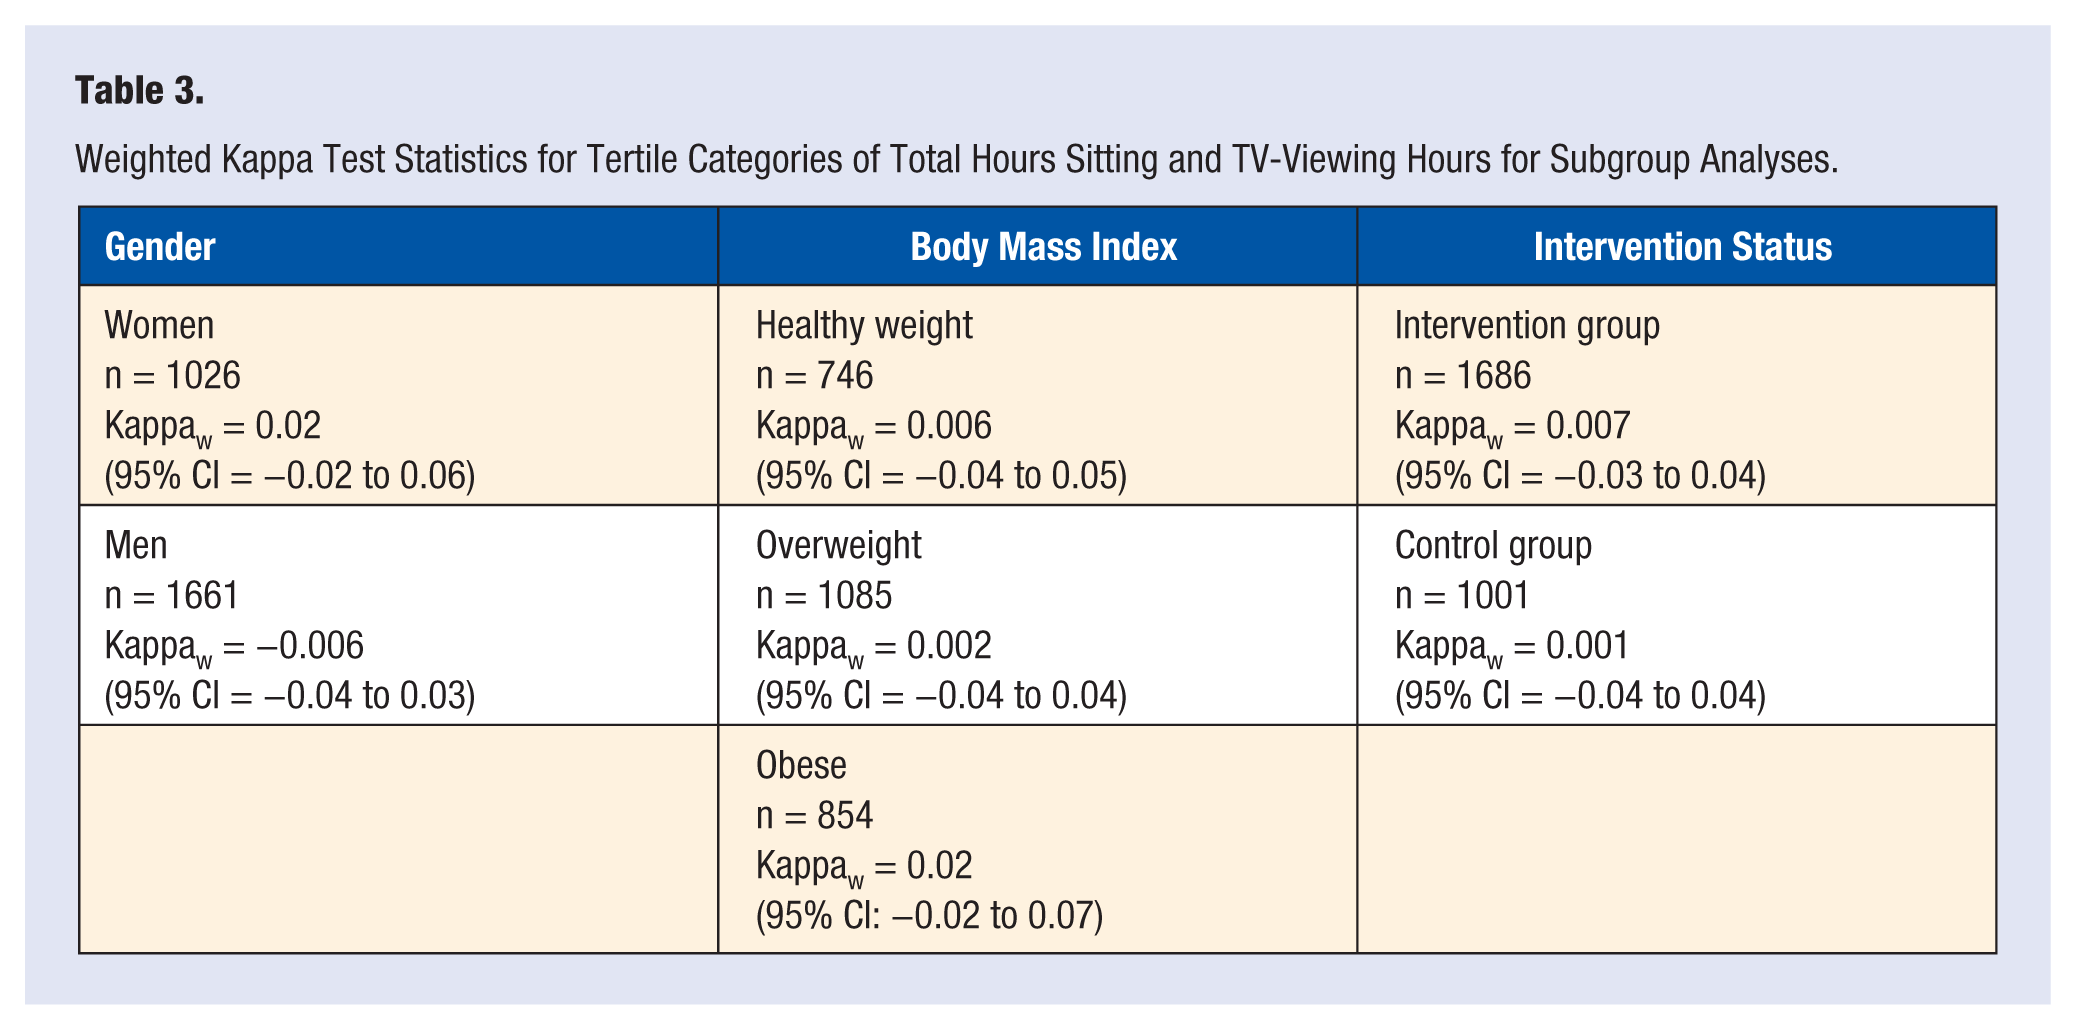
To evaluate potential differences within subgroups, we used BMI group (healthy weight, overweight, and obese), gender (men and women), and intervention status (intervention group and control group) to explore additional concordance measures. As with the full sample, we calculated weighted Kappa statistics for five matching categories, quintiles, and tertiles of total hours sitting and TV-viewing hours. Results indicated little concordance among all subgroup analyses. As with the full sample, we present only the tertile analyses (Table 3).
Weighted Kappa Test Statistics for Tertile Categories of Total Hours Sitting and TV-Viewing Hours for Subgroup Analyses.
The distribution of total hours sitting by TV-viewing hours categories has a similar central tendency and variability regardless of the category (Figure 1). For example, employees reporting 0-1 hours of TV-viewing hours reported a mean of 6.7 total hours sitting per day, whereas those who watch 2-3 hours sit an average of 6.8 hours and those that watch 4+ hours of TV-viewing hours sit an average of 7.3 hours per day (data not shown).
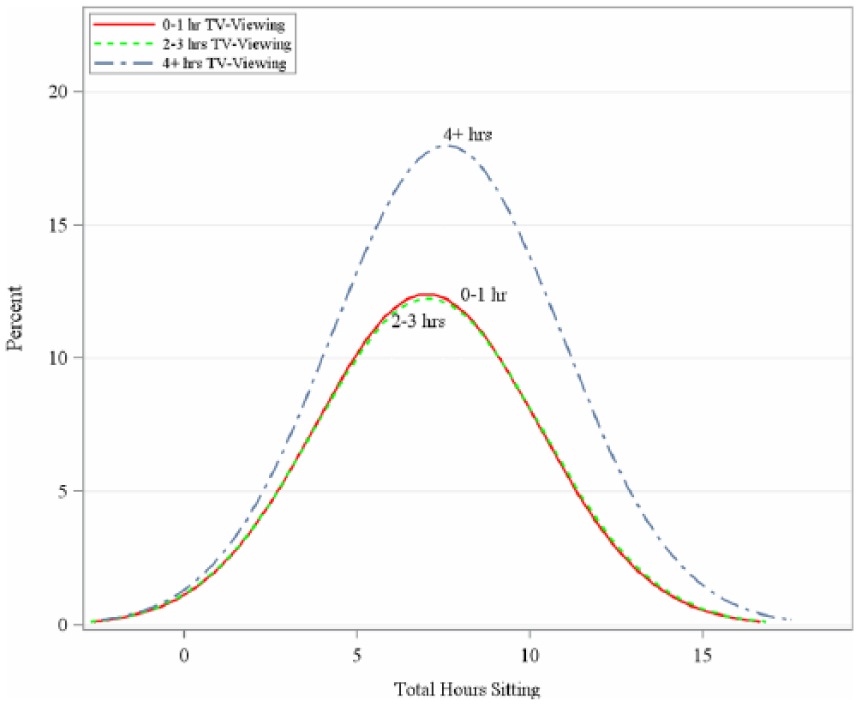
Distribution of total hours sitting by TV-viewing categories.
Discussion
This study investigated the concordance between TV-viewing hours and total hours sitting to determine whether the 2 measures can be used interchangeably to represent time spent in sedentary behavior to estimate population levels and study the contribution of sedentary behavior to morbidity and mortality. We hypothesized that the 2 measures would identify the same workers as sedentary or not sedentary. We conducted weighted Kappa statistics to determine the level of agreement between total hours sitting and TV-viewing hours and found poor agreement. Based on our findings, we suggest that the 2 measures cannot be used interchangeably to represent sedentary behavior.
Sedentary behavior is a complex behavior pattern with a number of components over and above single-item self-report measures of TV-viewing hours or total hours sitting. Our findings suggest that by using one of the measures, some workers in our sample would have been identified as sedentary, while with the other measure, the same workers may have been identified as not sedentary. A possible explanation for the lack of concordance between the 2 measures may include the time and/or domain captured in the actual question. The TV-viewing hours question asks about how many hours are spent watching TV each day (“How many hours do you watch television each day?”) while the IPAQ-Short question asks how many hours are spent sitting on a typical weekday (“During the past 7 days, how much time did you usually spend sitting on a weekday?”). If individuals have an office job as opposed to a more physically active job, they are more likely to report more total hours sitting but may not watch much television. For example, someone may endorse sitting for over 8 hours each day, but only watching television for 1 hour. In that case, if the TV-viewing hours question were the only one used to capture sedentary behavior, sedentary behavior would be underestimated. It would also be the case if individuals endorse sitting for more than 8 hours each day, but they also watch 5 or more hours of TV. The TV-viewing hours question would correctly characterize this person as sedentary but would equally underestimate its magnitude. Our results may explain differences in estimates of sedentary behavior in populations and in the magnitude and/or direction of the association between sedentary behaviors and measures of morbidity and mortality assessed by these 2 measures. In addition, validation studies suggest that both measures do not characterize the totality of sedentary behavior when compared with objective measures.
Validation studies using TV-viewing hours as a self-report measure shows poor concurrent validity compared with objective measures of sedentary behavior.17,27 Poor concurrent validity has been reported when self-reported TV-viewing hours was a single marker of self-reported sedentary behavior when compared with a 4-day heart rate monitor (r = −0.19, P < .05). 17 When measuring the criterion validity of TV-viewing hours from the Sedentary Behavior Questionnaire (SBQ), which measures 9 domains of sedentary behavior, with accelerometer data (accelerometer minutes with counts less than 100), correlation values between the 2 measures are quite low, r = −0.001 (P = .99) and r = 0.12 (P = .04) for men and women, respectively. 27
Validation studies using total hours sitting as a self-report measure show moderate validity.18,28 A study measuring total workplace sitting found weak to moderate validity between self-reported sitting time and accelerometer sedentary time (r = 0.39, 95% CI = 0.22-0.53). 29 Another study, which explored the reliability, validity, and responsiveness of subjective and objective measures of sedentary behavior found that workers had stronger correlations between the past-day recall of sedentary behavior (subjective measure) and an inclinometer (activPAL; objective measure) compared with nonworkers (r = 0.64, 95% CI = 0.40-0.80; r = 0.40, 95% CI = 0.08-0.64, respectively). 18
A more complete manner of measuring sedentary behavior using self-report measures may include quantifying all leisure domains (eg, time spent on computers, reading, and playing video games) and nonleisure domains such as time spent sitting during transit of workplace sitting.3-9 Stronger validity values are found for self-report questionnaires and time-use surveys assessing more multiple domains sedentary behaviors and analyzing the domains together as one comprehensive marker of sedentary behavior.9,30 A study assessing the validity between the Past-day Adults’ Sedentary Time–University (PAST-U) and accelerometer use showed strong validity (intraclass correlation coefficient = 0.64). 30 The PAST-U is a self-report questionnaire that assesses a variety of sedentary behavior, including time spent sitting or lying down for work, study, travel, television viewing, leisure time computer use, reading, eating, socializing, and other sedentary daily activities. 30 In another study, investigating multiple domains of sedentary behavior, using time-use diaries of 5 sedentary behaviors, including nonoccupational, occupational, household, leisure, and transportation activities compared with accelerometers, results showed moderate to strong validity (r = 0.57-0.59). 9
A strength of the current study includes the large sample of participants with complete data for both TV-viewing hours and total hours sitting and the ability to explore potential gender and BMI differences. A limitation of the current study is the inability to determine whether TV-viewing hours and total hours sitting would have had better concordance on a weekend day when participants may report different amounts of time in each behavior. It is likely that workers spend more than half of their typical workday sitting while they may not have such constraints on weekends or days in which they are not working. 31 Another limitation is that the study measured concordance between a categorical measure of TV-viewing hours and a continuous measure of total hours sitting. Given the categorical nature of the data, we had a smaller sample size in some of the categories which may have implications in our analysis. Therefore, the lack of agreement may be influenced by how the data were collected and analyzed. However, given the multiple ways in which we categorized the continuous measure, it is likely that the findings would not differ if both measures had been collected as continuous data. Additionally, given that the current study only used workers to explore the agreement between the 2 measures of sedentary behavior, generalizability to the population of nonworkers is limited. In general, self-report data of single domains of sedentary behavior (eg, TV-viewing hours and total hours sitting) are less accurate than self-report data on multiple domains of sedentary behavior. Nonetheless, objective measures of sedentary behavior are more accurate measures of sedentary behavior given their ability to overcome issues of recall and social desirability.
The results of this study suggest that TV-viewing hours and total hours sitting cannot be used interchangeably to represent time spent in sedentary behavior in a sample of workers. TV-viewing hours is a very specific activity capturing mostly leisure time while total hours sitting involves both leisure and nonleisure time. Based on the findings of our study, we caution on the use of these measures as interchangeable items of sedentary behavior in future research.
Footnotes
Acknowledgements
We thank the employees, the company management, and the members of the employee advisory boards for their participation in and contribution to the study. We also acknowledge Kristine DiBitetto and all the Images of a Healthy Worksite staff for their quality fieldwork.
Authors’ Note
The current article was presented as a moderated poster at the annual meeting of the American Heart Association: Epidemiology and Prevention/Nutrition. Physical Activity and Metabolism Division in San Francisco, CA (March 2014; 5T32HL007937-14 (Lowenstein, PI).
Declaration of Conflicting Interests
The author(s) disclosed receipt of the following financial support for the research, authorship, and/or publication of this article.
Funding
The Images of a Healthy Worksite study was supported by the National Heart, Lung, and Blood Institute (grant R01HL079511).