
Abstract
The obesity paradox for survival among individuals with type 2 diabetes has been observed in some but not all studies. Conflicting evidence for the role of overweight and obesity in all-cause mortality may largely be a result of differences in study populations, epidemiological methods, and statistical analysis. For example, analyses among populations with long-term prevalent diabetes and the accrual of other chronic health conditions are more likely to observe that the sickest participants have lower body weights, and therefore, relative to normal weight, overweight and even obesity appear advantageous. Other mortality risk factors, such as smoking, also confound the relationship between body weight and survival, but this behavior varies widely in intensity and duration, making it difficult to assess and effectively adjust for in statistical models. Disentangling the potential sources of bias is imperative in understanding the relevance of excess body weight to mortality in diabetes. In this review, we summarize methodological considerations underlying the observed obesity paradox. Based on the available evidence, we conclude that the obesity paradox is likely an artifact of biases, and once these are accounted for, it is evident that compared with normal body weight, excess body weight is associated with a greater mortality risk.
‘Although seemingly straightforward, comparing survival rates across the wide spectrum of body weights is complex for several reasons related to study population characteristics, epidemiological methods, and data analysis.’
Introduction
In the past decade, there have been conflicting reports about the relationship of excess adiposity with all-cause mortality among individuals with type 2 diabetes, with some studies showing that overweight (body mass index [BMI] = 25.0-29.9 kg/m2) and obese (BMI ≥ 30 kg/m2) individuals have significantly better survival than those of normal weight (BMI = 18.5-24.9 kg/m2). These findings have emerged despite well-documented evidence implicating excess weight in numerous adverse cardiometabolic outcomes. This so-called obesity paradox has been observed in a number of studies, but not all, fueling controversy over the relevance of body weight to survival among patients with diabetes.
Approximately 85% of Americans living with type 2 diabetes are overweight or obese, and more than half are obese. 1 Therefore, it is critical to understand the importance of excess body weight among those with diabetes. Although seemingly straightforward, comparing survival rates across the wide spectrum of body weights is complex for several reasons related to study population characteristics, epidemiological methods, and data analysis. Associations between body weight and survival in type 2 diabetes can be divergent, including inverse2-7 and nonlinear or U-shaped8-15 when key methodological limitations are not, or only partially, accounted for. Exonerating overweight and obesity as contributors to poor survival is misleading. In fact, studies in which the methodological limitations are addressed refute the presence of an obesity paradox, indicating that a normal body weight (BMI = 18.5-24.9 kg/m2) is optimal for survival among those with type 2 diabetes.16,17
Epidemiological Studies of Body Weight and Mortality in Diabetes
Previous observational studies of body weight and mortality among participants with diabetes have yielded mix findings, with some supportive of an obesity paradox, indicating that compared with normal weight (BMI = 18.5-24.9 kg/m2), overweight (BMI = 25.0-29.9 kg/m2) or obesity (BMI ≥ 30 kg/m2) does not elevate all-cause mortality risk,10,11,18-20 whereas in some analyses, adiposity to some degree appears beneficial.2,3,5-9,20,21 One of the largest observational studies was conducted among 89 056 Taiwanese patients with type 2 diabetes enrolled in a nationally representative cohort. 4 After 12 years of follow-up and 26 951 deaths, the authors reported an inverse association between BMI and all-cause mortality, with a significantly lower mortality risk observed for overweight and obese individuals with BMI ≥25.0 kg/m2, compared with normal-weight individuals with BMI = 18.5-24.9 kg/m2. Additional large nationally representative registry-based studies in the Ukraine 9 and the United Kingdom 12 were also in support of an obesity paradox in type 2 diabetes, demonstrating U-shaped associations between BMI and all-cause mortality. Among 30 534 Ukrainian men with type 2 diabetes, overweight (BMI = 25.0-29.9 kg/m2) men had a significantly lower total mortality risk compared with men within the upper end of normal weight (BMI = 23.0-24.9 kg/m2). 9 Furthermore, there was no difference in mortality risk among obese men and women with BMIs from 30.0 to 34.9 kg/m2 compared with those of normal weight (23.0-24.9 kg/m2), and it was not until BMI was >35.0 kg/m2 that the risk of total mortality was significantly elevated. A similar trend was observed in the UK registry population, concluding that there was no excess mortality risk for overweight (BMI = 25.0-29.9 kg/m2) compared with normal-weight (BMI = 20.0-24.9 kg/m2) individuals, with an elevation of risk only among the obese. 12
Two of the largest US-based studies, however, did not find evidence of an obesity paradox. 16 The Health Professionals Follow-up Study (HPFS) and Nurses’ Health Study (NHS) cohorts, with follow-ups of up to 36 years and 3083 deaths from all causes collectively, concluded that there was a direct linear relationship between BMI and mortality, with the lowest mortality risk among those with BMI = 22.5-24.9 kg/m2. Similarly, Eeg-Olofsson et al 22 observed a direct linear relationship, estimating a 20% increase in mortality risk for each additional 5 BMI kg/m2 unit in their study of 13 087 patients in the Swedish National Diabetes Register.
At the opposite end of the BMI spectrum are those participants with the lowest body weights, including many who are underweight (BMI < 18.5 kg/m2). Results often indicate a significantly elevated mortality risk for the lowest body weight groups compared with those of normal body weight, often giving the obesity paradox its U-shaped description. Numerous factors may contribute to this observation. Although it is plausible that diabetes etiology differs in the underweight group as has been suggested,7,23 it is also possible that issues of reverse causation and confounding by major mortality risk factors (eg, smoking) accumulate at higher prevalences and/or with greater severity at the lowest body weights.24,25 The HPFS and NHS cohorts no longer observed an elevated mortality risk in the lowest BMI category (BMI = 18.5-22.4 kg/m2) when potential sources of bias were considered. Ultimately, studies are often severely limited in evaluating the underweight categories because developing diabetes is increasingly less common at lower body weights; thus, further research is needed to better illustrate this high-risk subgroup.
Discordant findings on the relationship between body weight and mortality in type 2 diabetes are likely attributable to differences in study population characteristics and epidemiological methods used. Based on a careful evaluation of the potential biases, convincing evidence demonstrates that the observed “obesity paradox” is an artifact of methodological issues, discussed in detail below.
Methodological Considerations in the Assessment of Body Weight and Mortality
A number of factors related to the study population, study design, and statistical analysis may affect the observed relationship between body weight and mortality. Furthermore, these factors are likely present in combination and concurrently contributing to the biased association. Here, we review these influential factors and outline ways in which these can be addressed in observational studies (Table 1).
Methodological Limitations and Approaches in Analyses of Body Weight and Mortality in Type 2 Diabetes.
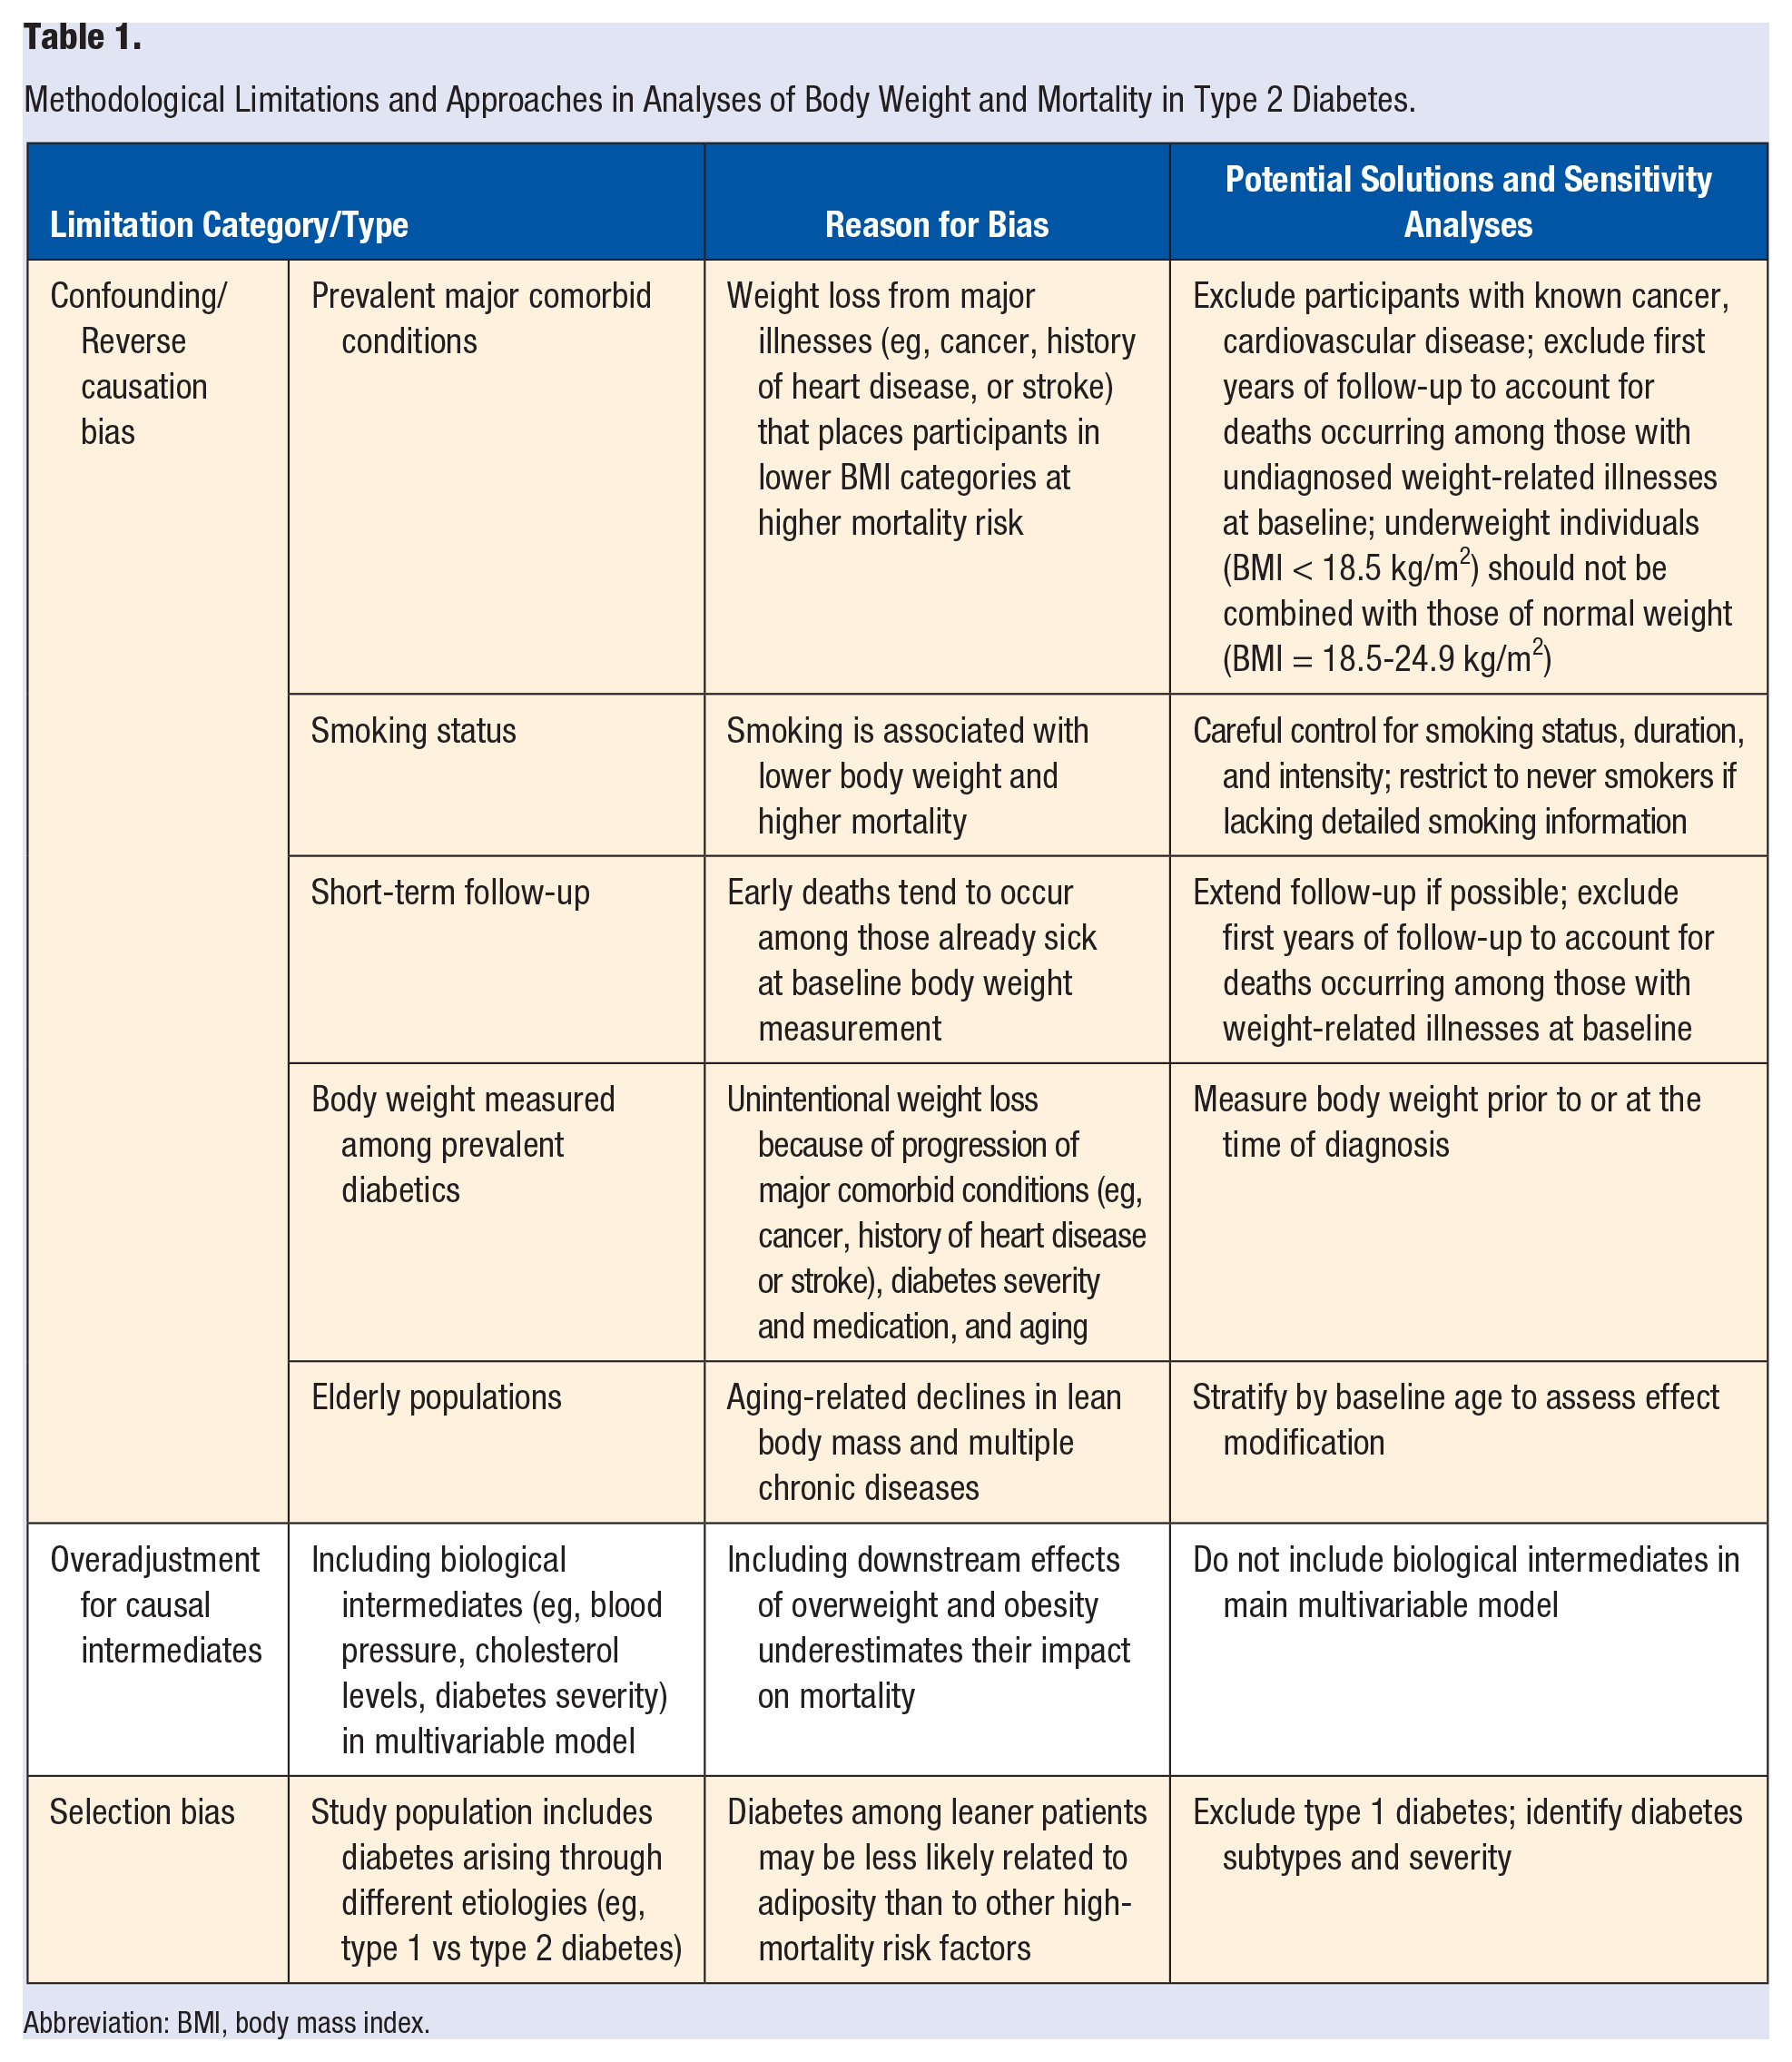
Abbreviation: BMI, body mass index.
Reverse causation is a major concern in analyses of body weight and mortality among many study populations and refers to a form of confounding bias that results when the outcome or risk factors for the outcome influences the exposure, rather than the converse. Reverse causation can exist through several mechanisms, and these often occur simultaneously. For example, certain confounding risk factors such as cigarette smoking and major comorbid illnesses lead to a lower body weight and a decreased survival; thus, strata of participants with a normal BMI (18.5-24.9 kg/m2) have an elevated mortality risk not causally resulting from body weight itself but because normal-weight exposure groups have higher prevalences of smokers (especially heavy smokers) and/or are more likely to have experienced weight loss as a result of other high-risk conditions. Furthermore, because underweight individuals with BMIs <18.5 kg/m2 often represent an exceptionally high-risk group, possibly because of a constellation of factors, utilizing BMI categories that separate underweight individuals from the normal weight reference group categories will minimize the influence of these unique high-risk participants.
It is essential to understand the potential for reverse causation in a given study population at baseline. Presenting the characteristics of study participants stratified by BMI is useful for evaluating the distribution of traits that may lead to confounding. For example, in the large Ukrainian diabetes registry, the lowest BMI category (BMI < 23.0 kg/m2) had the highest prevalence of current smokers. 9 In men, 26.2% of the leanest individuals were current smokers, compared with 16.1% of obese individuals (BMI ≥ 35 kg/m2). Similar distributions of smoking status across BMI categories have been observed in several cohorts.10,13,16,22,26,27 Confounding by smoking clearly biases the relationship between BMI and mortality for many diabetes study populations; however, simply adjusting for smoking as “never versus ever” in statistical models, as was done in most analyses, does not adequately control for the variability in intensity and duration of smoking among current and past smokers; thus, the most effective way to reduce confounding by smoking is to restrict to never smokers. Sensitivity analyses stratified by smoking status regularly show an attenuation of the J- or U-shaped mortality risk at the lower BMI categories among never smokers and often an elevation of risk at the higher end of the BMI spectrum.2,9,10,13,16,19-21
The presence of major chronic illnesses (eg, cancer, history of heart disease or stroke) at the time that body weight is assessed is also a source of reverse causation in patients with diabetes when evaluating the relationship between body weight and mortality. For example, cancer and cardiovascular disease are often associated with unintentional loss of body mass, 28 resulting in a higher prevalence of sicker patients in the lower BMI categories, who are at higher risk of subsequent mortality. This skews the relationship of BMI with mortality by making overweight and even obese participants appear no different or even at a lower risk of death, compared with normal-weight individuals. Exclusion of patients with a history of cancer, stroke, coronary heart disease, and other major chronic conditions associated with weight loss at baseline can help alleviate this source of reverse causation, if this information is available.16,22 Additionally, excluding deaths occurring early in follow-up from the analysis (eg, within 2 years of body weight measurement) minimizes bias from high-risk participants with illnesses undiagnosed or unknown at baseline.10,13,16,19 Bias from major illnesses present at baseline is particularly concerning for studies with shorter follow-up time because deaths occurring early in follow-up are more likely to occur among participants with illnesses already present at the time of body weight measurement. Among studies reporting the most striking inverse associations between BMI and mortality are 4 cohorts that specifically enrolled patients with both diabetes and major cardiovascular disease or a hospitalization at baseline, where elevated risk among the lower BMI categories was exceptionally high.5,8,29,30 These studies also had average follow-up times of less than 4 years, further increasing the likelihood of reverse causation bias. Although analyses excluding individuals with major chronic illnesses may minimize reverse causation bias, this may in turn limit our ability to generalize findings to the clinical populations with both type 2 diabetes and these major illnesses. Obtaining body weight measures prior to disease onset and exclusion of early deaths among populations with diabetes and major chronic illnesses may mitigate some reverse causation bias.
Another study design consideration is the importance of measuring body weight prior to or at the time of diabetes diagnosis to properly classify individuals before the influence of diabetes treatments, some of which are associated with unintentional weight loss,31,32 and before further progression of comorbid conditions. Diabetes duration is an independent risk factor for all-cause mortality,12,33 and among studies enrolling participants with prevalent diabetes, often, the individuals at the lower end of the normal BMI range have had diabetes for a longer duration and have signs of greater severity of diabetes, including a higher prevalence of insulin use.4,6,9,12,22,27,34 Few studies evaluated body weight measured prior to or within a few years of diabetes diagnosis,2,10,16 but among them are the HPFS/NHS cohorts 16 and Swedish National Diabetes Register 22 studies, both indicating a direct relationship between BMI and mortality.
The age of the study population is another potential explanation for discrepancies between studies. It is particularly difficult to tease apart the obesity paradox in elderly populations with diabetes because several of the aforementioned methodological concerns are exacerbated with age. Accrual of additional chronic illnesses magnifies the issue of reverse causation, making methods to address bias less effective. In addition, BMI becomes a poorer measure of adiposity in older populations because of age-related declines in lean body mass and accumulation of central adiposity. Stratification by age categories or censoring participants at older ages (eg, 70 years old) can help determine the impact of age in a given study.6,16,20,21 For example, in the Verona Diabetes Study cohort of participants with prevalent diabetes, 6 the authors reported a significant interaction by age (P = .002) with a direct relationship between BMI and all-cause mortality for ages <65 years but an inverse association among ages ≥65 years.
In addition to reverse causation, many studies adjusted for intermediates likely in the biological pathway between overweight/obesity and mortality risk, thus underestimating the impact of an elevated BMI.2-4,6,8,11,13-15,26 Examples of such intermediate variables include blood pressure, serum cholesterol measures, and measures of diabetes severity (eg, insulin, oral hypoglycemic medication use, glycated hemoglobin levels). Similarly, comorbid chronic conditions at study baseline, such as hypertension and dyslipidemia, may also represent causal intermediates between BMI and mortality. Including these measures in statistical models represents an overadjustment, minimizing the relationship between BMI and mortality because these are the biologically plausible mechanisms by which BMI may exert its effects.9,10
Another form of bias, termed selection bias or collider stratification has also been proposed as an explanation for the obesity paradox in individuals with chronic diseases such as diabetes.7,23,35 Authors suggest that restricting an analysis to a specific subgroup of the population, such as individuals with type 2 diabetes, may induce bias, given that diabetes is affected by the exposure itself (body weight) as well by key risk factors for both the exposure and mortality, such as smoking.36,37 Methodological examinations of the role this bias plays in the obesity paradox in cardiovascular disease demonstrated that it can indeed lead to the degree of bias necessary to nullify or entirely reverse the direction of an association, even in the presence of a single unmeasured or poorly measured confounder such as cigarette smoking.36,37 Thus, the presence of selection bias may further exacerbate issues of reverse causation and confounding in select subgroups, such as those with type 2 diabetes. 17 Selection bias may also arise if in fact diabetes is a constellation of conditions with a similar diabetic phenotype but resulting from different etiologies.7,23,38 For example, leaner patients with diabetes may not have arrived at their diabetes through the same biological pathway as overweight/obese diabetes patients. It may be that genetic and other risk factors contributing to diabetes in leaner patients put them at a higher risk of mortality, not because of their lower body weight, as the obesity paradox may suggest, but because of these underlying factors.38,39 Further research is needed to identify the specific genetic, lifestyle, or environmental factors that may be contributory.
Methodological Limitations in Previous Epidemiological Studies
The association between body weight and mortality is prone to several concurrent sources of bias. It is, therefore, important to have adequate statistical power and specific participant information to address these concerns through the a priori sensitivity analyses mentioned above and outlined in Table 1. Previous studies often incorporated one or more of these approaches as individual sensitivity analyses, but to obtain the least-biased estimate, researchers may need to utilize all strategies simultaneously. Smaller studies or shorter follow-ups with few events will limit the investigators’ ability to do so. Limited power may also compel statisticians to combine BMI categories; grouping underweight individuals (BMI < 18.5 kg/m2) who tend to have a higher prevalence of smoking and chronic illnesses with a normal weight reference group (BMI = 18.5-24.9 kg/m2) can skew comparisons with overweight and obese categories.2,30 On the other hand, large clinical databases with sufficient statistical power often lack detailed participant information, such as smoking status or body weight captured at the time of diabetes diagnosis. These trade-offs in data quality can have important implications for the internal validity of a study’s findings.
In the large nationally representative cohorts that exhibited survival advantages for overweight and/or obese patients with diabetes,4,9,10,12 a number of the limitations could explain their findings. For example, the Taiwanese cohort included 89 056 patients with diabetes of an average duration of >7 years at enrollment and lacked information on prevalent major comorbid health conditions. 4 The lowest BMI category (<18.5 kg/m2) had a mortality rate more than 2-fold greater than the other BMI categories; thus, reverse causation from underlying health conditions is highly likely. Furthermore, estimates were adjusted for insulin use, diabetes duration, and hypertension, which were highly predictive of mortality in this population, likely obstructing the association between obesity and mortality through its effects on cardiometabolic health and severity of diabetes. The analysis benefits from 12 years of follow-up, and authors conducted a sensitivity analysis excluding deaths within 2 years of enrollment. It would have enhanced validity, however, to simultaneously exclude smokers and those with major chronic illnesses (eg, cancer, cardiovascular disease) at the time of body weight measure, although this information may not have been available or reliably captured. The other large national cohorts suffered from similar limitations. The United Kingdom 12 and Ukraine 9 cohorts also analyzed patients with diabetes of several years’ duration, and baseline characteristics indicated that individuals in the lower BMI categories were more likely to be smokers, receive diabetes treatment, and have a longer diabetes duration. Although Khalangot et al 9 conducted one-by-one sensitivity analyses, excluding early deaths (<6 months), excluding previous coronary heart disease and stroke, and stratifying by smoking status (never/past vs current), the short follow-up of 2.7 years and inclusion criteria limiting the population to patients receiving diabetes therapy likely compound issues of reverse causation. The large Scotland-based registry 10 analyzed patients with BMI measured within 1 year of diagnosis and excluded early deaths (<2 years) in its primary analysis; however, its relatively short follow-up (4.7 years), lack of exclusion of individuals with major chronic illnesses, and adjustment of only age and binary smoking status (ever vs never) in the model increases concern for reverse causation and residual confounding.
In the analysis of the NHS and HPFS cohorts, a series of sensitivity analyses demonstrated the impact that confounding from smoking and reverse causation bias from major underlying comorbid illnesses can have on the relationship between BMI and all-cause mortality in diabetes (Figure 1). Participants were free of cardiovascular disease and cancer at baseline, and body weight was prospectively ascertained within 2 years prior to diabetes diagnosis. The U-shaped relationship between BMI and mortality among all men and women with type 2 diabetes (panel A) became a direct linear relationship after the exclusion of early deaths among never smokers (panel D). Independently, analyses restricted to never smokers (panel C) or excluding early deaths (panel B) were insufficient to adequately address bias; but when several strategies were taken together, the obesity paradox was no longer evident.
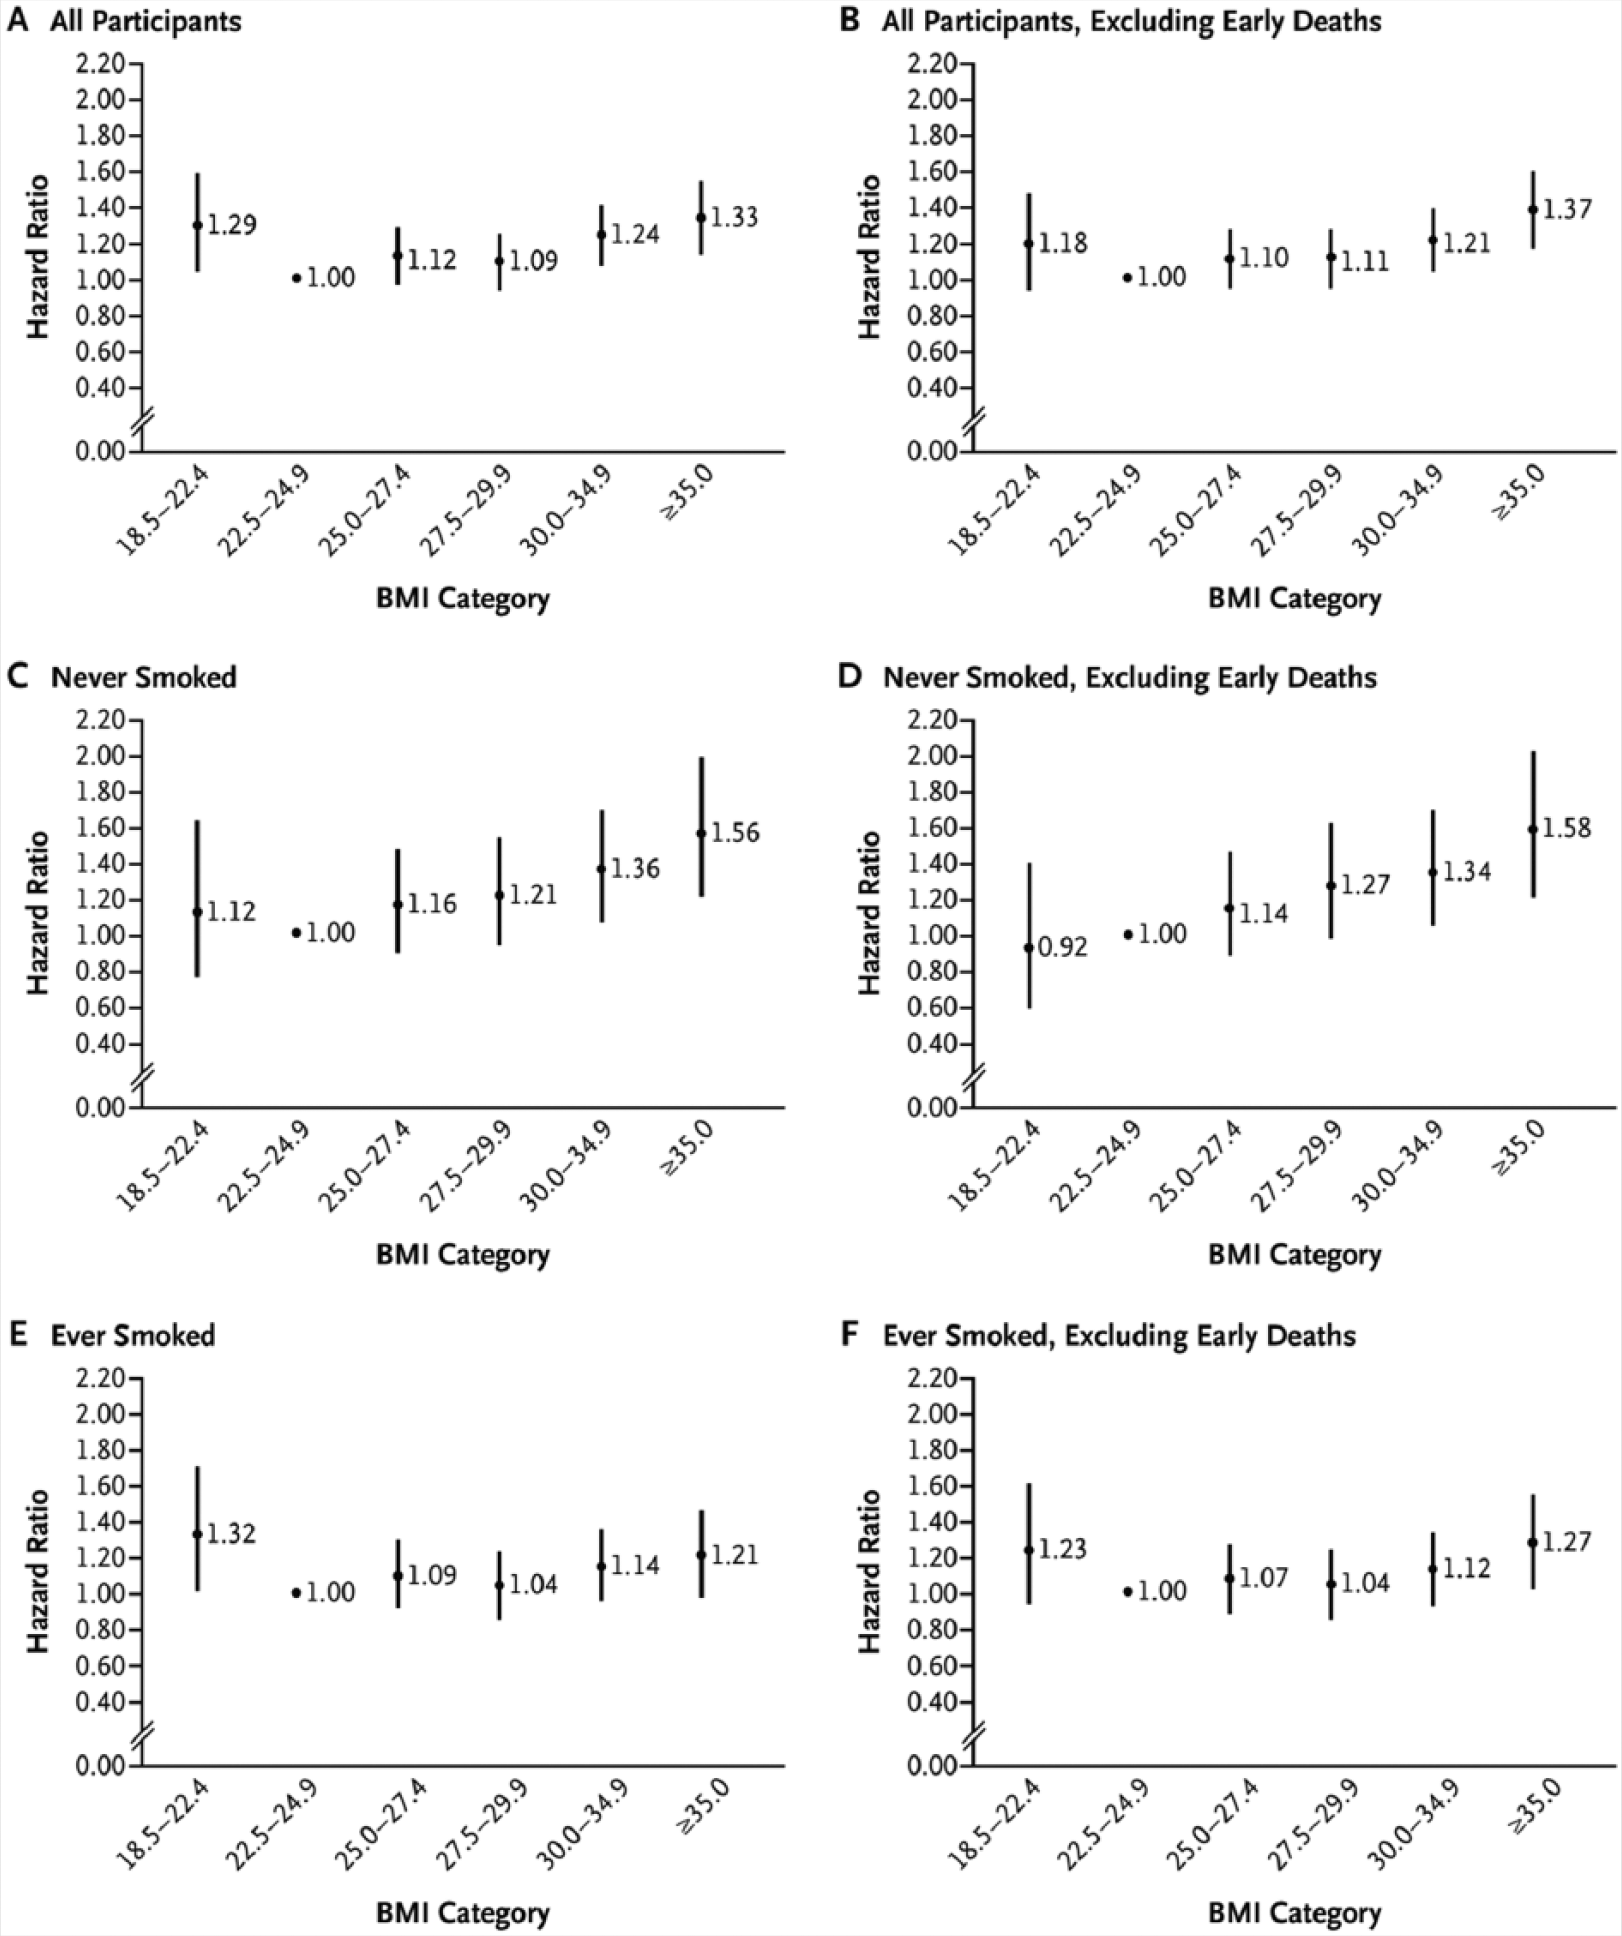
Hazard Ratios for All-Cause Mortality Among Participants With Incident Type 2 Diabetes, According to Body Mass Index (BMI) Shortly Before Diagnosis of Type 2 Diabetes.a
Limitations to some of the approaches outlined above have been raised. Importantly, post hoc exclusions of subgroups of participants in an effort to explore whether reverse causation or confounding can be eliminated should be avoided. 40 Rather, a priori exclusions based on biologically plausible hypotheses are preferred. For example, excluding participants with chronic illnesses that may be causal intermediates between obesity and mortality (eg, hypertension) may lead to spurious associations. Concerns have also been raised about generalizability of findings when analyses are restricted to subsets of populations, such as nonsmokers; however, simulations by Banack and Kaufman 37 and Stokes and Preston 25 demonstrated the ability of a strong risk factor of mortality and body weight to induce an obesity paradox association in chronic disease populations. Thus, internal validity is necessary before external validity can be considered, although any limits to generalizability should be acknowledged. Exclusions resulting in large losses of the study population may also limit a study’s statistical power.
Clinical Implications and Conclusions
If the obesity paradox reflected a valid causal relationship in diabetes, it would imply that maintaining a normal body weight (BMI = 18.5-24.9 kg/m2) decreases one’s survival and that being overweight or obese does not confer an increased mortality risk and, in some populations, may even be beneficial. Biological and clinical studies indicate that overweight and obesity are unlikely to lead to improved survival among those with type 2 diabetes. Epidemiological studies of the relationship between body weight and all-cause mortality in type 2 diabetes populations are complicated by potential biases, including reverse causation from smoking and major comorbidity-related weight loss. Moreover, other methodological considerations, such as the timing of measurement of body weight in relation to time of diabetes diagnosis, duration of follow-up, and overadjustment for biological intermediates in multivariable analyses, may introduce bias and artifact. Achieving and maintaining a healthy body weight should continue to remain a priority among individuals with type 2 diabetes for the prevention of adverse health outcomes and for improved survival.
Footnotes
Acknowledgements
This research received no specific grant from any funding agency in the public, commercial, or not-for-profit sectors. The authors declare that there is no conflict of interest.
Declaration of Conflicting Interests
The author(s) declared no potential conflicts of interest with respect to the research, authorship, and/or publication of this article.
Funding
The author(s) received no financial support for the research, authorship, and/or publication of this article.
Ethical Approval
Not applicable, because this article does not contain any studies with human or animal subjects.
Informed Consent
Not applicable, because this article does not contain any studies with human or animal subjects.
Trial Registration
Not applicable, because this article does not contain any clinical trials.