
Abstract
Unintentional injuries are a persistent public health problem in the United States. A new health care landscape has the potential to create a clinical environment that fosters greater involvement by health care providers in injury prevention. The aim of this article is to provide evidence supporting the need for engagement by primary care providers in unintentional home injury prevention along with examples of how this could be accomplished. We know a great deal about what population groups are at risk for certain types of injuries. We also know that many injuries can be prevented through policies, programs, and resources that ensure safe environments and promote safe behaviors. For example, the Centers for Disease Control and Prevention’s STEADI (Stopping Elderly Accidents, Deaths, and Injuries) initiative comprises clinical decision support tools and educational materials for health care providers. Two effective interventions that have demonstrated a reduction in falls among children are the redesign of baby walkers (engineering) and the mandated use of window guards (enforcement). Primary care clinicians can play a key role in promoting their patient’s safety. Taken collectively, a focused attention on preventing unintentional home injuries by primary care providers can contribute to the reduction of injuries and result in optimal health for all.
“The new emphasis in health care on simultaneously improving individual patient care and overall population health along with reducing health care costs provides a strong rationale for addressing unintentional home injuries in the clinical setting because these injuries are always costly and often preventable.”
Unintentional injuries are a persistent public health and lifestyle problem in the United States. 1 Using the nomenclature of the early 1900s, accidents have been among the top 10 causes of death in the United States for more than a century, even during the early part of the last century when motor vehicles were not as prevalent as they are today. 2 Unintentional injuries remain, today, the leading cause of death for Americans between the ages of 1 and 44 years. Whereas motor vehicle crashes have been ranked as the leading cause of injury-related death overall for most age groups, poisoning has now surpassed crash deaths for adults, and many other fatal and nonfatal unintentional injuries that occur in and around the home contribute significantly to this national problem today. 3
As millions of previously uninsured Americans obtain health insurance coverage and access to medical care as a result of the Affordable Care Act (ACA), 4 numerous opportunities for prevention arise, such as an expanded coverage base and many free preventive services. Consequently, the primary care provider’s role in injury prevention takes on increasing importance. Many professional groups recognize the importance of supporting injury prevention counseling as an effective tool for educating patients, and guides such as those from the US Preventive Services Task Force provide easy access to evidence-based recommendations for patients.5-8 ACA raises the importance of wellness and prevention alongside the appropriate management of chronic illnesses. As such, it ensures that most health plans cover selected preventive services without additional charges to the patient. ACA also supports community-based preventive services and enhanced linkages with clinical care.
This new health care landscape has the potential to create a clinical environment that fosters greater involvement by health care providers in injury prevention. Provisions such as osteoporosis screening for women older than 65 years can provide opportunities for intervention to reduce serious outcomes from falls or prevent them through patient education and referrals to community-based fall prevention programs. The new emphasis in health care on simultaneously improving individual patient care and overall population health along with reducing health care costs 9 provides a strong rationale for addressing unintentional home injuries in the clinical setting because these injuries are always costly and often preventable.
The aim of this article is to outline opportunities for primary care providers to engage in home injury prevention efforts as well as to give examples of how this could be accomplished, particularly among children and older adults who are at high risk for unintentional home injuries. Following a brief review of the epidemiology of unintentional home injuries, we focus attention on high-priority prevention opportunities for those who care for children and older adults. Finally, we provide suggestions for clinicians interested in taking on new activities to contribute to reducing the burden of unintentional home injuries to their patients and to society.
Why Focus on Unintentional Home Injuries?
One’s home, along with other elements of the physical and social environment, are being increasingly identified as key drivers of health. 10 This realization has been found not only for specific health issues such as asthma 11 and cardiovascular disease 12 but also for issues of health access and disparities. 13 It is also true for unintentional home injuries.14-16 Like all injuries, unintentional home injuries result from the interactions among individuals and their physical and social environments. 17 Populations at risk for injuries can be identified by age group (with older adults most at risk), socioeconomic status (with poorer, less-educated individuals more at risk compared with better-educated and richer counterparts), and geographic location (with urban and rural populations at higher risk compared with their suburban counterparts). 16
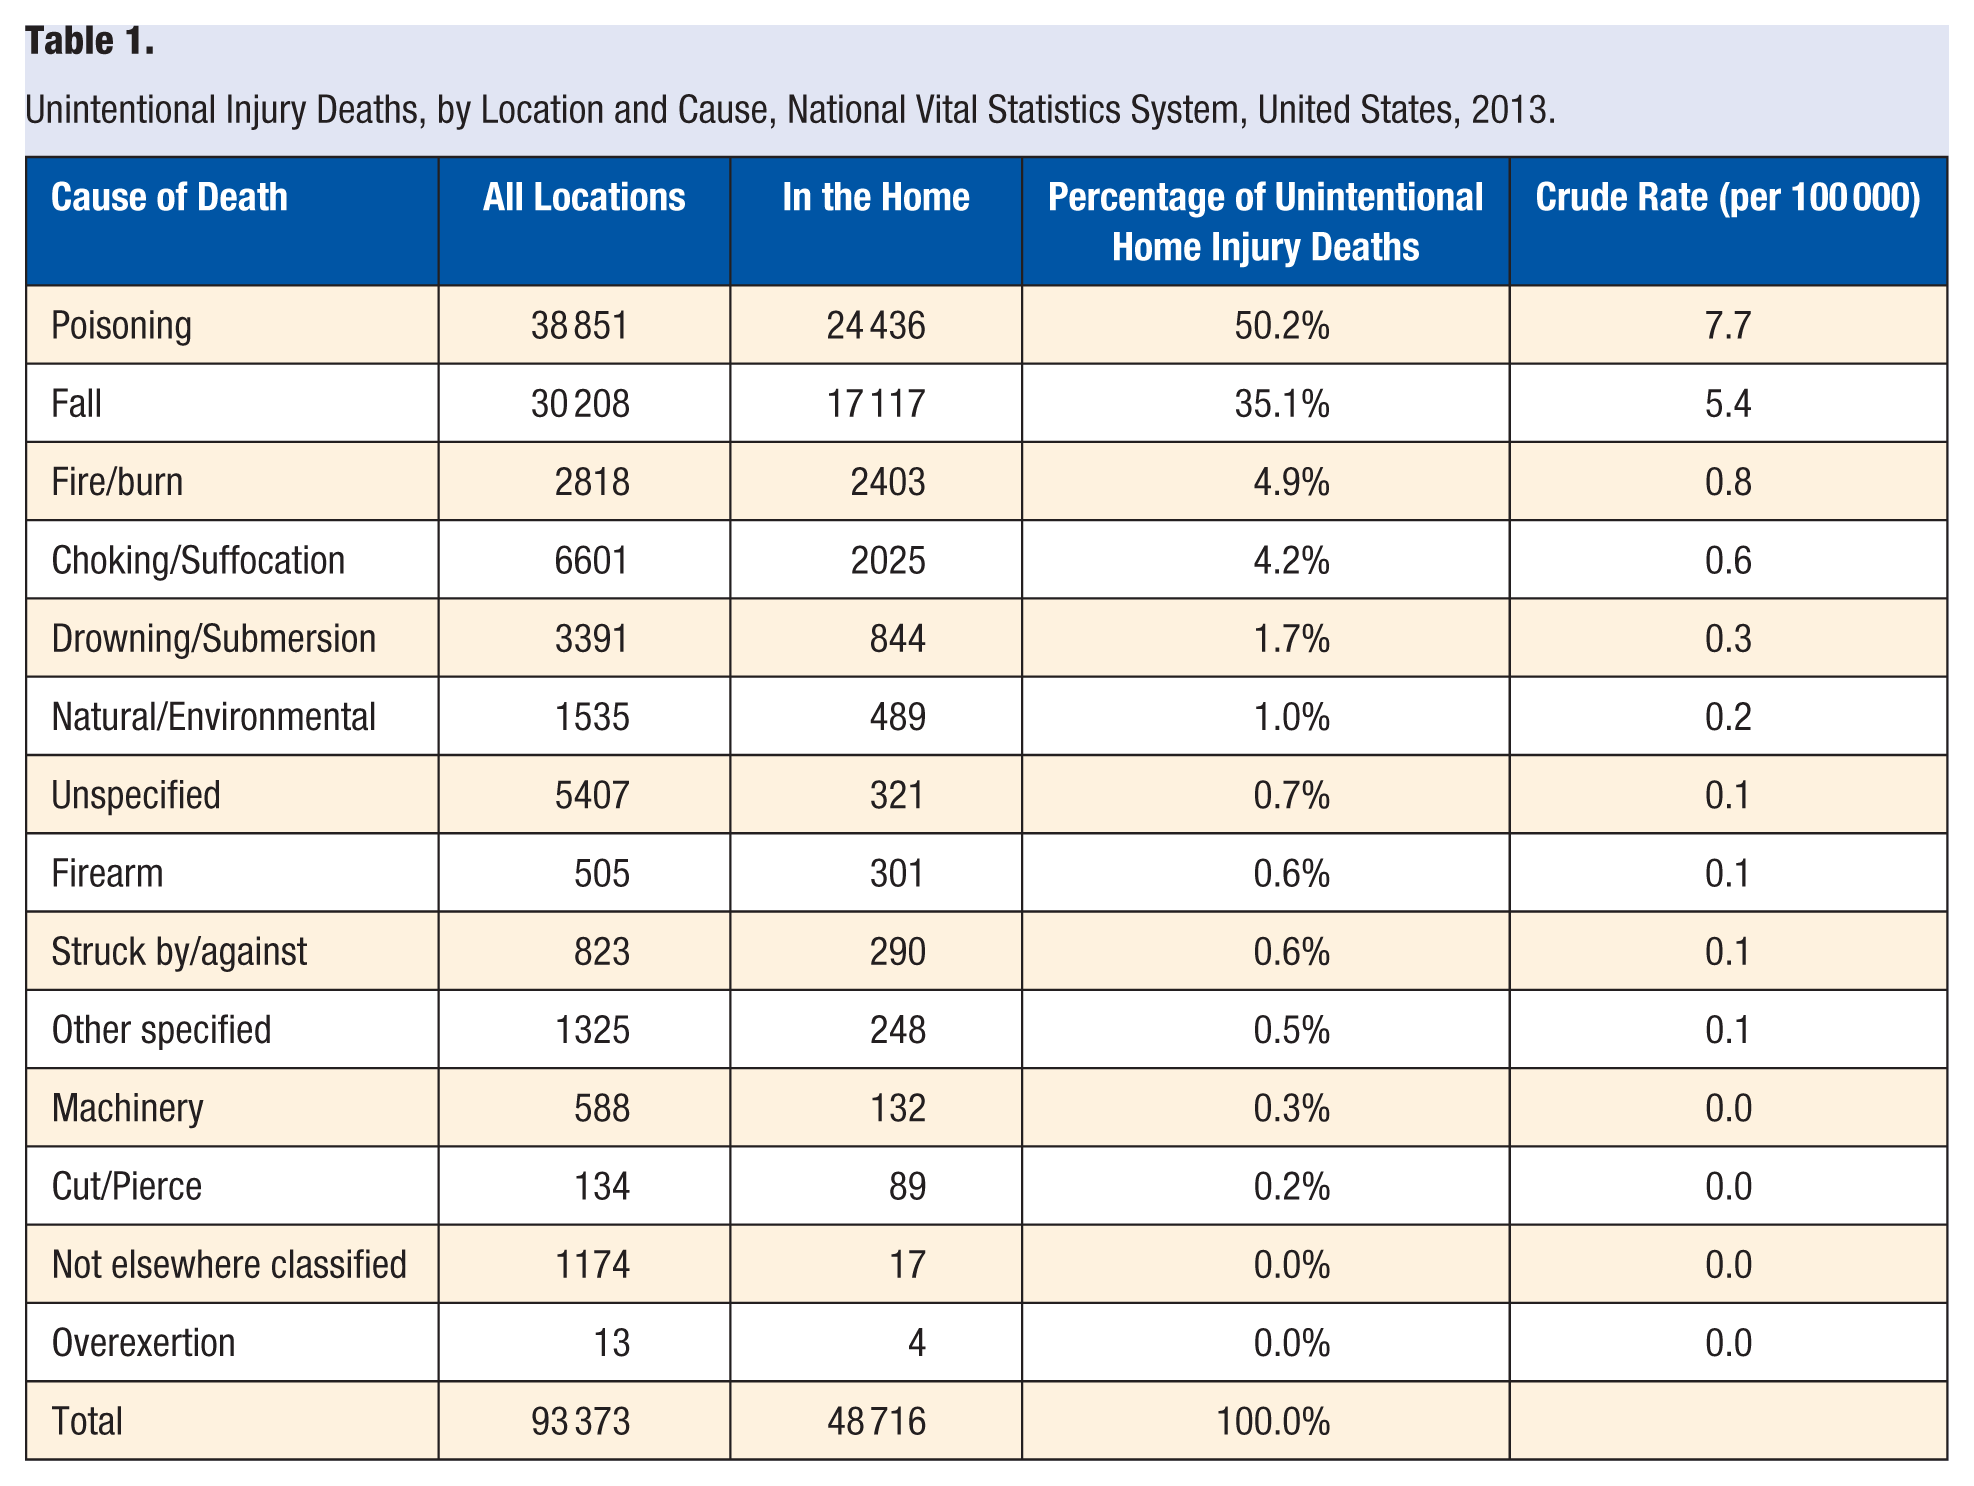
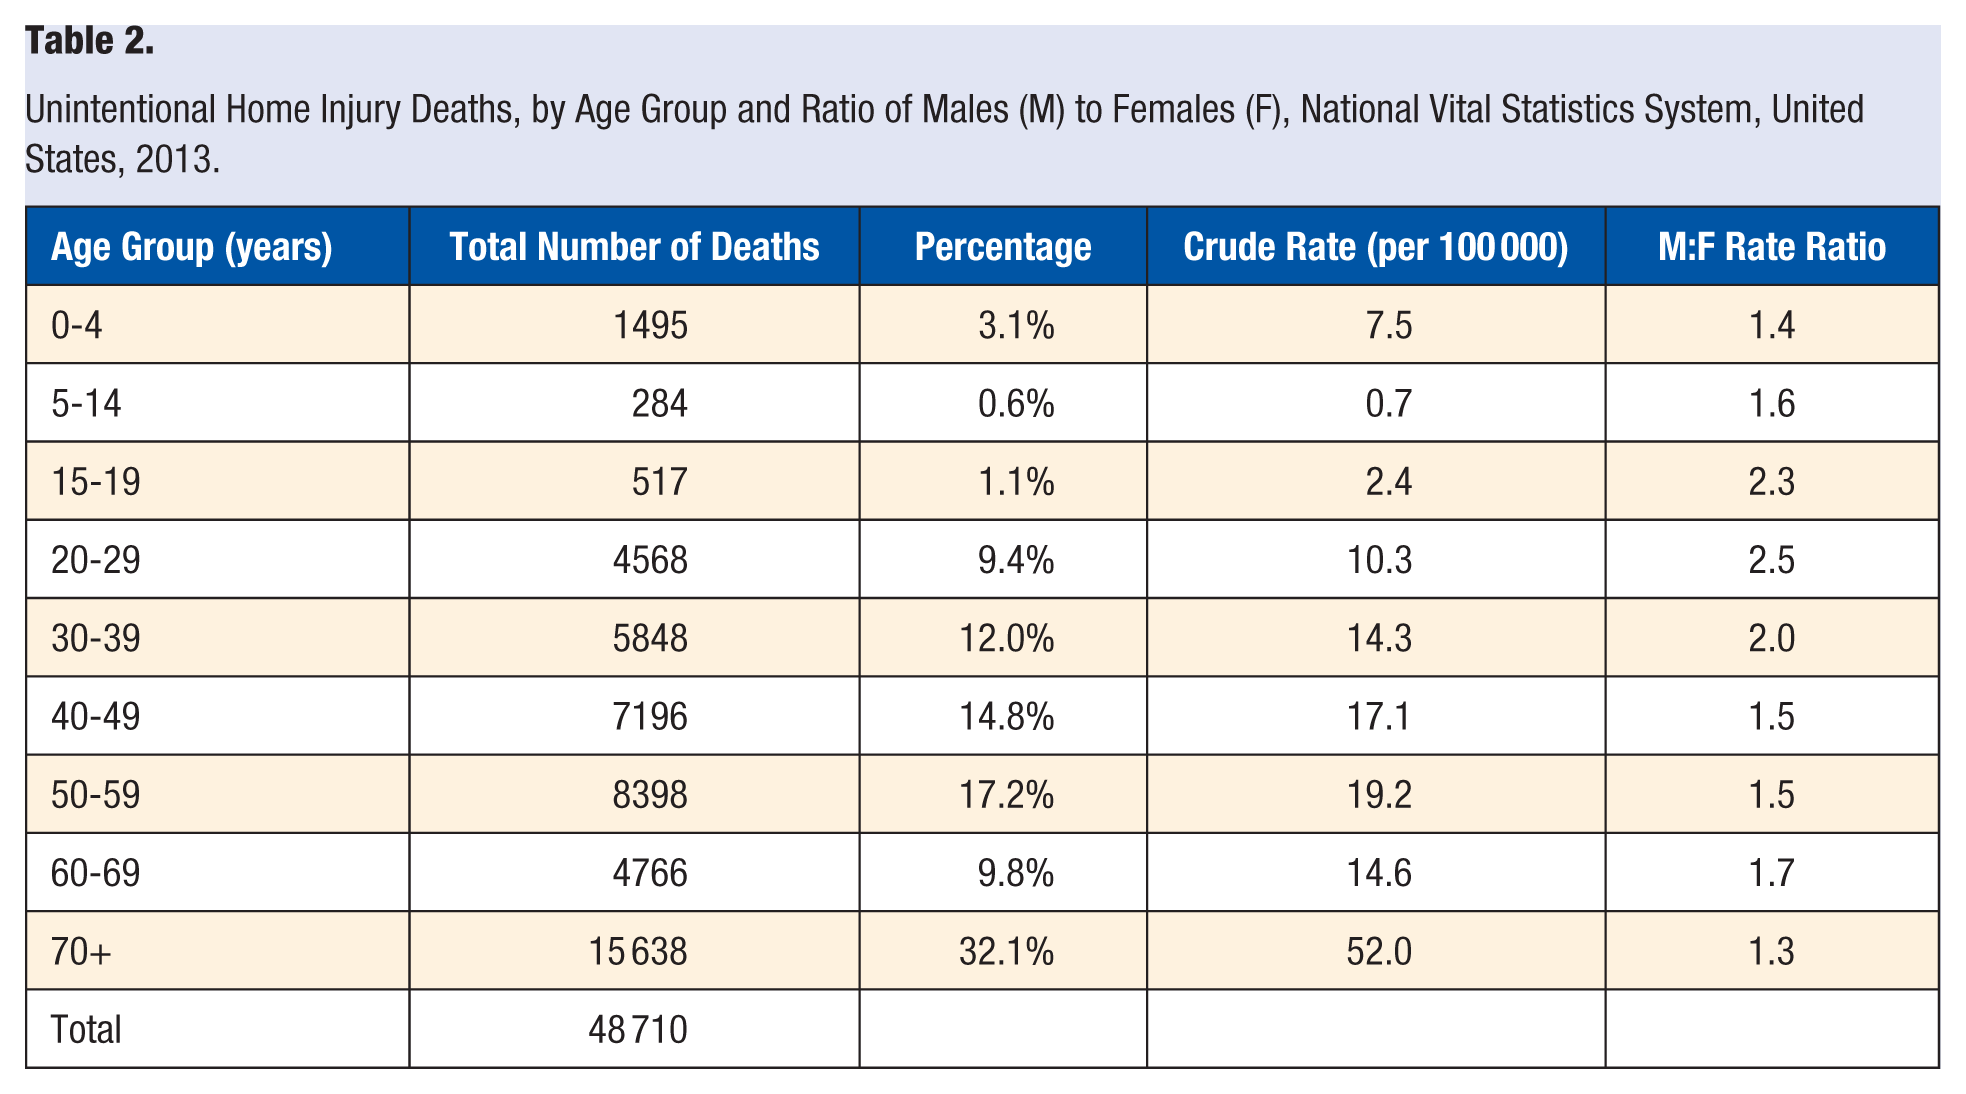
A focus on unintentional home injuries is important given the sheer magnitude of the problem in the United States. In 2013, more than half (52.2%) of the 93 373 people who died from a non–motor vehicle–related injury suffered their fatal injury in their homes (Table 1). Half (50.2%) of these unintentional home injury deaths were the result of a poisoning. As displayed in Table 2, those 70 years of age and older comprise the most vulnerable group, experiencing a home injury death rate of 52 per 100 000. Other adult groups (those between the ages of 20 and 69 years) surpass children, with higher crude death rates. Those between the ages of 0 and 4 years experienced the highest crude death rate (7.5 per 100 000) among children.
Unintentional Injury Deaths, by Location and Cause, National Vital Statistics System, United States, 2013.
Unintentional Home Injury Deaths, by Age Group and Ratio of Males (M) to Females (F), National Vital Statistics System, United States, 2013.
Overall, more than 37 million nonfatal, medically attended injuries (including poisonings) occurred in 2012. Of these, more than19 million occurred at home (61% occurring inside the home and about 39% occurring outside the home, such as in the yard).3,18 Nonfatal home injuries are similar, in that the oldest age group remains the most vulnerable, with those 75 years and older experiencing a home injury rate of 73.7 per 100 000.3,18 Other adult groups (those 65-74 and 45-64 years old, respectively) surpass children for both the second- and third-highest injury rates. Children under 12 years of age have a home injury rate of 35.3 per 100 000.3,18
Epidemiology and Prevention of High-Priority Unintentional Home Injuries Among Children
Sudden Unexplained Infant Deaths (SUIDs)
SUIDs are reported as 1 of 3 types: sudden infant death syndrome, accidental suffocation and strangulation in bed, and unknown cause. 19 In 2013, 3434 infants died suddenly and unexpectedly in the United States. 20 The highest risk period for sleep-related deaths is between 1 and 4 months of age, and nonwhites compared with whites experience higher rates of sleep-related death.21-23 The infant mortality rate for sleep-related deaths is 2.14 per 100 000 live births for American Indian/Alaska Natives, 1.92 per 100 000 for non-Hispanic blacks, and 0.94 per 100 000 for whites. 24 A number of modifiable risk factors have been well documented for infant sleep-related deaths. The most notable are prone sleep position,25,26 parental smoking, 27 maternal alcohol and drug consumption, 28 low birth weight or premature birth, 29 sleeping in an adult bed,30,31 soft or excess bedding,32,33 and cosleeping, especially on a couch. 34
Safe Sleep Promotion (See Table 3)
Physician counseling about safe sleep is one of the strongest predictors of whether a parent or caregiver will use recommended safe sleep strategies. 35 The American Academy of Pediatrics (AAP) has promoted safe sleep for infants since the early 1990s.36,37 After AAP started promoting the supine sleep position, sudden infant death rates declined by 53%, and rates of supine sleeping increased from 13% to 72%. Noting plateauing rates of supine sleep position, the AAP strengthened recommendations in 2005 and 2011 to further emphasize supine sleep position and other environmental factors to protect against sleep-related deaths.37,38 A safe sleep environment for infants includes a constellation of both caregiver practices of how they dress and position their child for sleep as well as the appropriateness of the physical space where the child sleeps. Infants should sleep alone, on their backs, in a clutter-free crib with a firm mattress, and in a smoke-free environment.37,38
Prevention Successes and Opportunities for Unintentional Home Injury in Children and Older Adults.
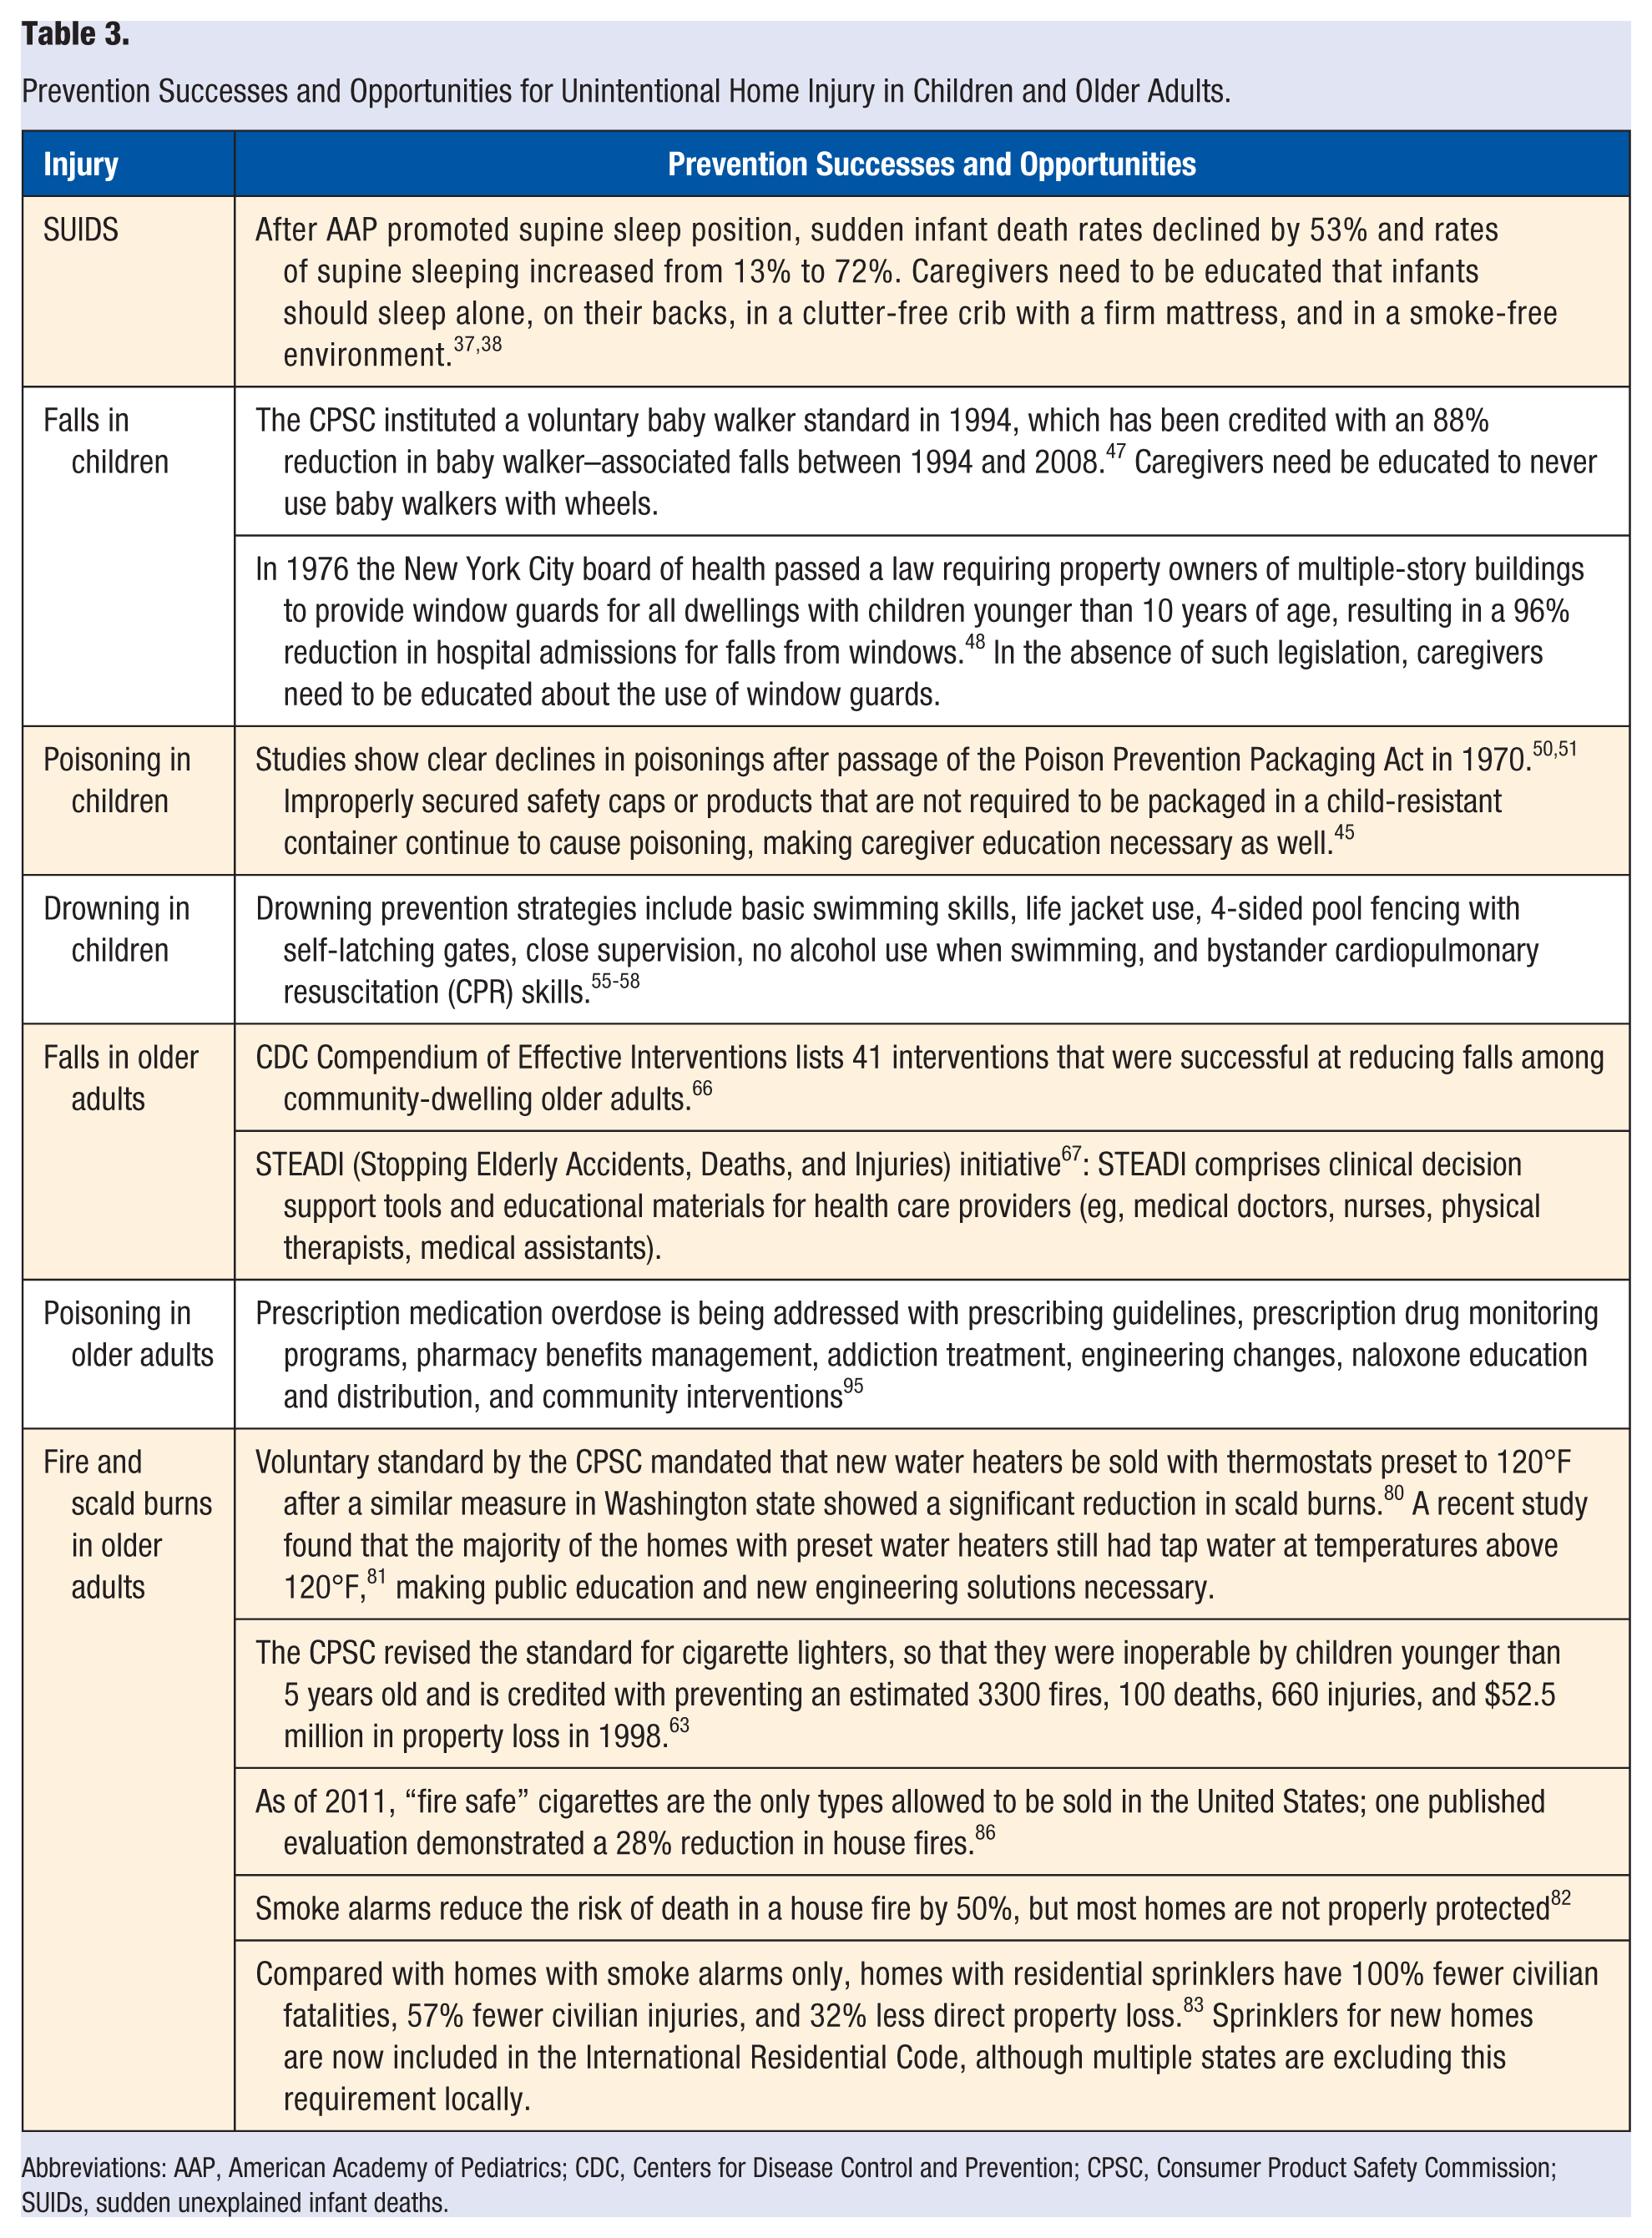
Abbreviations: AAP, American Academy of Pediatrics; CDC, Centers for Disease Control and Prevention; CPSC, Consumer Product Safety Commission; SUIDs, sudden unexplained infant deaths.
Falls
In 2013, 134 US children 0 to 18 years old died from a fall-related injury. 20 Falls are a significant contributor to morbidity in children because they are the leading cause of nonfatal injury to children 12 years of age and younger.39-41 In 2013, falls accounted for almost 2 million pediatric emergency department (ED) visits. 39 Falls occur in numerous ways, and their patterns differ by the age and development of the child as well as by sociodemographic characteristics.40,41 The risk of serious injury or death is related to the height of the fall and the nature of the landing surface, which can range from hard concrete to softer surfaces like carpet or mulch.42,43 Falls down stairs are a significant contributor to falls in the home, with some of the most dangerous involving baby walkers.43,44 Falls from windows, which happen to more than 5000 children each year, 45 are more common in large urban areas and neighborhoods with low socioeconomic status. 46 Like other falls, furniture falls vary by age, with infants typically falling from a bed while left unattended and older children mostly falling from furniture. 41 Climbing on furniture is also implicated in window falls.
Fall Prevention (See Table 3)
Two effective interventions that have demonstrated a reduction in falls among children are the redesign of baby walkers (engineering) and the mandated use of window guards (enforcement). The Consumer Product Safety Commission (CPSC) has taken the lead to reduce the risk of falls associated with baby walkers by issuing regulations mandating the redesign of the product. The CPSC instituted a voluntary standard in 1994, which has been credited with an 88% reduction in baby walker–associated falls between 1994 and 2008. 47 In 1976, the New York City board of health passed a law requiring property owners of multiple-story buildings to provide window guards for all dwellings with children younger than 10 years of age. The mandate requires guards on any window on the first floor more than 12 feet high and on all windows above the first story. This effort resulted in a 96% reduction in hospital admissions for falls from windows. 48
Poisonings
The American Association of Poison Control Centers reports that there were more than 2.1 million poisoning exposures in 2013, with about half (1 million) occurring in children younger than 6 years old. 49 Almost all exposures (93%) occurred at home. The most common exposures for children in this age group included ingestion of household products such as cosmetics and personal care items, cleaning substances, analgesics, foreign bodies, and topical preparations. 49 In addition, poisonings led to 38 500 ED visits for children younger than 6 years of age in 2013, and approximately 16% of the ED visits resulted in hospitalization or transfer. 20
Poisoning Prevention (See Table 3)
Child-resistant packaging significantly reduces the morbidity and mortality of childhood poisonings. The US Poison Prevention Packaging Act (PPPA) of 1970 required certain household chemicals and medicines to be packaged in a way that is difficult for children younger than 5 years old to open. Studies show clear declines in poisonings after passage of the PPPA in 1970.50,51 However, one study revealed that a substantial number of the post-PPPA poisonings (as high as 40%) were a result of either improperly secured safety caps or products that were not required to be packaged in a child-resistant container. 52 Thus, there is a continuing need for caregiver education about proper and consistent storage of poisonous products in the home environment.
Drowning
In 2013, drowning was the fifth leading cause of unintentional injury death in the United States. 20 The rates peak among children 1 to 4 years of age, drop significantly, and then rise again in the late teen years. The setting in which drownings occur differs based on the victim’s age and locale. Infants most commonly drown in bathtubs, and buckets have been implicated in drownings of toddlers and young children. 53 Home swimming pools are common in warm climate locales and pose particular hazards to families with young children. Drownings among young children are more likely to occur at pools, whereas teen and young adult events occur in natural bodies of water. 54 In swimming pools, African Americans between the ages of 5 and 20 years have higher drowning rates compared with whites and Hispanics. 54 Drowning rates for men are 4 times greater than those for women. For every child who dies from a drowning incident, another 5 receive emergency care for nonfatal drowning incidents. 20
Drowning Prevention (See Table 3)
Drowning prevention strategies include basic swimming skills, life jacket use, barriers (eg, fencing), lifeguards or supervision, and bystander cardiopulmonary resuscitation (CPR). Knowing how to swim is an important strategy to reduce unintentional drowning. Research has shown that participation in formal swim lessons can reduce drowning among children 1 to 4 years of age. 55 The use of life jackets can also save lives. 56 Drowning prevention strategies also include physical barriers, such as pool fencing, which can prevent children from accessing a pool area without caregivers’ awareness. 55 A 4-sided isolation fence (separating the pool area from the house and yard) reduces a child’s risk of drowning by 83% compared with three-sided property-line fencing. 57 Because drownings can happen quickly and quietly, the use of a designated supervisor without distractions can save lives. Alcohol consumption occurs in up to 70% of adolescent and adult deaths associated with water recreation, almost a quarter of ED visits for drowning, and about 1 in 5 reported boating deaths.54,58 Given that alcohol influences balance, coordination, and judgment and that its effects are heightened by sun exposure and heat, limiting alcohol use while swimming may reduce drowning risks. 58 Finally, in the event of a drowning incident, bystander CPR with ventilation has been shown to reduce mortality and improve health outcomes. 59 In the time it takes for emergency medical services to arrive, CPR performed by a bystander can save a life.
Epidemiology and Prevention of High-Priority Unintentional Home Injuries Among Older Adults
Falls
Falls among adults 65 years and older are the leading cause of both fatal and nonfatal injuries; every 13 s an older adult is seen in the ED for a fall. 20 These injuries can be moderate to severe, including hip fractures, traumatic brain injuries, and death. In many cases a fall will result in disability, hospitalization, loss of independence, and reduced quality of life. 60 In the home, falls are the most frequent nonfatal injury and the second most common fatal injury. 18 The economic burden of falls among older adults is substantial, costing approximately $34 billion in direct medical costs annually. 61 More than one-third of older adults fall each year, and those who fall once are 2 to 3 times more likely to fall again. 62 Fall death rates have steadily increased over the past decade and are consistently higher among men. Between 2000 and 2013, the death rate for men increased from 38.2 per 100 000 to 67.9, and the rate increased from 24.6 to 49.1 among women. 63 Whites have higher fall death rates compared with African Americans, and older non-Hispanics have higher fatal fall rates than Hispanics. 64 For nonfatal injuries, the rates are highest among women. 65 Modifiable fall risk factors include the use of prescription and over-the-counter medications, visual impairment, vitamin D insufficiency, muscle weakness or balance, and home hazards. 34
Fall Prevention (See Table 3)
There are a number of evidence-based interventions to prevent falls among older adults. The Centers for Disease Control and Prevention (CDC) Compendium of Effective Interventions lists 41 interventions that were successful in reducing falls among community-dwelling older adults. 66 These include 10 clinical interventions that focus on specific risk factors (eg, medication use, visual impairment, vitamin D insufficiency) and 12 multifaceted interventions that address several risk factors requiring clinical and nonclinical attention, typically including aspects of behavior change as well as environmental redesign.
Taking from the CDC Compendium and the American and British Geriatric Society’s practice guideline to promote fall risk assessment and management, the CDC developed the STEADI (Stopping Elderly Accidents, Deaths, and Injuries) initiative. 67 STEADI comprises clinical decision support tools and educational materials for health care providers (eg, medical doctors, nurses, physical therapists, medical assistants). Using STEADI, providers are able to identify patients at low, moderate, and high risk for a fall; identify modifiable risk factors; and offer effective interventions. CDC estimates that if 5000 clinicians screen patients for fall risk, review their medications, and recommend vitamin D supplements, and are effective in encouraging patient compliance with their recommendations, savings could total upward of $3.6 billion in direct medical costs over the course of 5 years. 66
Fire and Scald Burns
In 2013, the US Fire Service responded to more than 478 000 structure fires and 85% of them (or 369 500) were homes or apartments. 67 Almost 2800 residents lost their lives in these residential fires, which translates into the death of 1 citizen in a residential fire approximately every 3 hours. 67 Cooking is the leading cause of home fires, and smoking is the leading cause of home fire fatalities. 68 Other common causes of home fires include matches and lighters, and frequently result from children playing with them69,70; faulty electrical equipment 71 ; and candles, stoves, microwave ovens, wood burning stoves, and fireplaces. 72
Fire and burn deaths ranked as the sixth leading cause of injury death among adults 65 years and older in 2013. 20 Older adults are at an increased risk for death from both fire and scald burns in the home as compared with the younger population.71,73 Between 1980 and 2011, the percentage of fatal home fire victims who were 65 years or older increased from 19% to 31%. 71 Those aged 85 years and older suffer almost 4 times as many residential fire deaths compared with younger people. Deaths among older adults from these circumstances may be related to poor mobility because older adults may require additional time or assistance to safely escape from a fire.71,74
Most scald injuries occur in the kitchen and bathroom. Also, there is some evidence that the pattern of injuries differ according to gender, with women sustaining a higher proportion of scald and contact injuries compared with men. 74 Risk and severity of burn and scald injuries also increase with age. Diminished reflexes and senses can cause older adults to be unaware of fires or other hazards or to be unable to respond to risks and hazards with clarity. Other factors exacerbate older adults’ risk, such as having thinner skin, having certain medical conditions, and taking some medications. 75 Older adults who are the victims of burns or scalds face worse prognoses and typically require more medical care than younger victims because of the presence of comorbid conditions that can complicate treatment and healing.76,77 Physiological changes in older adults contribute to delayed recovery, with more potential for infection from burns as well as organ failure and sepsis, which in turn lead to the need for additional medical treatment and longer and more expensive hospital stays.78,79
Fire and Burn Prevention (See Table 3)
Multiple policy interventions have been credited with the reduction in morbidity and mortality from fire and burn injuries, including water heater standards, housing codes, and laws regulating the sale of cigarettes and lighters. Water heater manufacturers adopted the voluntary standard recommended by the CPSC in the 1980s, which mandated that new water heaters be sold with thermostats preset to 120°F after a similar measure in Washington state was credited with a reduction in water temperatures and scald burn injuries. 80 However, more recent work by Shields et al 81 has demonstrated that a majority of the homes with preset water heaters still had tap water that was well above 120°F. This result highlights the potential need for continued public education about water heater settings as well as new engineering solutions such as antiscald devices.
Housing and building codes have been used to increase the presence of smoke alarms and fire escapes and, most recently, the inclusion of residential sprinkler technology in new construction. 15 Smoke alarms reduce the risk of death in a house fire by at least 50%, although most homes in the United States do not have the recommended number of working alarms to be properly protected. 82 Compared with homes with smoke alarms only, sprinklered homes have been shown to have 100% fewer civilian fatalities, 57% fewer civilian injuries, and 32% less direct property loss. 83 The International Residential Code includes a provision for requiring sprinklers in new 1- and 2-family homes, although an increasing number of states are adopting laws excluding this provision because of concerns about increased cost. A recent national public opinion survey found, however, that 75% of those living in sprinklered homes would buy another sprinklered home, and 30% of those not currently living in one would be willing to do so, which illustrates the essential interconnection between policy solutions and the need for an educated and engaged public. 84 Reductions in house fires and fire deaths have been attributed to reduced ignition propensity cigarettes, more commonly known as fire-safe cigarettes. New York law, which became effective June 2004, resulted in a 35% reduction in fire deaths in the first year. 85 As of 2011, these are the only type of cigarettes allowed to be sold in the United States. Although it may take a decade to see the full benefits of the nationwide legislation on fire-related deaths, one published evaluation demonstrated a 28% reduction in house fires but no statistically significant reduction in injuries. 86 The CPSC revised the standard for cigarette lighters in 1993 by requiring that they be inoperable by children younger than 5 years of age; this standard, when applied to national fire loss data, has been credited with preventing an estimated 3300 fires, 100 deaths, 660 injuries, and $52.5 million in property loss in 1998. 69 The initiative that led to this requirement was instigated by a nurse who was responding to the number of patients she treated with burns from easy-to-use lighters. 87
Poisonings
The United States is experiencing an unprecedented epidemic of prescription drug overdose deaths.88-90 Whereas prescription drug overdose deaths are primarily among middle-aged adults, older adult death rates are also increasing. Drug poisoning death rates have more than doubled among those 60 years of age and older between 1999 and 2013.20,88 Men are more likely than women to die from drug overdose; however, between 1999 and 2010, the percentage increase in the rate of overdose deaths was greater for women than for men.88,89 Since 2007, more women have died from drug overdoses than from motor vehicle traffic injuries, and in 2010, 4 times as many died as a result of drug overdose as were victims of homicide.
Prevention of Prescription Drug Overdose (See Table 3)
To advance prescription opioid overdose prevention, providers need access to data, tools, and evidence to improve how these drugs are used and prescribed. 91 Best practices for responsible painkiller prescribing include the following: providing patients with information on how to use, store, and dispose of opioids; prescribing the lowest effective dose and only the quantity needed for the expected duration of pain; planning with patients on how to stop opioids when their treatment is done; and avoiding combinations of prescription opioids and sedatives unless there is a specific medical indication. 92
States have a variety of policy tools to use with the potential to reduce prescription drug overdoses. 93 Strategies such as enhanced prescription drug monitoring programs (PDMPs), strong clinical guidelines, patient review and restriction programs, or pain clinic regulation can all operate to guide improved patient care and reduce misuse.88,89 PDMPs can change prescribing patterns and decrease the use of multiple providers and pharmacies. 94 Clinical guidelines can improve physician knowledge of prescribing recommendations and ensure that patients receive the safest, most effective treatment. 91 Clinicians can play a role in developing and implementing policy solutions to the problem of prescription drug misuse, abuse, addiction, and overdose. 91 A recently released report, “The Prescription Opioid Epidemic: An Evidence-Based Approach,” 95 which was the result of a national panel of experts’ year-long investigation, identifies 37 recommendations in 7 priority areas: prescribing guidelines, PDMPs, pharmacy benefits management, addiction treatment, engineering changes, naloxone education and distribution, and community interventions.
Becoming an Advocate for Injury Prevention
The history of injury prevention is replete with examples of how health care providers have effectively championed a solution to a pressing injury problem (eg, the first child passenger safety legislation in the United States was initially promoted by a Tennessee pediatrician, Dr Robert Sanders). 96 To become an effective advocate, clinicians can benefit from understanding how injury control professionals conceptualize injury problems and their solutions. The Haddon Matrix and the 3-Es of Injury Prevention are 2 essential tools for injury prevention professionals.
The Haddon Matrix 97 applies the infectious disease model of host, agent, and environment to explain injuries, where the host is the individual (eg, older adult), and the agent is the energy that damages the body through some mechanism of injury (eg, a fall that results in a femur fracture) occurring in an environment (eg, at home). The matrix considers these factors across 3 time phases: pre-event, event, and postevent (see Figure 1 for an example). As their names imply, the pre-event period is any time before the transfer of injury-causing energy, the event is the fall itself, and the postevent phase is what happens after the event, such as medical care and rehabilitation services. The Haddon Matrix facilitates the consideration of a broad range of factors that contribute to injury-producing events and injuries, opening up a wide array of intervention opportunities from individual preventive behaviors, modifications to products and environments, and policies that shape the physical and social environments. Injury prevention experts use this matrix to prioritize interventions to prevent injury-producing events from occurring and, when they do occur, to reduce their impact and ensure swift and effective treatment. Interventions are known collectively as the “three Es of injury prevention”—education, engineering, and enforcement strategies that can be brought to bear either individually or in combination to prevent injury events and reduce injuries. 98
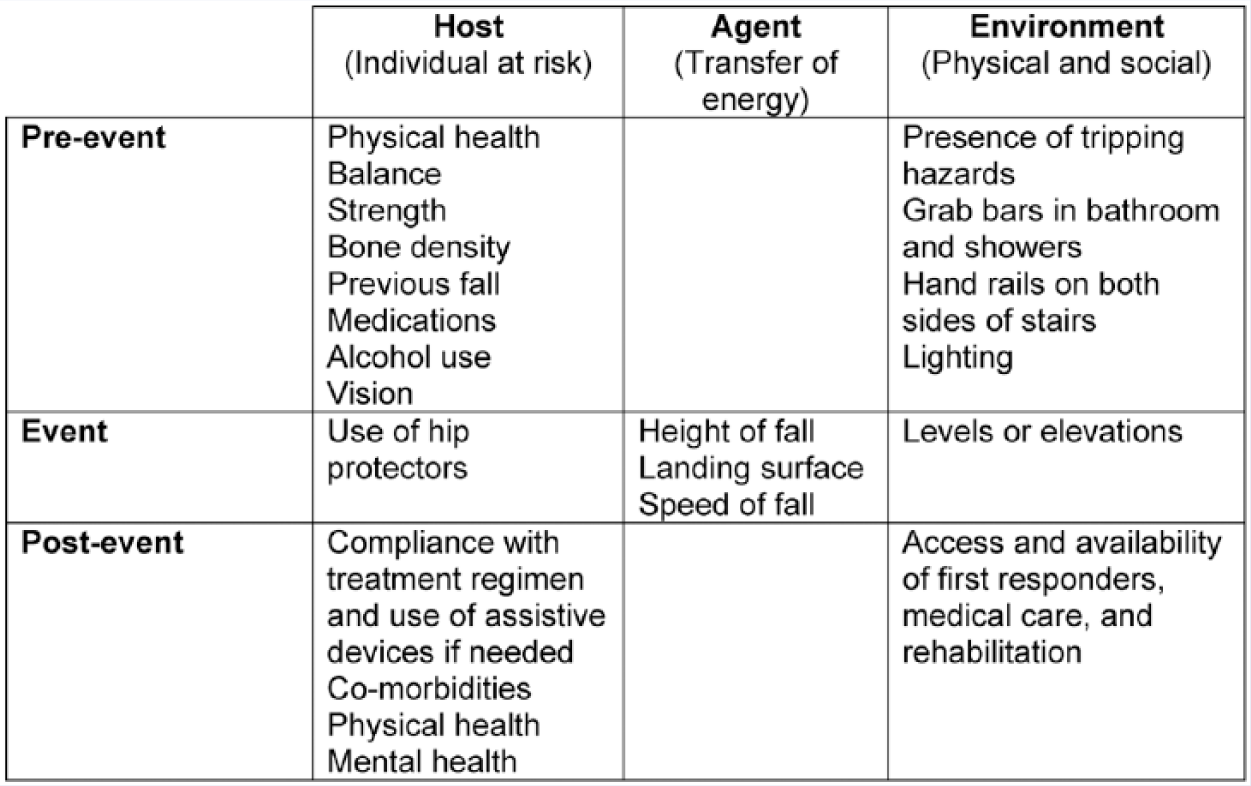
The Haddon Matrix applied to falls in the home among older adults.
Educational approaches bring attention to an issue and address knowledge gaps. They may focus on a particular injury problem or a specific at-risk group. Education conducted in the clinical setting may be driven by practice guidelines that recommend different messages for specific audiences 8 ; some clinicians may choose to champion a particular injury. Regardless, educational messages serve to highlight known risks and outcomes and promote recommended countermeasures. Educational approaches may lead to behavior change on their own among highly motivated patients who are ready to make a change, and some forms of counseling are more effective than others.99,100 A meta-analysis of the impact of counseling among pediatric patients found that counseling about using safety products is more effective when it is coupled with access to those products. 101 A supplemental resource compendium of injury prevention programs on various injury topics for different audiences has been compiled (available online).
Engineering strategies are those that modify products or environments to eliminate or reduce a hazard (eg, baby walkers without wheels, handrails on stairs). Enforcement strategies are those that use regulations, policies, and laws to bring about either behavior change (eg, mandatory carbon monoxide alarms) or changes in the environment (eg, housing codes). Although engineering and enforcement strategies might seem disconnected from the clinical setting, clinicians can be powerful safety advocates because of their role as community leaders. Often, because of their front-line positions, clinicians may be the first to recognize hazards and may be useful partners of product designers or policy makers to suggest needed changes. Several important injury prevention gains (eg, child-resistant cigarette lighters) have been realized as a result of doctors and nurses using these approaches to bring about change. 96
Conclusions
The burden of unintentional home injuries on children and older adults in the United States is significant. We know a great deal about which population groups are at risk and for what types of injuries. We also know that many injuries can be prevented through policies, programs, and resources that ensure safe environments and promote safe behaviors.102,103 ACA is resulting in increased access to primary care in the United States. Primary care clinicians can play a foundational role in their patient’s safety by utilizing the 3 Es (education, enforcement, engineering) of injury prevention in their practices and their communities. Taken collectively, focused attention on preventing unintentional home injuries by primary care providers can drive a reduction in injuries and thereby improve the health of our nation’s children and older adults.
Supplemental Material
Supplemental Material, AJLM_Supplement_IPResources_120115 – Primary Care Opportunities to Prevent Unintentional Home Injuries: A Focus on Children and Older Adults
Supplemental Material, AJLM_Supplement_IPResources_120115 for Primary Care Opportunities to Prevent Unintentional Home Injuries: A Focus on Children and Older Adults by Eileen M. McDonald, Karin Mack, Wendy C. Shields, Robin P. Lee and Andrea C. Gielen in American Journal of Lifestyle Medicine
Footnotes
References
Supplementary Material
Please find the following supplemental material available below.
For Open Access articles published under a Creative Commons License, all supplemental material carries the same license as the article it is associated with.
For non-Open Access articles published, all supplemental material carries a non-exclusive license, and permission requests for re-use of supplemental material or any part of supplemental material shall be sent directly to the copyright owner as specified in the copyright notice associated with the article.