
Abstract
Background. Physical activity (PA) can facilitate weight loss, help avoid weight regain, and improve body composition. This study examined the relationships between PA level and changes in anthropometric measures among university employees in a worksite wellness program. Methods. A registered dietitian provided individualized assessments at baseline followed by a 12-week education intervention with follow-up at 12 and 26 weeks. The International Physical Activity Questionnaire–Short Form was used to calculate PA ≤150 or ≥150 min/wk, median min/wk, and metabolic equivalent of task (MET) min/wk at each time point. Repeated-measures general linear model and nonparametric tests were used to assess significant differences over time. Results. Of the 64 participants, 89% were women and 50% were non-Hispanic white. At 12 and 26 weeks, participants experienced significant decreases in weight (P = .001). Among women, waist circumference and abdominal obesity decreased significantly (P < .01). PA ≥150 min/wk (n = 21) was associated with continued weight loss (P = .03) and decreases in body fat percentage (P = .02) between 12 and 26 weeks whereas PA ≤150 min/wk was associated with weight and body fat percentage regain during the same time period. Conclusion. Among women in a worksite wellness program, higher levels of PA were associated with avoiding weight and body fat regain following successful loss.
‘. . . the worksite is a location with expansive reach to encourage employees to make positive health behavior changes.’
Research supports the role of physical activity (PA) in promoting health and well-being in adults and in prevention of cardiometabolic diseases.1,2 Currently, 33% of adults in the United States are physically inactive despite evidence suggesting that physical inactivity is associated with increased health risks and mortality.3-5 With more than 130 million US adults employed, the worksite is a location with expansive reach to encourage employees to make positive health behavior changes.6-8 Healthy People 2020 objectives have identified worksites as important settings to provide health promotion programming. 9 Prior research has demonstrated strong evidence that worksite wellness programs (WWPs) incorporating nutrition, PA, and behavior interventions have positive outcomes for both employees and employers.7,8,10,11 For employees, such interventions are associated with increases in PA and health-related quality of life and reductions in weight and cardiometabolic risk factors.7,8,10,12 For employers, WWPs may help lower employee health care costs and absenteeism rates and increase productivity.13,14 The association of PA with favorable health outcomes and reducing the risk for cardiometabolic diseases makes it a public health priority.6,7,9,10
To maintain a healthy weight and obtain “substantial health benefits”15(p22) recommendations for adults are to engage in a minimum of 150 minutes of moderate-intensity PA each week.15-17 However, risk reductions for cardiometabolic disease and premature mortality have been seen at lower PA levels; between 60 and 75 minutes per week (min/wk).18-20 The American College of Sports Medicine’s guideline suggests a dose-response relationship. For example, among physically inactive adults, the recommendation is ‘‘some is good; more is better.”16(p1337) Individuals will gain some health benefits with as little as 60 min/wk of moderate-intensity PA. 16
For weight management, PA recommendations range between 200 and 420 min/wk of moderate or high intensity to facilitate weight loss and prevent weight regain.15,21-23 There is variation in individual needs for PA and additional factors including energy intake must be accounted for when trying to lose weight, maintain a weight loss and/or minimize weight regain.15,23
Abdominal obesity, measured by waist circumference (WC), and excess body fat are clinical risk factors associated with increased cardiometabolic diseases and all-cause mortality.24,25 Physical activity can help overweight and obese adults reduce WC and overall body fat and preserve muscle.26,27 Improvements in WC and body fat associated with PA interventions even in the absence of calorie restriction or weight loss have been reported.26-28 Slentz et al 26 found that overweight men and women who performed 179 min/wk of moderate PA but did not limit calories experienced significant decreases in WC and body fat percentage; similarly, a systematic review by Kay et al 28 reported significant decreases in body fat were associated with PA levels between 90 and 240 min/wk. Examining changes in WC and body composition in addition to weight outcomes provides additional insight when evaluating the role of PA in wellness interventions.26,27
For overweight and obese adults seeking health improvements, there is conflicting evidence associated with the current recommendation of 150 min/wk of moderate intensity PA.10,19,29 Studies conducted over 6 to 12 months report varying levels of PA, but all indicate that >150 min/wk is required to lose weight and to maintain a weight loss.10,19,29,30 Other studies, ranging from 3 to 12 months, associate a lower number of minutes of PA with decreases in cardiometabolic disease risk via improvements in body composition (decreased WC and decreased body fat) even if weight remains unchanged.27,28,31 Current guidelines, research studies and WWPs all agree that PA is important to facilitate weight loss, avoid weight regain, and improve body composition, but differing research results mean debate remains regarding what level of PA is associated with significant improvements in anthropometrics in all populations.10,15-17,19,29,32
Purpose
The aims of this study were to explore the relationships between physical activity level and changes in anthropometric measures among participants in a university based worksite wellness program. It was hypothesized that at each postintervention time point (12 and 26 weeks after baseline) participants who reported ≥150 min/wk of PA would have (a) a greater percentage of weight loss, (b) a greater decrease in body fat, and (c) a greater decrease in WC when compared with participants whose PA was <150 min/wk at the same time points.
Methods
Design
Lifestyle Intervention for Total Health—a University Program (LIFT UP) is a worksite wellness program (WWP) study conducted by Rutgers, the State University of New Jersey’s Institute for Nutrition Interventions. 33 It provides individual assessment and counseling at baseline, followed by 12 weeks of educational intervention on diet/nutrition, PA and behavior modification that incorporate the American Heart Association’s guidelines.6,33 Data collection, monitoring, and follow-up counseling occur at 3, 6, 12, and 24 months after baseline. The program is available to Rutgers employees on the Newark campus, located in urban, northern New Jersey, and on the Piscataway and New Brunswick campuses, both located in suburban, central New Jersey. Enrollment in LIFT UP is voluntary; there are no monetary incentives. Rutgers University’s Biomedical and Health Sciences Newark Institutional Review Board approved the original study protocol (2013), renewals are approved annually (2014).
Sample
This study was an interim analysis of LIFT UP data from Rutgers employees who enrolled and completed 12 and 26 week appointments between January 1, 2013 and July 31, 2014. Eligibility criteria for participants include; being 18 years of age or older, a body mass index (BMI) of ≥25 kg/m2, and/or a WC of ≥88 cm for women and ≥102 cm for men.
Measures
The LIFT UP registered dietitian (RD) meets with each participant at baseline (BSL) and again at weeks 12, 26, 52, and 104. Data collected at BSL includes self-reported demographic characteristics (age, gender, and race), cardiometabolic diseases and prescription and over-the-counter medications and supplements. At each time point, anthropometric parameters measured by the RD include the following: height in inches to the nearest tenth using a portable stadiometer (BSL only), weight in pounds to the nearest tenth, BMI, and body fat percentage measured with an internally calibrated body composition analyzer (Tanita BC-418, Tanita Worldwide, Arlington Heights, IL). WC is measured over the participant’s thin shirt in centimeters (cm) to the nearest tenth with a standard tape measure at the midpoint between the highest point on the iliac crest and the lowest point of the costal margin in the mid-axillary line. 34
At each time point, participants complete the International Physical Activity Questionnaire–Short Form (IPAQ-SF), a validated self-administered questionnaire that measures typical PA levels. 35 The IPAQ-SF asks participants to estimate the number of minutes of PA spent at 3 levels: walking, moderate-intensity activities, and vigorous-intensity activities over the past 7 days. 36 Using the tool’s data processing protocols, participants’ total weekly PA is calculated categorically into low-, moderate-, or high-level PA, as median minutes per week and as continuous median metabolic equivalent of task (MET) min/wk. 36 Computation of the total minutes per week and MET min/wk require summation of the duration (minutes) multiplied by the frequency (days) of walking, moderate and vigorous activities to obtain median minutes per week, which are then multiplied by IPAQ MET activity factors to obtain MET min/wk. 36 For the purposes of this study, participants were considered to have met the recommended level of 150 min/wk of moderate intensity PA based on IPAQ-SF calculated MET min scores.15-17 Those with ≥600 MET min/wk were coded as ≥150 min/wk of PA and participants with <600 MET min/wk were coded as <150 min/wk of PA. 36 All truncation guidelines were followed per the IPAQ-SF scoring protocol. 36
Intervention
At the BSL appointment, participants receive individualized diet recommendations by the LIFT UP RD tailored to their usual dietary patterns, food preferences, and energy needs for weight management. The dietary intervention is based on recommendations from the American Heart Association, the National Cholesterol Education Program, and the National Heart, Lung, and Blood Institute’s Dietary Approaches to Stop Hypertension (DASH) diet.6,37,38 The Mifflin–St. Jeor equation is used to estimate energy needs for weight loss and adjusted based on clinical practice. 39 PA recommendations are provided by the RD at each time point after the participant completes the IPAQ-SF and focus on increasing aerobic PA levels toward a goal of 150 min/wk or to a higher level depending on participant abilities.
After the BSL appointment, participants begin a 12 week series of education sessions (the intervention), available through on-site live sessions and/or via an online distance learning platform. LIFT-UP is designed to reduce cardiometabolic disease risk and improve health-related quality of life, diet, and PA behaviors. Participants meet with the RD at week 6 for a weight check and to answer any questions or concerns regarding their diet or PA. There are voluntary biweekly in-person weight checks throughout the first 12 weeks and participants have access to the study RD for questions and challenges throughout the study via telephone, email and scheduled follow-up appointments for data collection, monitoring and counseling at weeks 12, 26, 52, and 104.
Analysis
SPSS version 21.0 (IBM Corp, Armonk, NY) was used for all data entry and analysis; an a priori power analysis using G-power version 3 software for a repeated-measures general linear model (GLM) with a conservative effect size required 44 participants at each time point to detect the relationship between PA level and changes in anthropometrics (effect size d = 0.25, power = 0.95, α error probability = 0.05).
Descriptive analyses included frequency distributions for gender, race, cardiometabolic diseases and associated prescription medications, BMI and BMI category, age, weight, WC including abdominal obesity, 34 body fat percentage, and PA. Percentage weight change and changes in abdominal obesity were explored with Kruskal-Wallis test. Outliers and extreme outliers were assessed but not removed because extremes are likely in a sample of overweight and obese adults.
Primary outcome measures included changes in proportions of participants who reported less than compared with ≥150 min/wk of PA from BSL to 12 and 26 weeks using McNemar’s test for change. Changes in total MET min/wk of PA over the 3 time points were tested with Friedman’s analysis of variance. Differences in the PA level and participants who lost compared with gained weight, WC, or body fat percentage were tested using Pearson’s chi-square. Changes in anthropometric outcome measures (weight, WC, and body fat %) from BSL to weeks 12 and 26 and between 12 and 26 weeks and the relationships between PA level and the changes in anthropometric outcome measures at weeks 12 and 26 were tested using repeated measures GLM. Prior to performing GLM analyses, the relationships between select descriptive characteristics at BSL and PA level were considered as potential covariates. There were no significant differences in PA level and gender (P = .09), ethnicity (White, Black, Hispanic, Asian/other, P = .63), BMI category (P = .71), or number of cardiometabolic diseases (P = .66). There were no significant difference in PA level by age (P = .67). Because none of these potential covariates were statistically significant, they were not included in the GLM. Mauchly’s test of sphericity was significant for weight and WC (female) therefore Greenhouse-Geisser corrections were used.
To meet inclusion criteria for return appointments and be considered “on time,” participants must complete their 12-week appointment between 10 and 14 weeks after BSL and complete their 26-week appointment between 24 and 28 weeks after BSL. Significant differences were identified at 26 weeks between the “on time” and “not on time” participants. The “not on time” participants had a larger mean (standard deviation) BMI at baseline of 38.9 (8.9), compared to the “on time” participants mean BMI of 33.9 (6.1) (P = .008). Baseline WC in females was significantly different between the 2 groups; “not on time” mean WC was 114.3 (19.8) cm. compared with 98.0 (12.1) cm (P = .001). The findings of significant differences between “on time” and “not on time” groups supported the exclusion of the “not on time” participants from the current analyses.
Significant BSL differences also existed between participants who completed both follow-up appointments “on time” compared with those who never returned after the BSL appointment. Participants lost to follow-up were significantly younger, with a mean age of 45.9 (11.0) years and heavier, with a mean of BMI of 35.8 (6.6).
Figure 1 outlines the total number of participants at each time point. Sixty-four participants (30%) completed both 12- and 26-week appointments “on time” and were included in this study.
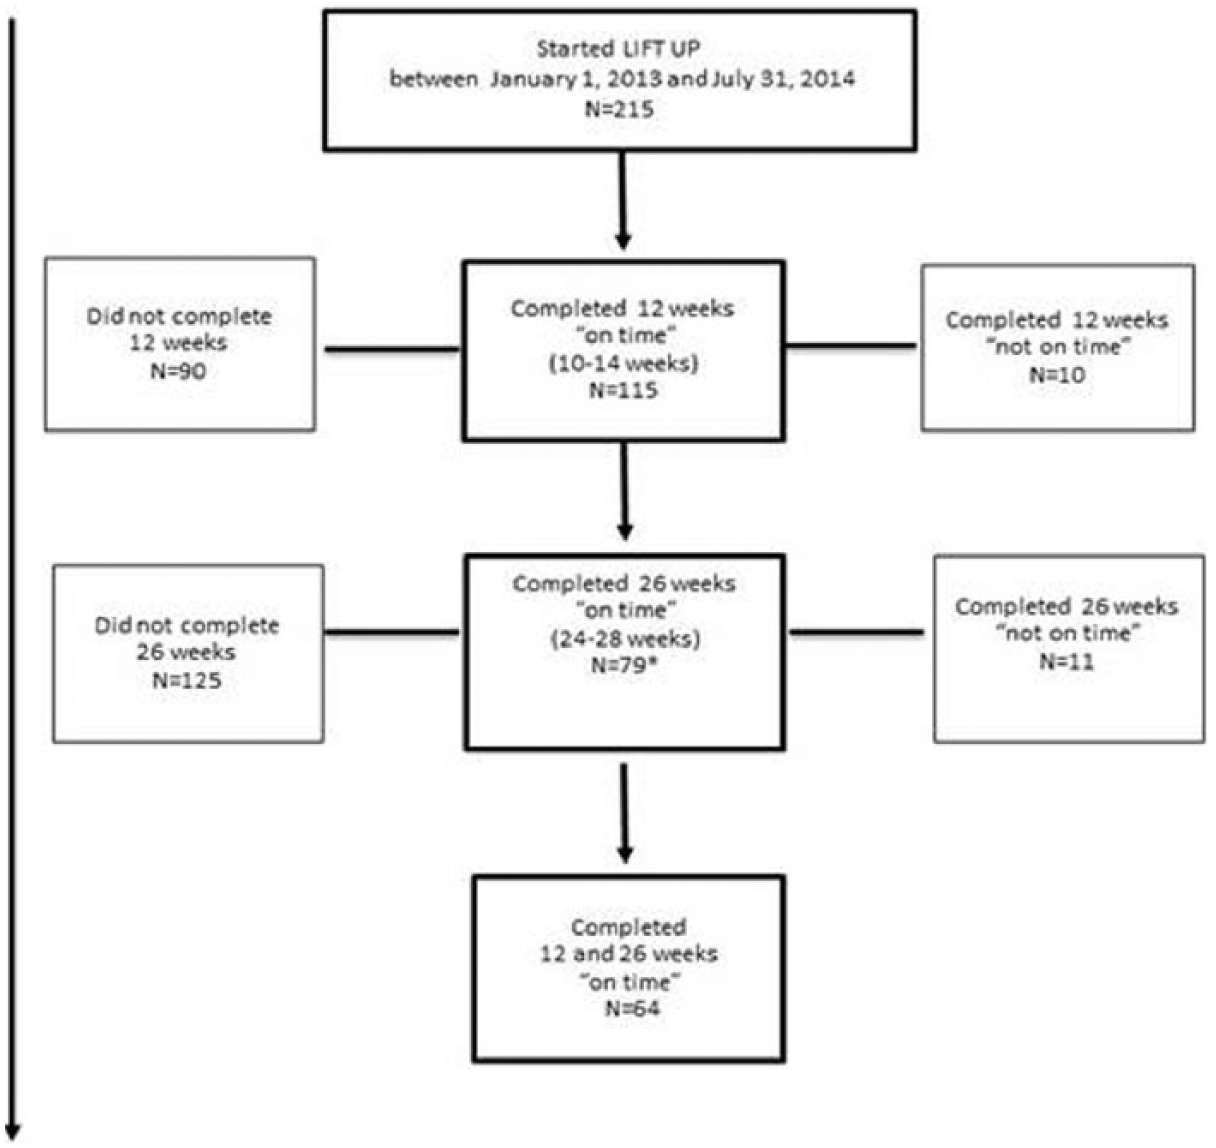
LIFT UP participation and follow-up from baseline to 12 and 26 weeks.
Results
Participant Characteristics
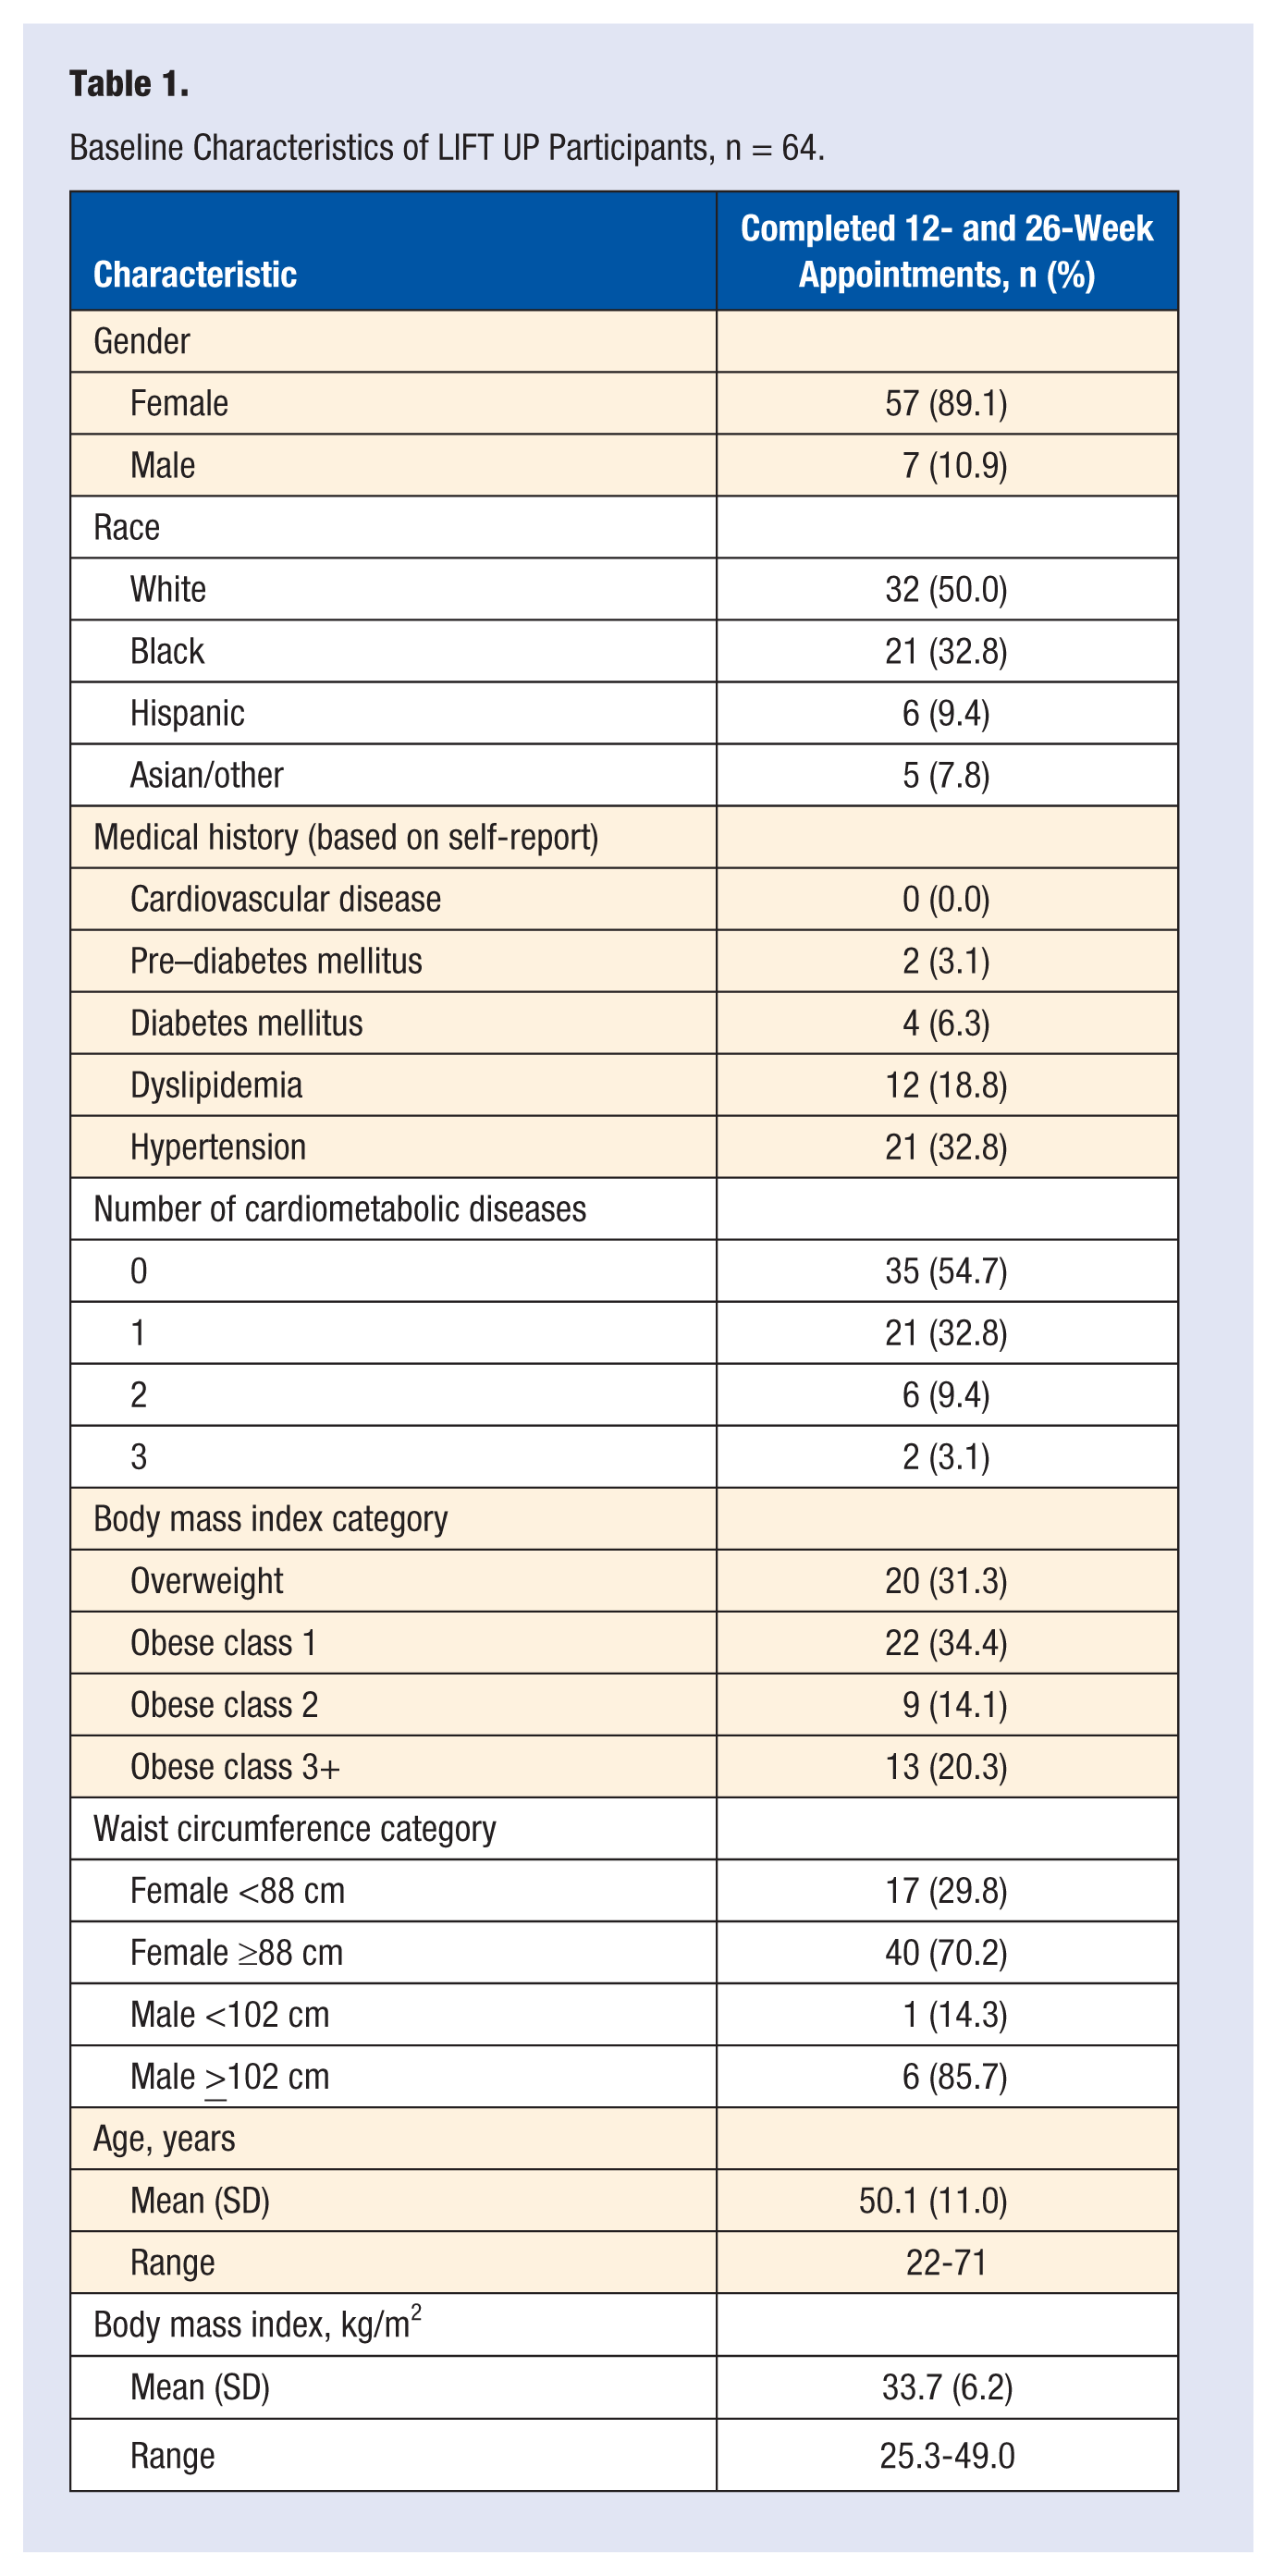
At BSL, the majority of participants were female (89%), 50% were non-white and 69% were obese (Table 1). Fifty-five percent (n = 35) reported no cardiometabolic diseases, and hypertension was the most frequently reported disease (33%, n = 21). Of the 48% (n = 31) taking any medications at BSL, the most prevalent medication was for hypertension (34%, n = 22); 19% (n = 12) reported taking medication for dyslipidemia. Using McNemar’s test for change, there were no significant changes in participants’ medication usage (for blood pressure, lipid, or diabetes mellitus) between the 3 time points.
Baseline Characteristics of LIFT UP Participants, n = 64.
Significant within-subjects decreases were observed for weight from BSL to 12 and BSL to 26 weeks (Table 2). At 26 weeks, the mean weight loss was 4.1 (standard error [SE] = 0.9) pounds, with a mean percent weight change of −2.1%. Only female participants had significant decreases in WC over time; at 26 weeks WC decreased by 2.5 (SE = 0.7) cm in women.
LIFT UP Participants’ Anthropometric Measures at Baseline, 12 Weeks, and 26 Weeks, n = 64.
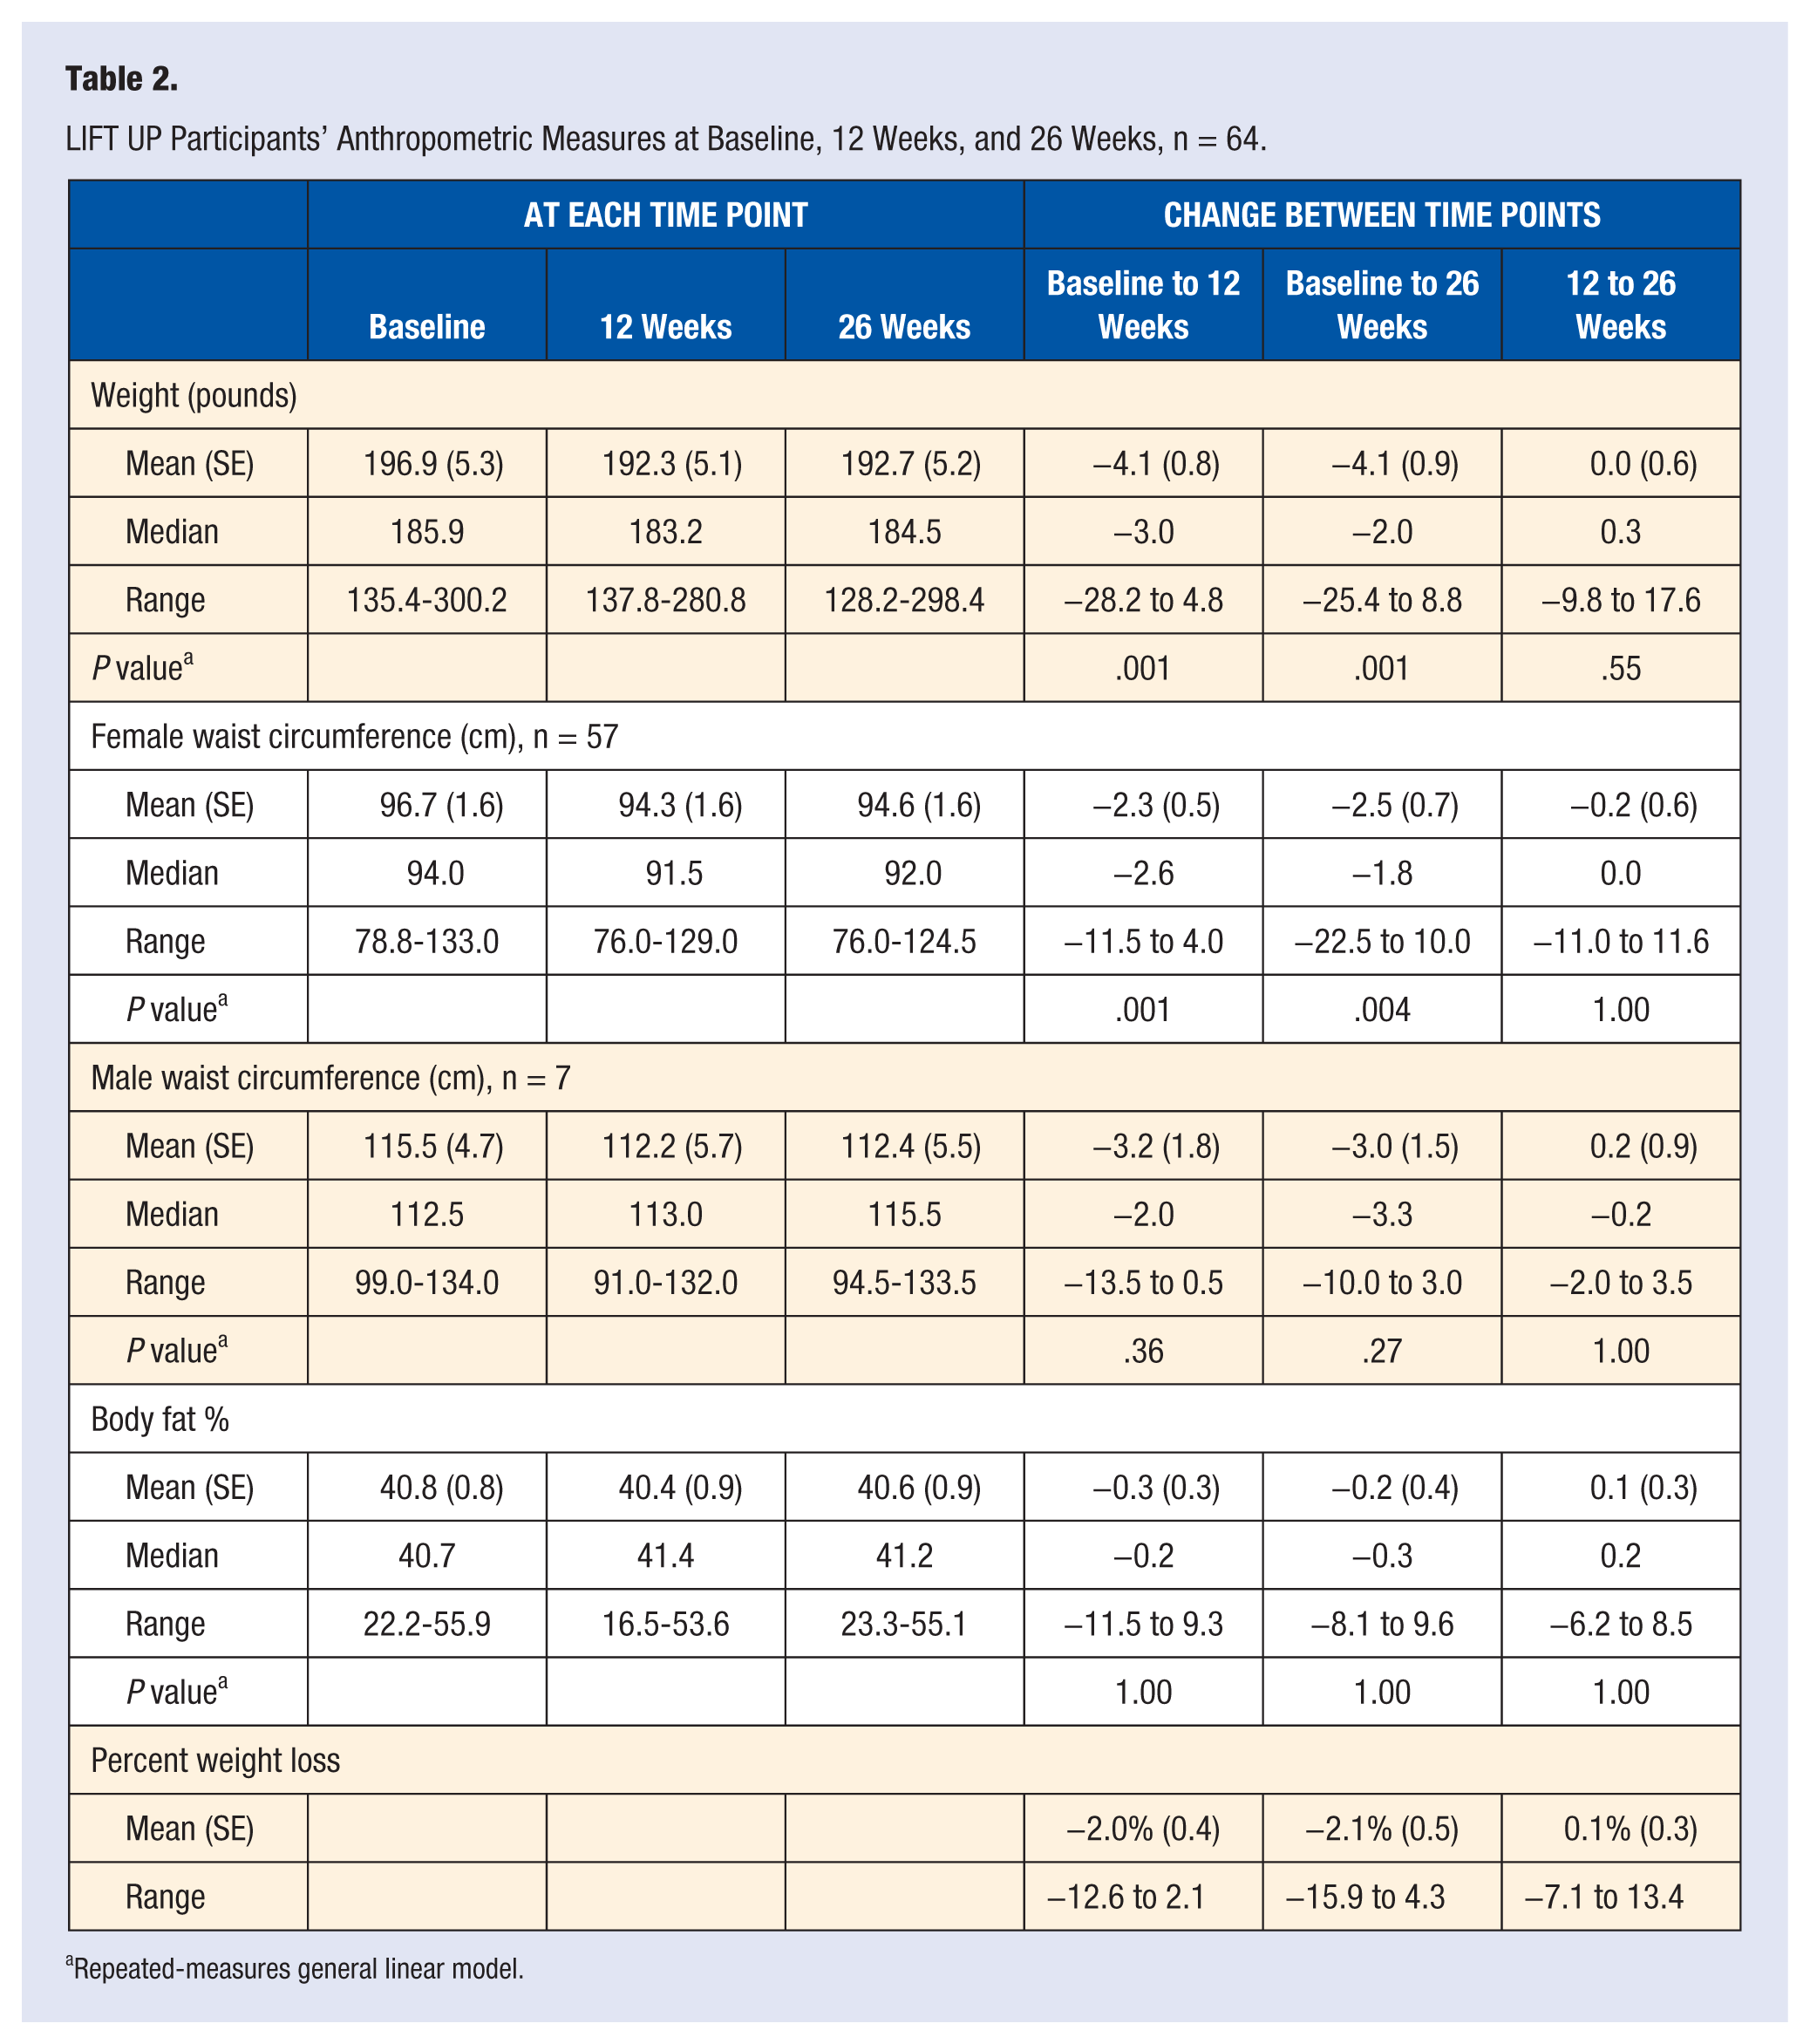
Repeated-measures general linear model.
At 26 weeks, 66% (n = 42) of participants lost weight. There were significant decreases in BMI category over time, at BSL 31% (n = 20) were overweight and 69% (n = 44) were obese. After 26 weeks, 3% (n = 2) of the participants had a normal BMI, 36% (n = 23) were overweight and 60% (n = 39) were obese, a 9% decrease in obesity (P = .001).
Although there were no significant differences in BSL BMI category by ethnicity or by campus, there were significant differences when comparing the percent of weight lost between white and non-white participants from BSL to 26 weeks. White participants had a mean loss of 3.3% while non-white participants lost 0.9% of their BSL weight (P = .03).
Two-thirds (63%, n = 40) of participants decreased their WC at 26 weeks. There was a statistically significant reduction in the proportion of women with WCs reflective of abdominal obesity from BSL to 26 weeks; 25% (n = 14) had a WC <88 cm at BSL and 39% (n = 22) had a WC <88 cm at 26 weeks (P = .001).
Changes in MET min/wk and median minutes per week both improved, but were not significant over time (P = .55 and P = .88, respectively). There was an 18% increase in MET min/wk at 12 weeks, from 504.0 MET min/wk at BSL to 596.0 MET min/wk (Table 3). Despite a small decrease from 12 to 26 weeks, there still was a 13% improvement over BSL, 567.4 MET min/wk at 26 weeks. Thirty-three percent of participants (n = 21) reported PA ≥150 min/wk at both 12 and 26 weeks.
LIFT UP Participants’ Physical Activity Levels at Baseline, 12 Weeks, and 26 Weeks, n = 64.
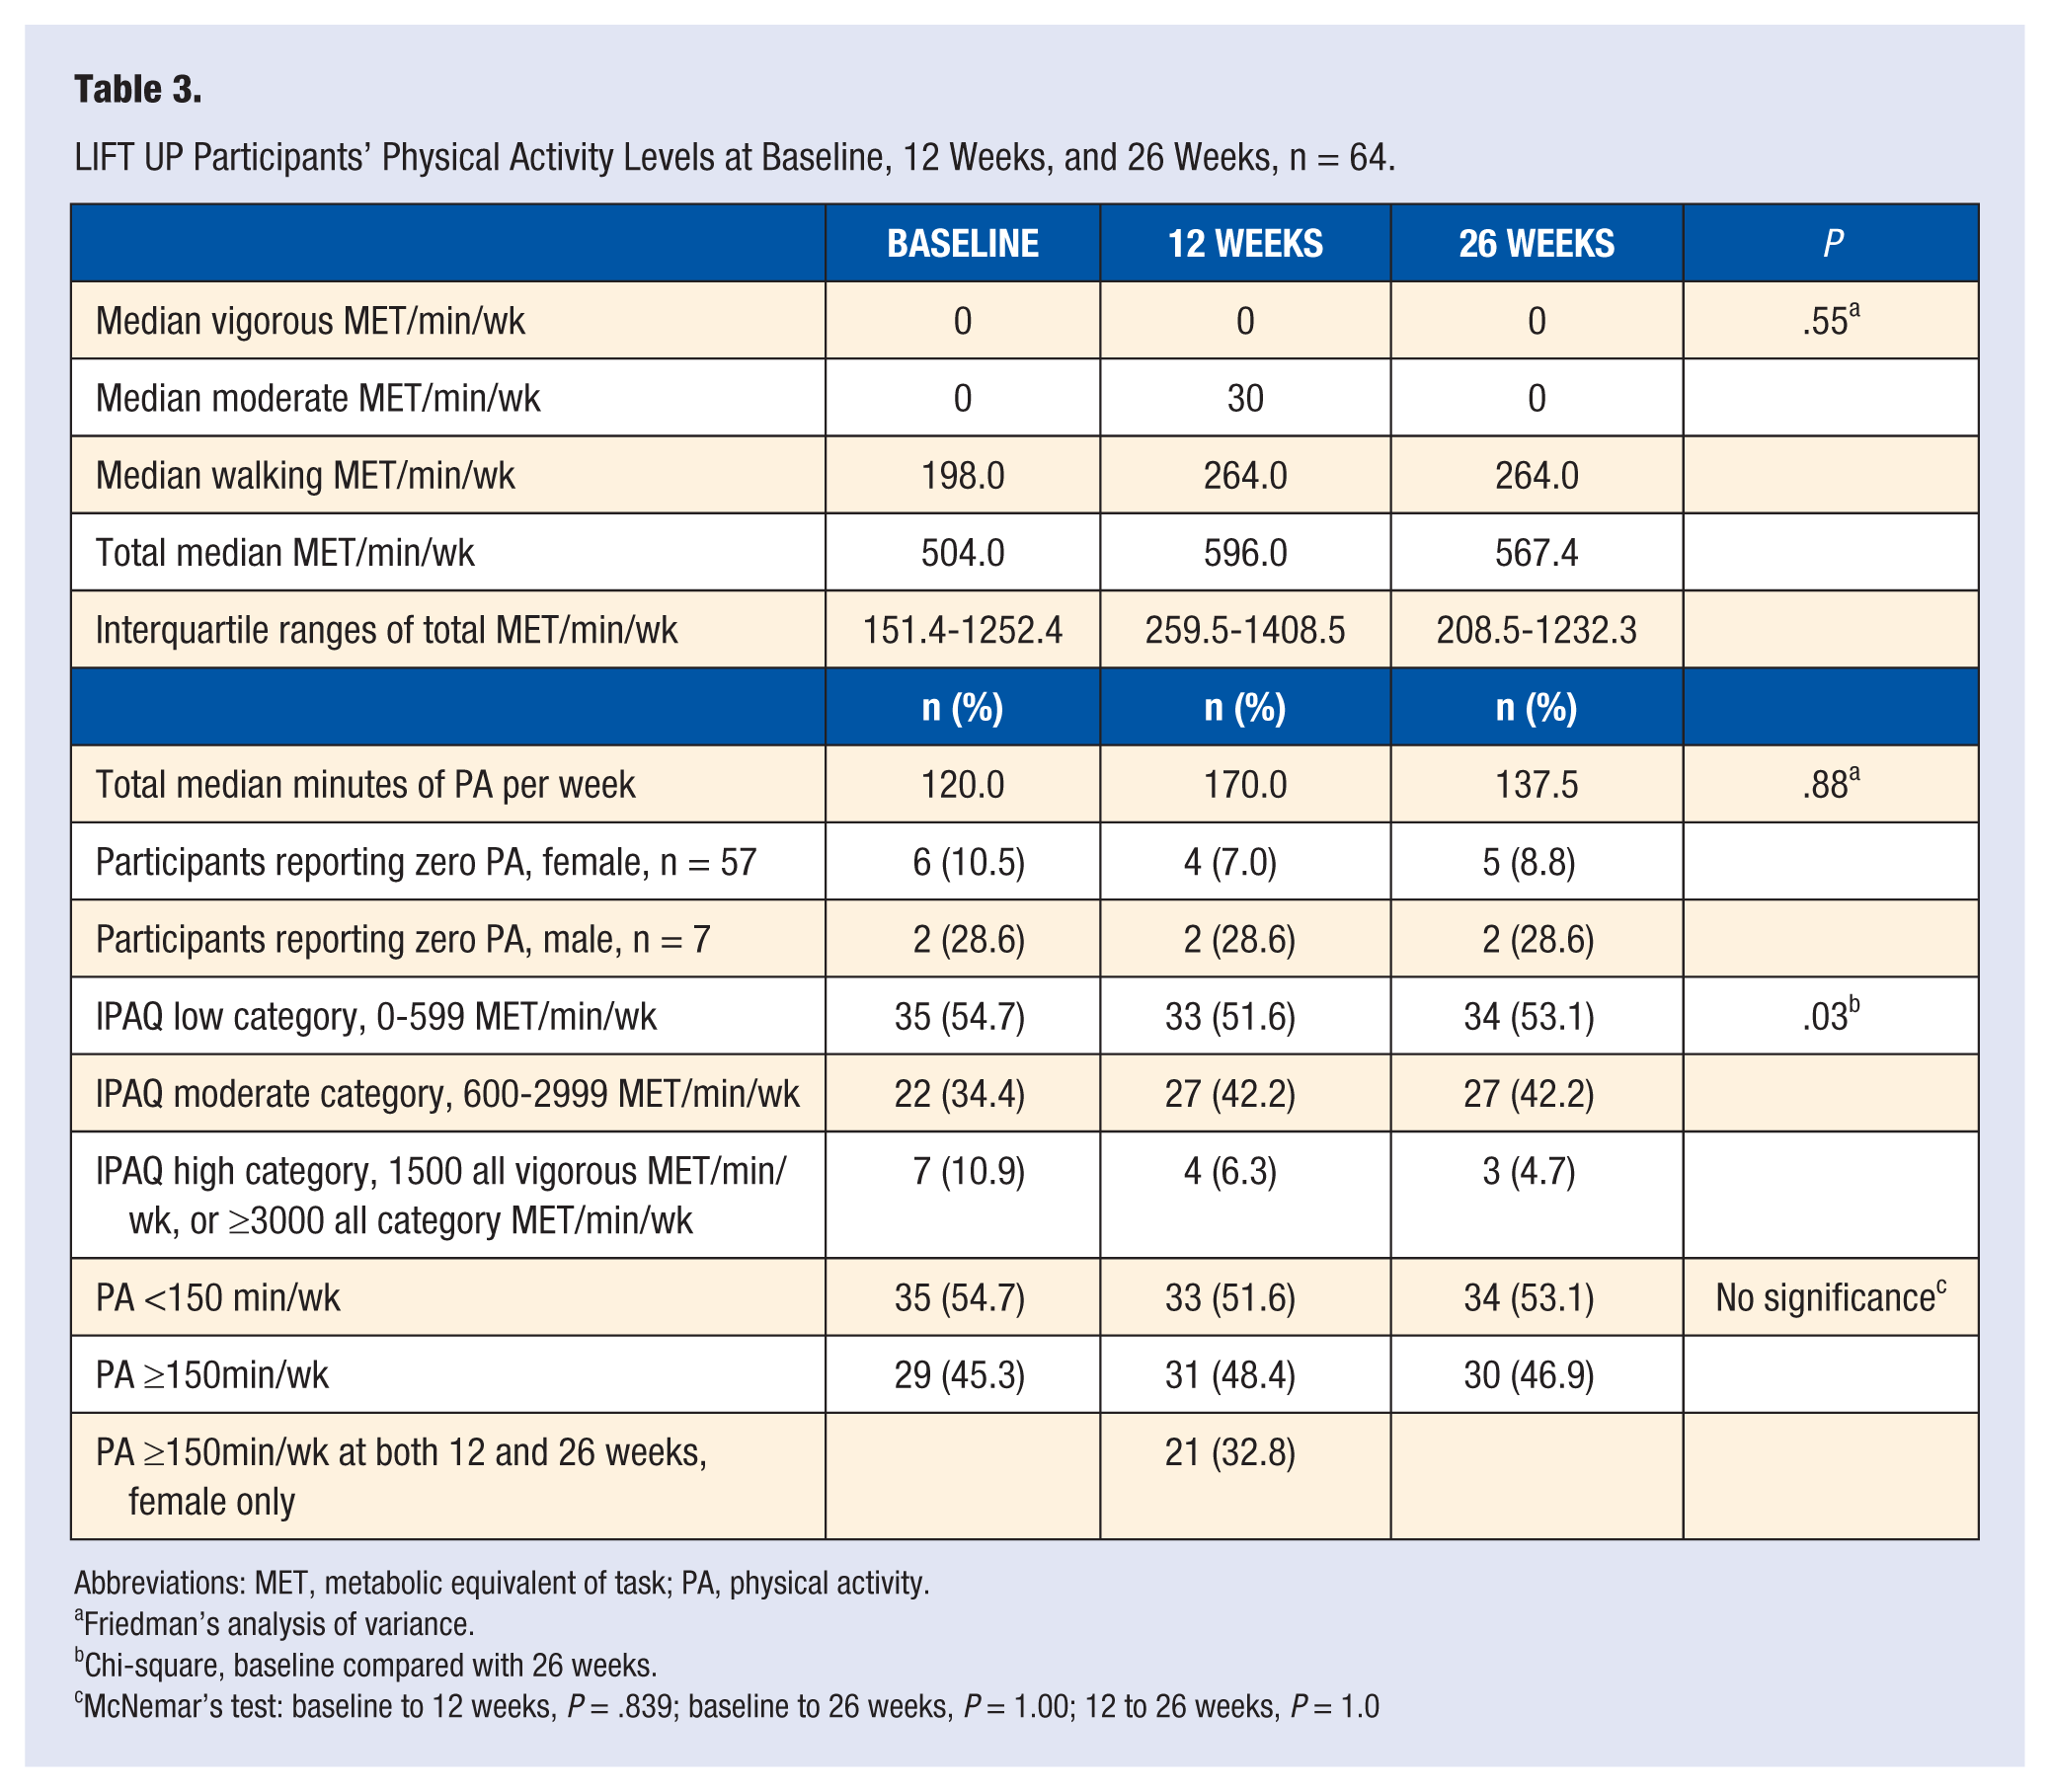
Abbreviations: MET, metabolic equivalent of task; PA, physical activity.
Friedman’s analysis of variance.
Chi-square, baseline compared with 26 weeks.
McNemar’s test: baseline to 12 weeks, P = .839; baseline to 26 weeks, P = 1.00; 12 to 26 weeks, P = 1.0
Subgroup analyses revealed significant differences in PA level between overweight and obese participants at 26 weeks. Overweight participants reported 848.4 MET min/wk compared with obese participants reporting 346.5 MET min/wk (P = .04). At 26 weeks, female participants without abdominal obesity had significantly greater MET min/wk compared with participants with a WC ≥88 cm, 732.0 MET min/wk compared with 396.0 MET min/wk (P = .04).
No significant interaction effect with PA was detected for changes in weight (F = 0.37, P = .73), WC (female) (F = 1.39, P = .69), or body fat percentage (F = 0.52, P = .47) indicating that the changes in outcome variables by PA level did not differ across the 3 time points.
Participants’ changes in weight, WC and body fat percentage were explored categorically (lost vs gained) to determine if PA levels of <150 and ≥150 min/wk over time were associated with significantly different changes in anthropometrics. In women, PA levels ≥150 min/wk at both 12 and 26 weeks, were associated with small, significant improvements in anthropometrics (Figure 2). These participants with higher PA levels (n = 21) lost −0.3 (SE = 1.3) pounds between 12 and 26 weeks (P = .03). Over this same time, participants reporting higher PA (≥150 min/wk) also experienced continued decreases in their body fat percentage, −0.9% (SE = 0.4) when compared with <150 min/wk of PA (P = .02). At 26 weeks the MET min/wk of these female participants who continued to lose weight and decrease their body fat percentage was 1320.0 MET min/wk (270 median minutes per week) compared with participants with weight and body fat regain reporting 318.0 MET min/wk (90 median minutes per week) (Figure 3). All women had small decreases in WC between 12 and 26 weeks but women who reported ≥150 min/wk of PA between 12 and 26 weeks had a larger decrease in WC, −0.4 cm compared with −0.2 cm at the lower PA level (Figure 4).
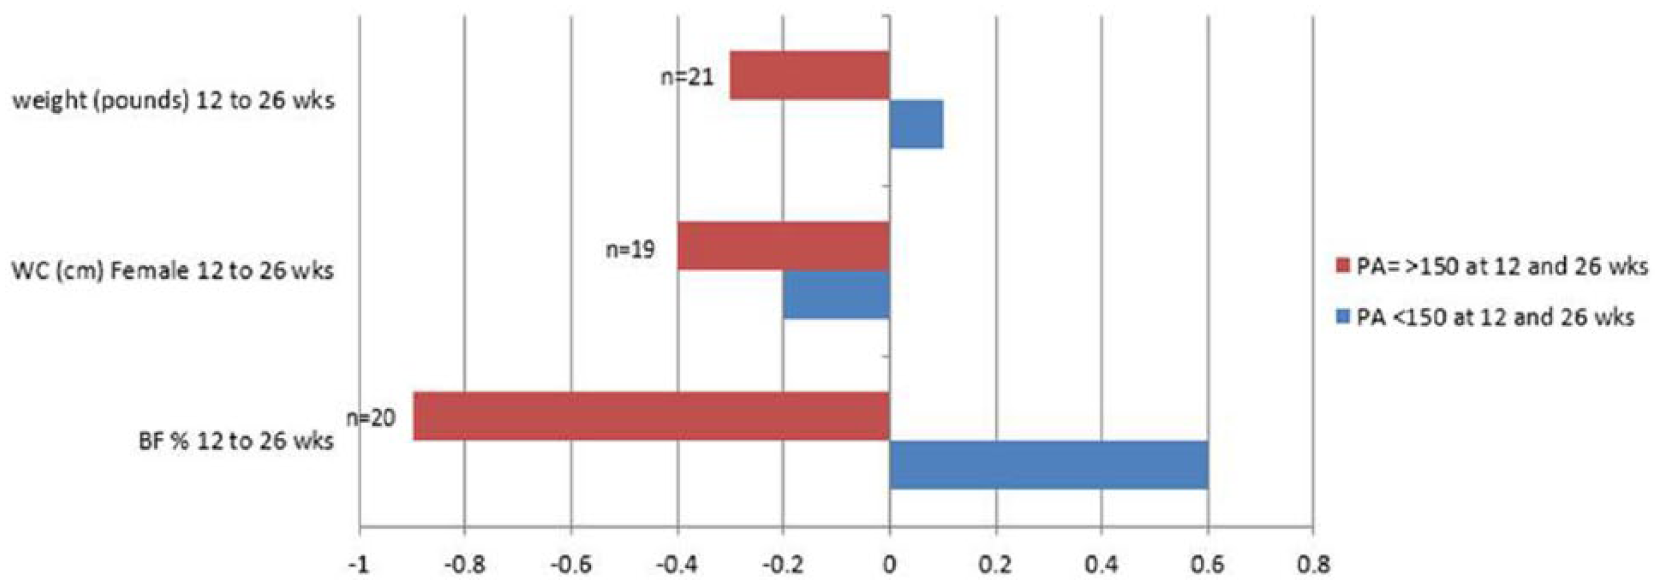
Physical activity (PA) level and changes in anthropometrícs in women between 12 aad 26 weeks. BF, body fat; WC, waist circumference.
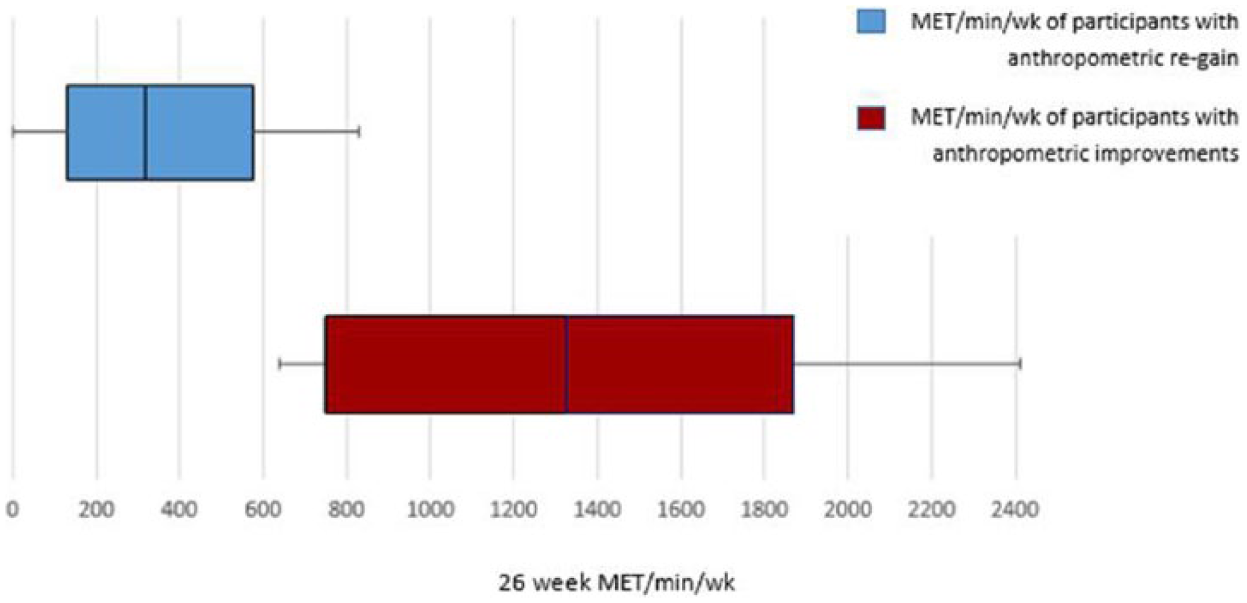
Twenty-six-week metabolic equivalent (MET) minutes of participants with improved weight and body fat percentage compared with participants who regained weight and body fat percentage between 12 and 26 weeks, n = 64.
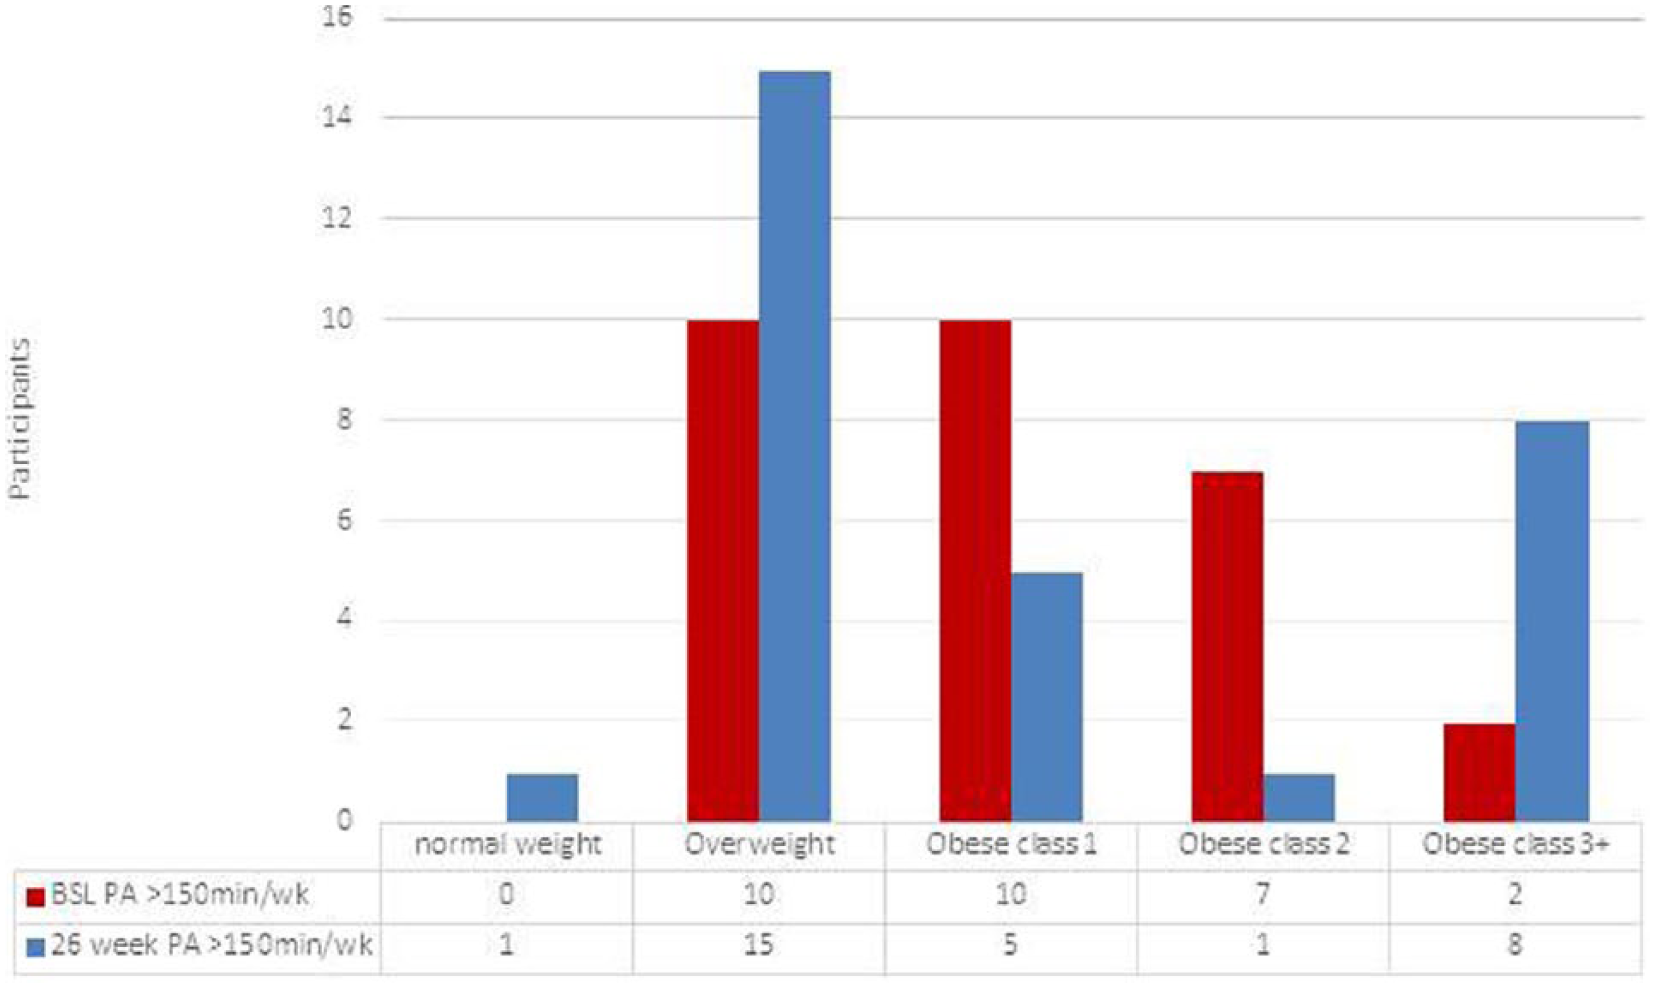
Self-reported PA ≥150 minutes by BMI category at baseline and 26 weeks, n = 64. BMI, body mass index; BSL, baseline; PA, physical activity.
Discussion
The hypotheses of this study were supported at 26 weeks; participants who reported PA ≥150 min/wk had greater improvements in their anthropometric measures (weight loss and decreases in WC and body fat percentage) compared with participants who report less than 150 min/wk of PA.
Increased weight and high WC, which are established health risk factors for cardiometabolic disease 40 , decreased significantly over time. The BSL to 26 week mean weight change of −4.1 pounds (2.1% weight loss) are similar to results reported by other worksite wellness programs.10,41 A systematic review by Anderson et al 10 reported that WWPs between 6 and 12 months had a mean weight loss of 2.8 pounds. This study’s findings are also similar to those of Touger-Decker et al 41 who compared the effectiveness of delivery method in university-based worksite weight management program in the same institution. The authors reported that after the 12-week active intervention phase, both Internet and in-person groups experienced significant reductions in weight and, after 26 weeks, weight loss remained significantly lower from baseline, a mean loss of 4.8 pounds (2.3% weight loss). 41
There were significant differences in the percentage of weight lost from BSL to 26 weeks between white and non-white participants with whites losing more weight at 26 weeks. Prior research reports the overall prevalence of obesity has increased significantly in non-white women over the past decade and participation in WWP’s is lower in non-white workers.42,43 Flegal et al 42 explored the prevalence of obesity over a 12-year period; overall, there were no significant increases among women, but categorically there were statistically significant increases in obesity in non-Hispanic black women and in Mexican American women. Robroek et al 43 systematically reviewed participation characteristics in WWPs and reported white workers had a higher participation than other ethnicities (odds ratio = 1.33; 95% CI = 0.91-1.95). The current study likewise found racial differences in outcomes. Future investigations may explore programming changes to help diverse groups experience similar outcomes. 43
Over time, participants of LIFT UP reported increases in PA. Although not statistically significant, at 26 weeks MET min/wk remained 12.6% higher than at BSL and 26-week total median minutes were 14.6% higher. At 26 weeks, almost one-half of the participants reported PA levels ≥150 min/wk. When examining the relationship between PA level and BMI category, a Centers for Disease Control and Prevention report using the Behavioral Risk Factor Surveillance System (BRFSS) 2011 data found negative linear relationships between PA and weight status with only 21.9% of overweight and 13.5% of obese individuals meeting PA guidelines. 44 In this study, the percentage of participants obtaining ≥150min/wk of PA at both 12 and 26 weeks was higher than the BRFSS data, at 26 weeks, 64% of overweight participants and 36% of obese participants had PA levels ≥150 min/wk. Future studies may include PA level by class of obesity. Overall, the increased percentage of both overweight and obese participants reporting PA at higher levels may be a positive effect of active weight management.
In the general population, physical inactivity is associated with increased incidence and worsening percent of obesity and reported minutes of PA/wk decrease as BMI increases. 44 In the current study, there were significant improvements in BMI at 26 weeks and a significantly greater number of overweight compared to obese participants reported higher PA levels. At 26 weeks, the 9% decrease in the number of participants in the obese category is a significant positive trend. Eighty percent of participants who moved out of the obese category reported PA levels ≥150 min/wk at both 12 and 26 weeks suggesting that the higher level of PA may have been associated with their BMI improvements. Despite the lack of a control group, and the fact that most participants did not reach the recommended amount of PA, the findings that participants reporting increased levels of PA experienced improvements in their BMI suggests there may be a dose-response relationship between PA and weight loss.45-47
For weight loss maintenance, PA recommendations range between 200 and 420 min/wk of moderate or higher intensity to prevent weight regain.15,21-23 Although research trials reporting higher levels of PA (≥150min/wk) are effective for preventing weight gain and enhancing long-term weight loss maintenance19,29,30 there is limited published data of these higher levels of PA in WWPs. A 2013 systematic review of PA levels in WWPs reported weekly MET/min ranging from 205.8 to 887.3. 48 In the current study, participants who achieved PA levels ≥150 min/wk at both 12 and 26 weeks continued to lose weight and reduce their body fat. These participants also met the current PA guidelines for weight maintenance reporting 270 minutes of PA (1320 MET min/wk) at 26 weeks. Andersen et al 49 monitored anthropometrics over 1 year after a 16-week intervention and reported that participants who were most active (defined as reporting PA ≥150 min/wk 79.2% of the time between 4 and 12 months) lost more weight, −1.9 (4.3) kg than participants who were least active (reporting PA ≥150 min/wk 19% of the time between 4 and 12 months) and regained 4.9 (2.5) kg. McTiernan et al 46 also reported findings comparable to the present study; they explored the role of PA in the prevention of weight gain at BSL, 3, 6, and 12 months. Women reported 364 min/wk of PA at 6 months and 298 min/wk at 12 months. The PA group reported a mean weight loss was −1.4 kg (−1.8%) compared with an increase of 0.7 kg (0.9%) in controls. 46 WC in the PA group decreased −1.4 cm compared with a 2.2 cm gain in controls. 46 The continued improvements in anthropometrics between 12 and 26 wks in LIFT UP and in other studies of longer duration support the important role PA plays in avoiding weight regain following successful weight loss and demonstrate PA’s association as a predictor of sustaining anthropometric improvements.29,50,51
Limitations and Strengths
Reasons for nonreturn/drop out of noncompleters were not explored. The high attrition rate may have been associated with either of 2 events that occurred during the study time frame; a record breaking winter season (2014) and the merger that occurred between the University of Medicine and Dentistry of New Jersey (UMDNJ) and Rutgers University on July 1, 2013, which for some participants may have resulted in position reassignment or change in location. There was no control group; participants in LIFT UP were self-selected, a known limitation in worksite interventions. 52 The study was designed as a pre-post intervention to explore within subject or cohort changes over time. The results of this study reflect outcomes of a voluntary lifestyle intervention program among university employees. Since this is a university where all business is conducted in English language data were not collected. Participants self-reported their role at the university as faculty or staff but education level was not collected.
Strengths of this study include diverse ethnic representation, 50% of participants were nonwhite. The mean age of participants reporting PA ≥150min/wk at both follow-up appointments was 50.6 (9.2) years. This is in comparison with a meta-analysis by Rongen et al 53 who reported that WWP aimed at improving PA were more effective among younger populations (<40 years). The use of 1 clinical RD and a validated PA reporting tool and with a standardized research protocol for data collection minimized interrater reliability.
Conclusions
The findings of this interim analysis of overweight and obese adults in a WWP demonstrate that although overall improvements in PA were modest, women who had PA levels of ≥150 min/wk at both time points experienced continued positive trends in anthropometrics between 12 and 26 weeks. These findings support the available evidence that PA is an important component associated with health behavior maintenance.
Self-reported PA, despite using a validated tool, may induce recall or reporting bias. 54 Combining self-reported PA with objective PA measures, such as heart rate monitors, accelerometers or global positioning system technology can improve the measurement of PA and is an area for future research. 54 This study only evaluated self-reported aerobic PA over the prior 7 days at each time point. Limited research involving strength training in worksite wellness programming has been identified as a limitation. 53 Future programming may include education and interventions addressing strength/resistance training in the WWP setting.
Continued research in WWPs examining interventions in overweight and obese men and women that include changes in anthropometrics and explore PA interventions at higher levels and over longer time periods are warranted to confirm and expand on these findings.
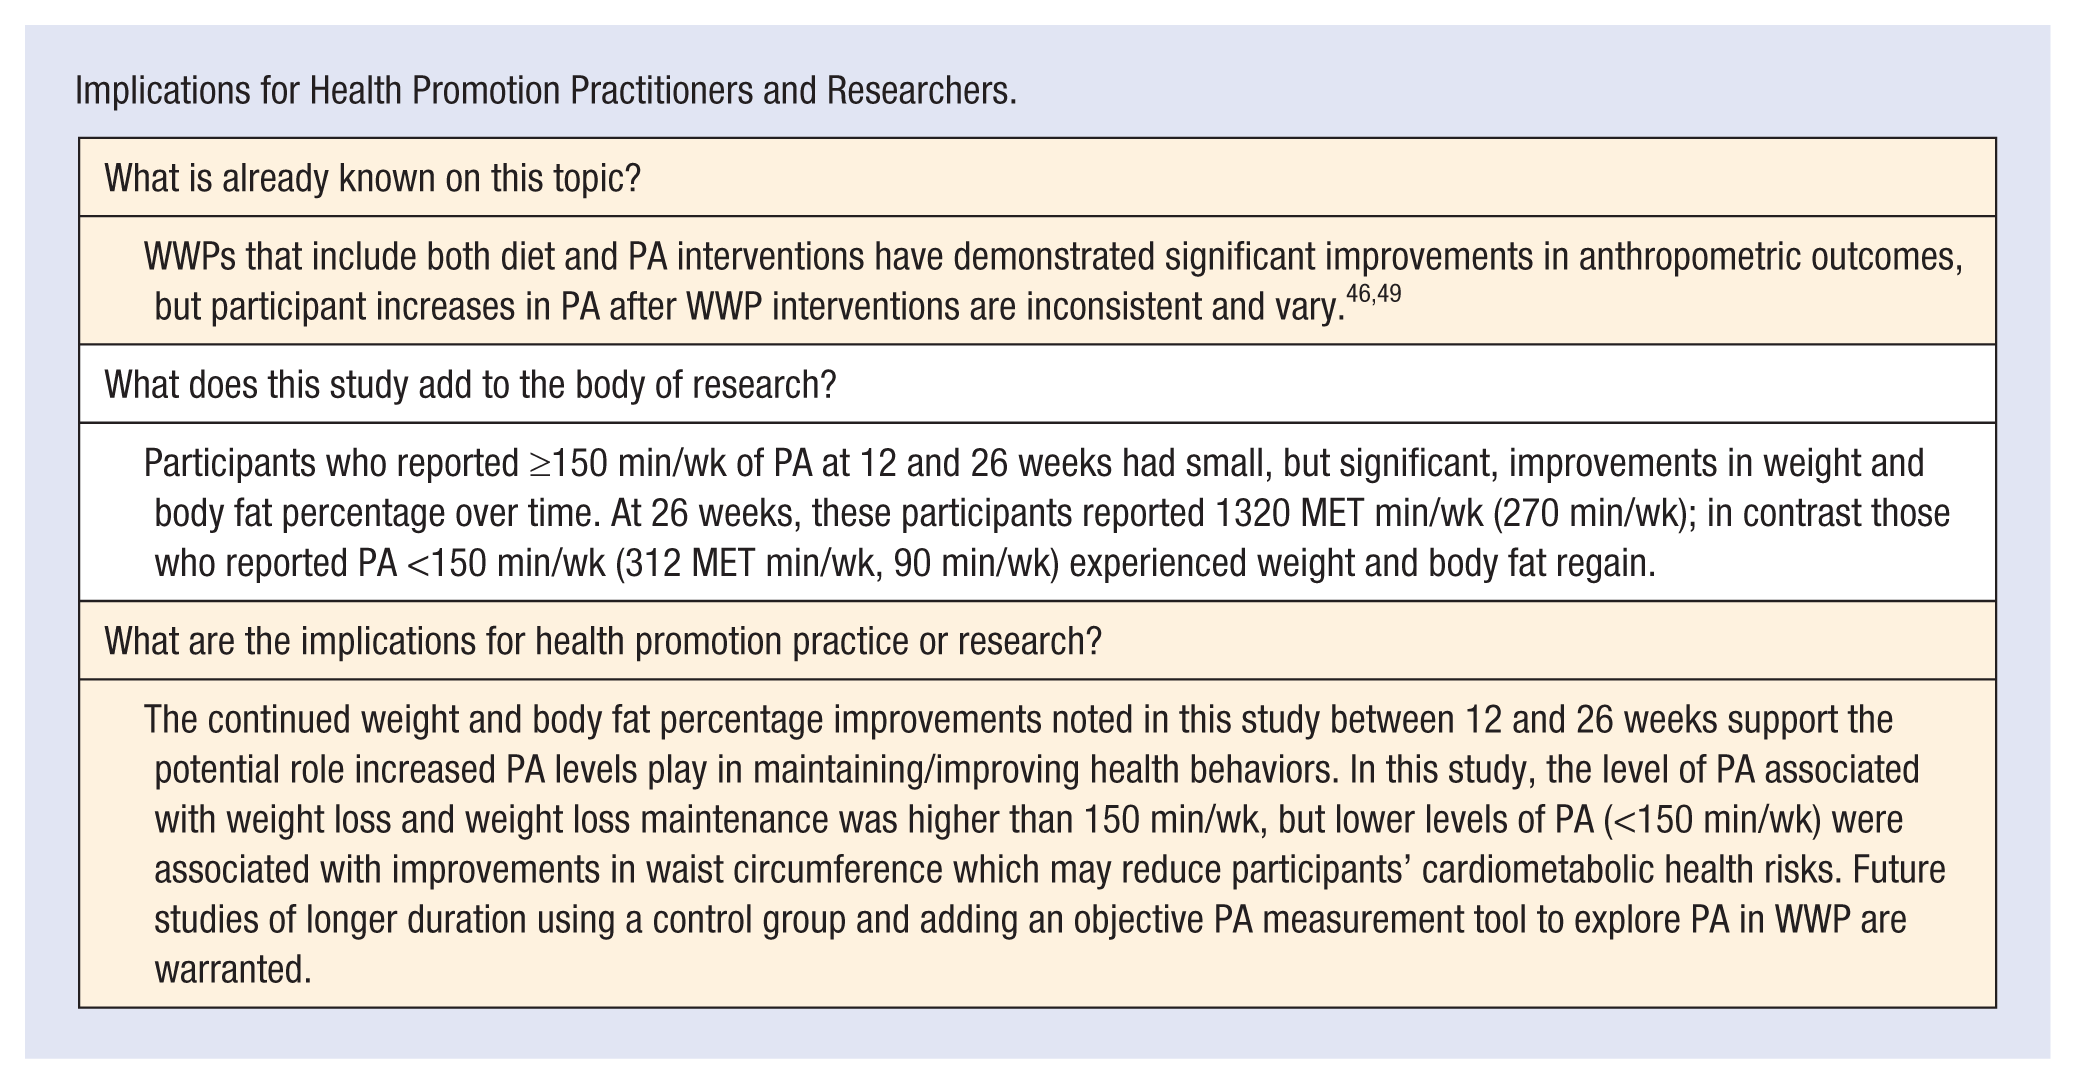
Implications for Health Promotion Practitioners and Researchers.
Footnotes
Declaration of Conflicting Interests
The author(s) declared no potential conflicts of interest with respect to the research, authorship, and/or publication of this article.