
Abstract
The main objectives of this article were to determine the demographic factors, the program related factors and the behavioral factors that influence Michigan Expanded Food and Nutrition Education Program and Supplemental Nutrition Assistance Program–Education outcomes. Secondarily, we sought to understand the trends and changes in Healthy Eating Index (HEI) scores across the differing baseline score groups. The data were collected by nutrition instructors in a pretest, posttest design to capture change in healthy eating habits through changes in HEI scores. The participants were all low-income program participants during the years of 2011 and 2012, living in Michigan. Findings show that eating habits improved most in households with weekly per-person income within $100 to $500, and with Caucasian females living in cities or suburbs. Improvements were also greater with those who took part in the Expanded Food and Nutrition Education Program, where the participants exhibited higher baseline frequency of planning meals before grocery shopping, comparing prices, and budgeting enough money for food and food related purchases. Overall, the average change in HEI scores increased by 2.3 points, however, the variability between the participants’ changes was high, suggesting that more targeted program lessons might increase program efficacy, especially for those participants with high baseline HEI scores.
‘“Several demographic and socioeconomic factors are associated with, and even affect, healthy dietary intake.”’
The exploding costs of health care have renewed interest in understanding the effectiveness of programs designed to influence food choice and dietary quality. According to the Henry J. Kaiser Family Foundation, per capita expenditures on health care exceeded $8,400 in 2010 and comprise 17.9% of total 2010 gross domestic product of the United States. 1 In 2019, the aggregate national health expenditures are expected to be $4,482.7 billion, which is about $13,387 per capita and 19.3% of the gross domestic product (GDP). 2 Health care costs are increasingly burdening state and federal budgets, as Medicaid and Medicare expenditures made up 5.5% of GDP in 2010 and are expected to rise to 9% by 2035. 3
A possible redress to this crisis is nutrition education programs aimed at reducing dietary risk factors and promoting healthy consumer choices. Two such programs are the Supplemental Nutrition Assistance Program–Education (SNAP-Ed) and the Expanded Food and Nutrition Education Program (EFNEP), both of which are funded by the US Department of Agriculture (USDA). SNAP-Ed was created to provide nutrition education and encourage healthy lifestyles among recipients and applicants of the largest publically funded nutrition program in the United States. 4 Supplemental Nutrition Assistance Program (SNAP) was previously known as the Food Stamp Program. 5 EFNEP was established in 1969 under the Great Society programs as a resource for improving personal development and dietary outcomes of low income households through education and demonstration of healthy eating choices. 6
Both programs are offered in Michigan, where Michigan State University Extension (MSUE) and the Michigan Nutrition Network (MNN) both deliver SNAP-Ed nutrition and physical activity education to SNAP-eligible households and MSUE delivers EFNEP programming. In the fiscal year 2011, MSUE provided nutrition education to 78,132 SNAP eligible individuals using either a series of lessons or one-time presentations and to 5,060 individuals through EFNEP series. The latter is slightly above the national state average. 7
Despite the long-term trajectory of increasing taxpayers’ burden in health care costs for treating diet-related ailments, educational programs like EFNEP and SNAP-Ed are under intense Congressional scrutiny. 4 While the number of people receiving SNAP benefits has been steadily increasing over the past 5 years for the United States, Michigan has seen a decline in participation since 2011, as illustrated in Figure 1. While several factors may contribute to Michigan’s relative decline, changes in state program policies have decreased eligibility, including recent legislation making college students ineligible to receive benefits. 8
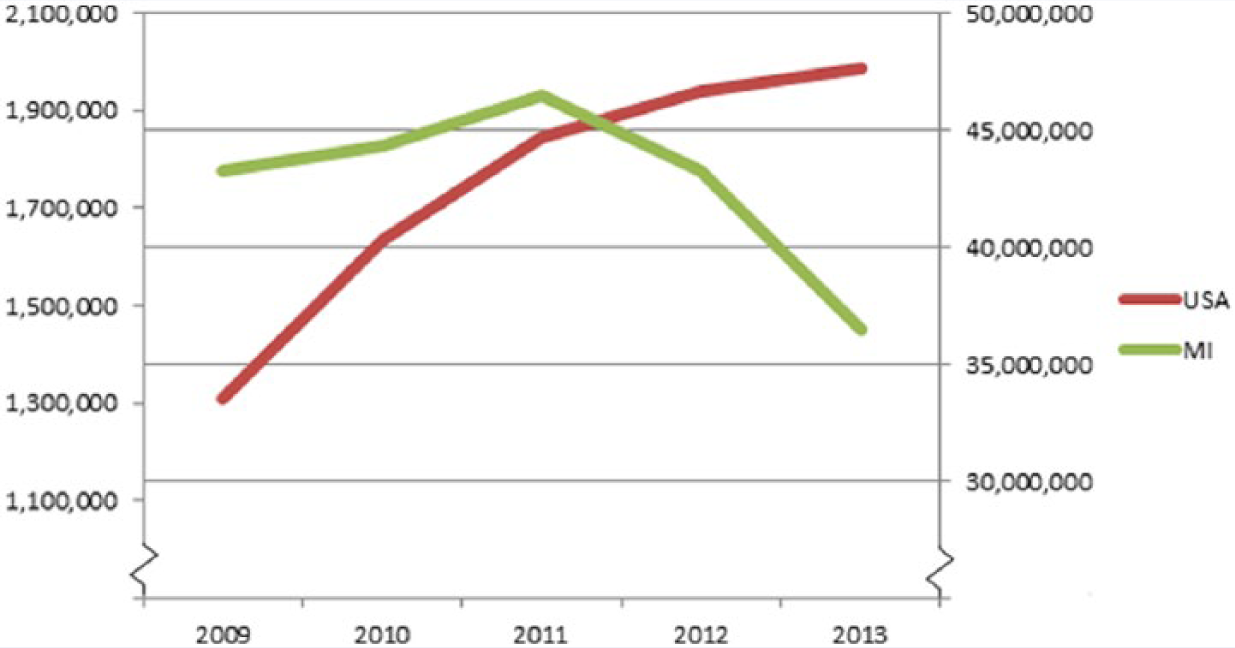
Number of people receiving Supplemental Nutrition Assistance Program (SNAP) benefits.
The main objectives of this article were to determine the demographic and socioeconomic factors, the program-related factors, and the behavioral factors that influence EFNEP and SNAP-Ed outcomes. Secondarily, we sought to understand the trends and changes in Healthy Eating Index (HEI) scores across the groups with differing baseline HEI scores.
Previous Research
Several demographic and socioeconomic factors are associated with, and even affect, healthy dietary intake. Many studies find income, education, and race to be related to the differences in dietary intakes that lead to the health disparities among the US population. The highest income and education groups along with the Caucasian race group are usually associated with greatest adherence to food recommendations.9 -11 International studies find similar results. An Australian study found that dietary knowledge was positively correlated with education and incomes, 12 while a study in Finland found that sex, age, educational attainment, and income were associated with healthy food habits. 13 Turrell et al, 14 exploring environmental factors, found that after controlling for individual factors, residents in disadvantaged areas had poorer diets than those in more advantaged areas. 14 Turrell and Kavanagh 15 also showed that differences in socioeconomic statuses (SES) were related to differences in dietary knowledge. Researchers have consistently cited the relatively high cost of healthy diets as a factor affecting the dietary intake of low-income households,16 -18 to the extent that the higher costs and accessibility to a nutritious diet might contribute to the socioeconomic disparities in health. 19
Health education evaluation studies, such as the one conducted in Nebraska on EFNEP and SNAP-Ed participants found that such programs engendered changes in participant dietary behaviors. 20 The Dollahite study examined the impact of EFNEP on participants’ food security status from 1999 to 2001 in New York State. 21 They found that the Caucasian and Hispanic participants had significantly greater reductions in their food insecurity than the other participants, after completing the program. They also found that small-town residents and younger participants improved more from the EFNEP program than did city residents and older participants, and that their food insecurity scores decreased with the number of lessons completed. Other studies, designed to evaluate diet quality impacts of interventions based on the format of lesson delivery, divided participants into 3 groups—face-to-face group meetings, interactive website, and a book through the mail—found that in-person group meetings were most effective. 22,26 Finally, a weight-intervention study of low-income mothers found educational attainment to be positively associated with nutrition knowledge scores, and that weight interventions were more successful at generating weight loss in mothers with higher initial nutritional knowledge. 23
This study sets out to expand on the current literature on dietary intervention programs by evaluating behavioral changes in Michigan’s low-income participants in the EFNEP and SNAP-Ed programs administered by MSUE. This study posits a first look at the effectiveness of these programs in the state and relates socioeconomic factors to program outcomes. For Michigan, the population of low-income groups has risen considerably over the past decade (Michigan families below the poverty level increased from 7.4% in 2000 to 12.1% in 2010, according to the US Census) intensifying the need to understand the effectiveness of interventions targeted at this growing population. Though limited to Michigan, understanding the effectiveness of these common USDA-funded programs is vital to managing and evolving these programs in the presence of shrinking federal and state budgets.
Methods
Data
This is a secondary analysis of MSUE nutrition education programs. EFNEP and SNAP-Ed nutrition instructors and paraprofessionals collected the data. (Nutrition instructors were trained in the process of eliciting 24-hour dietary recalls from participants by a registered dietitian who was also an Extension educator responsible for supervision of nutrition instructors. Some instructors were trained face-to-face and some received the training online, under the guidance of their own supervisors.) Participants completed a set of questionnaires—an enrollment form, a 24-hour dietary recall, and the Modified Behavioral Checklist, before entry into the programs and a replicate set of forms at completion. The enrollment form consisted of demographic information such as age, ethnicity, place of residence, and income level. The 24-hour dietary recall collects food consumption and quantity data over the past 24 hours in order to quantify nutritional assessment into a HEI score. For this recall, the participants reported all the food and drinks they consumed during the previous day. Instructors collected dietary recalls before program entry and at program completion for all EFNEP participants. The script that the paraprofessionals and educators stated to the participants as they filled out their recall forms was based on the second edition of the USDA’s tool “The 24-Hour Food Recall: An Essential Tool in Nutrition Education.”24,25
Although, entry and exit recalls were requested of all SNAP-Ed participants, many Michigan counties did not record exit recalls. The Modified Behavior Checklist is a 21-item pretest/posttest (10 national Behavioral Checklist questions and 11 additional questions were selected by Michigan program administrators 26 ) that contains statements that measure participants’ involvement in various nutrition, food security, food resource management, and food safety–related behaviors.
In 2011, MSUE used the County Reporting System 5 (CRS5) data system to collect data on both EFNEP and SNAP-Ed participants. USDA developed the CRS5 and it was used nationally by EFNEP programs for tracking and evaluation of state-administered programs. (USDA implemented a new tracking system—Nutrition Education Evaluation and Reporting System version 5 [NEERS5].) A trained data entry specialist in county Extension offices entered all collected data into the CRS5 database. This information was incorporated into a statewide database (SRS5–State Reporting System) where reports were then generated.
The data were collected from October 2011 to September 2012. For analyses purposes we included only those participants who were 18 years or older, provided a positive household income less than $2401 a month, had a household size of 10 or fewer people, and had completed between 1 to 10 lessons. Only those cases with no missing information for any of the variables were included in the regressions. Those who dropped out before completing the program were dropped from regression analyses. Selected sociodemographic and behavior characteristics at baseline are shown in Table 1.
Baseline Statistics for Diet Quality Scores (HEI), Demographic and Program Variables, and Behavioral Items. a
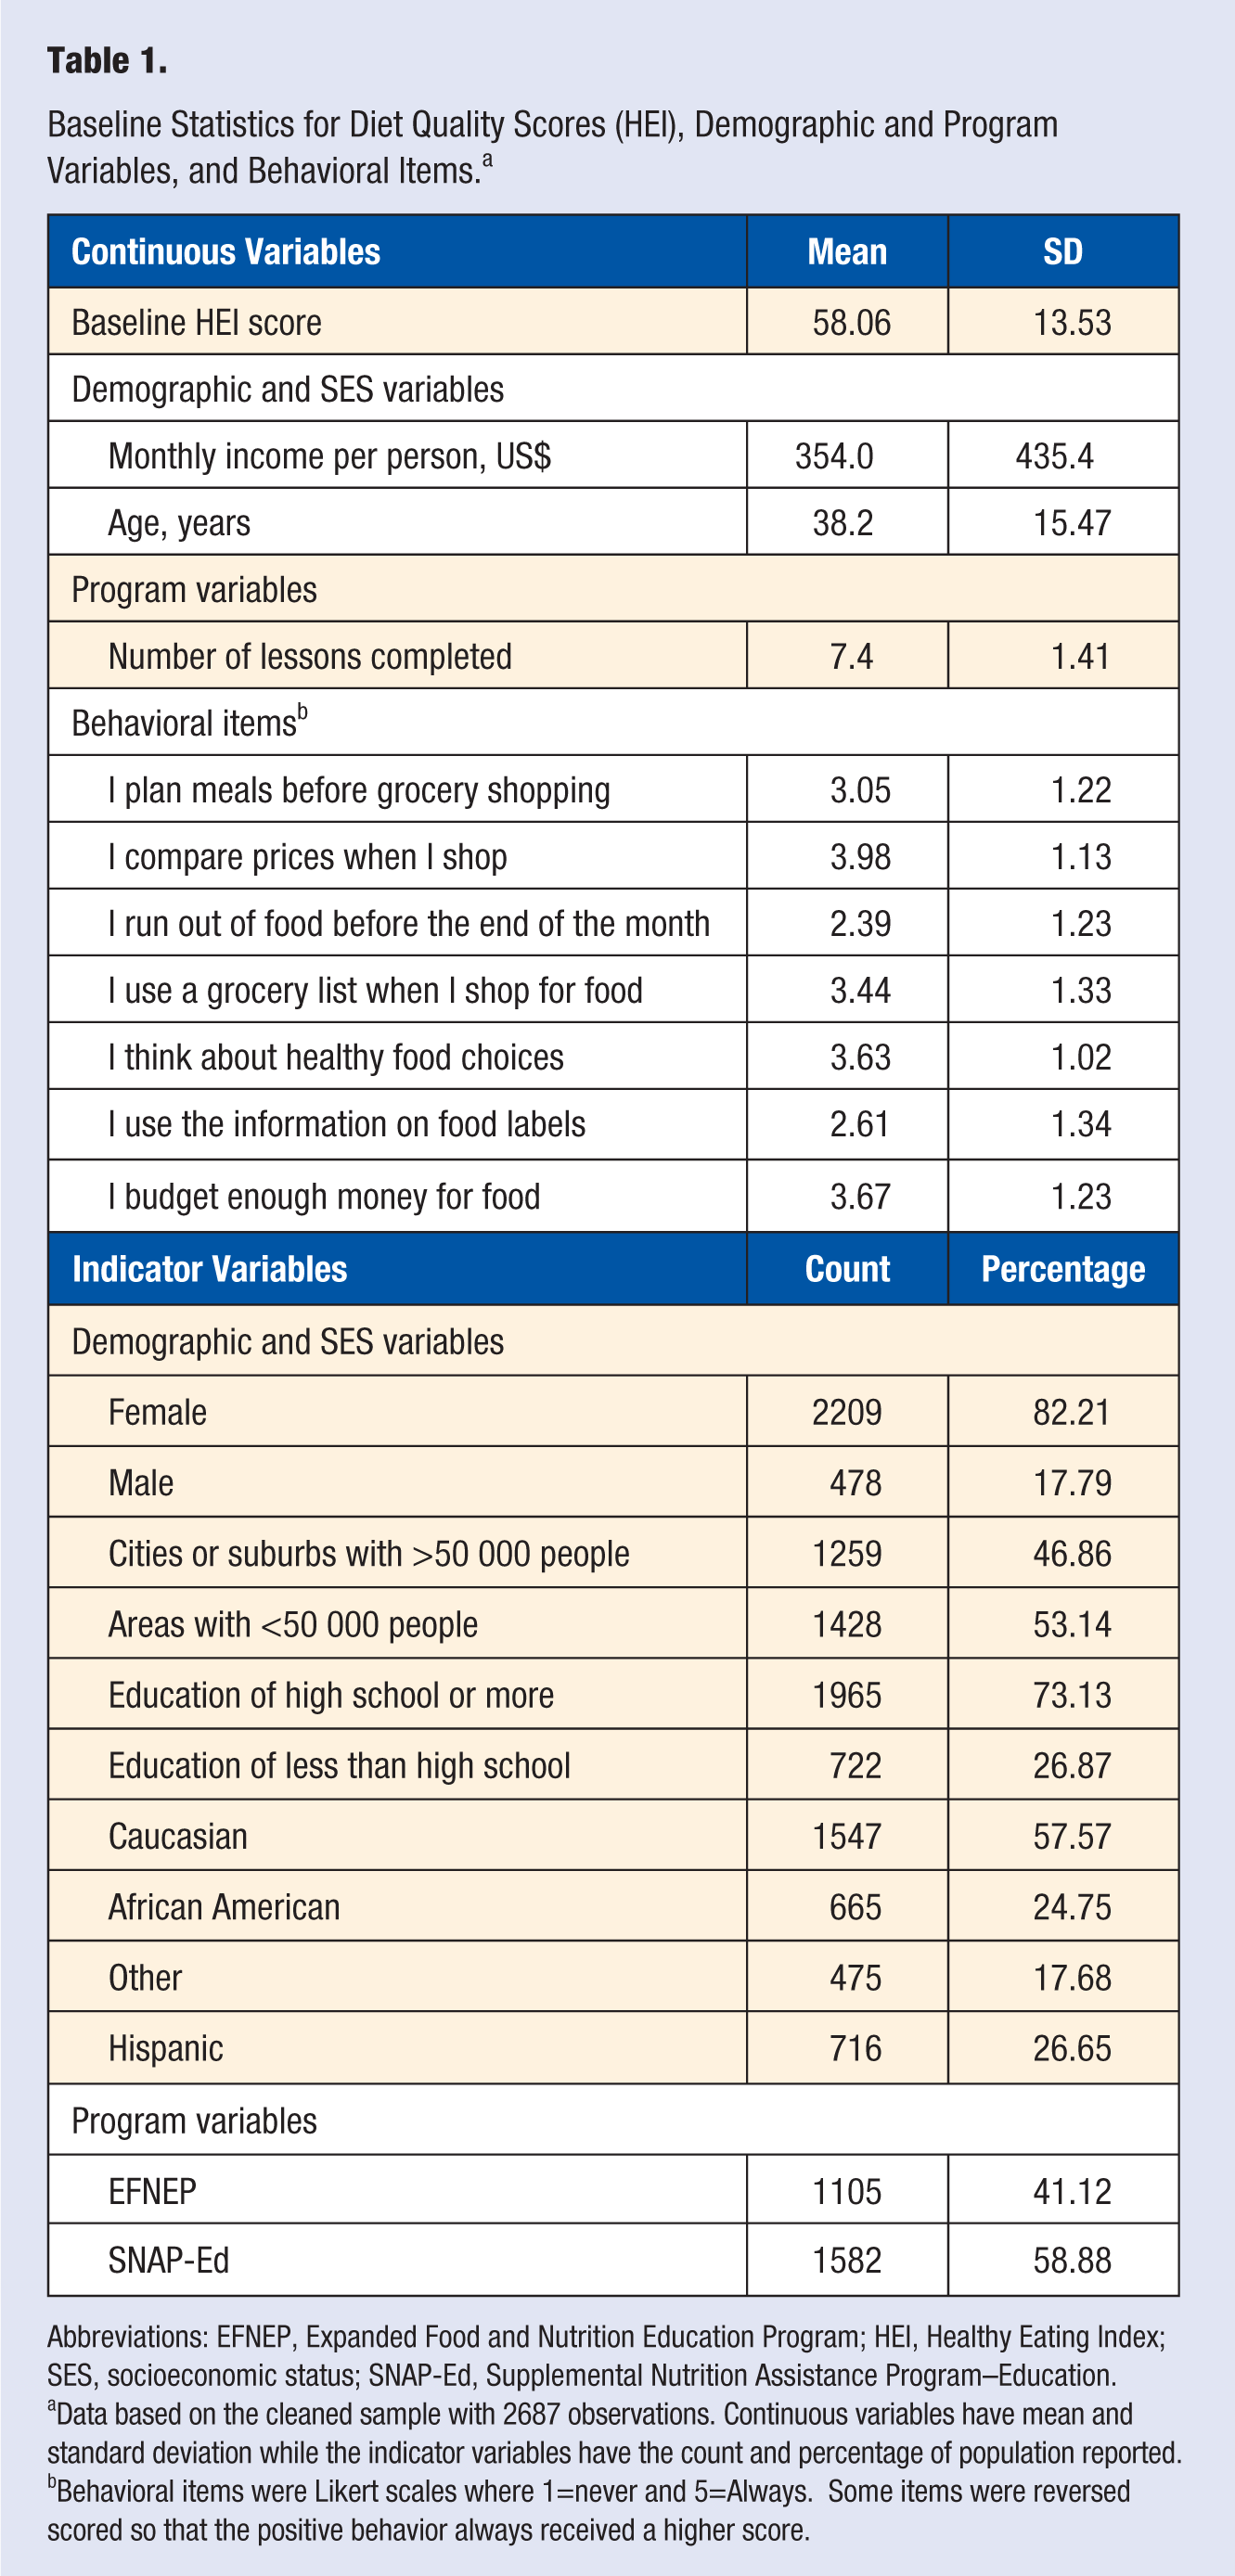
Abbreviations: EFNEP, Expanded Food and Nutrition Education Program; HEI, Healthy Eating Index; SES, socioeconomic status; SNAP-Ed, Supplemental Nutrition Assistance Program–Education.
Data based on the cleaned sample with 2687 observations. Continuous variables have mean and standard deviation while the indicator variables have the count and percentage of population reported.
Behavioral items were Likert scales where 1=never and 5=Always. Some items were reversed scored so that the positive behavior always received a higher score.
The Kolmogorov-Smirnov test was applied to test whether cleaning the data induced sampling bias in the HEI scores. For this test, the null hypothesis was that the samples were drawn from the same distribution. The baseline HEI scores’ P value from the test was .898, indicating that dropped variables did not induce sample bias. The Exit HEI Score and Change in HEI Score variables were also tested and had P values of .307 and .149, respectively, suggesting that data cleaning did not introduce bias into the sample. Hence we had a representative sample after removing all the observations outside our stated bounds.
The Kolmogorov-Smirnov test was also run to verify that there was no sample bias within EFNEP samples and within SNAP-Ed samples. Accordingly, we found no evidence that data cleaning introduced sampling bias in EFNEP HEI scores (entry, exit, or change). However, SNAP-Ed entries exhibited slightly lower average change in HEI scores after cleaning. As shown in Figure 2, the distribution of change in HEI scores of the cleaned SNAP-Ed data shifted left of the full distribution, but maintained a similar shape. This implied that the cleaned data set exhibited more conservative estimates of change in HEI scores, than before the cleaning.
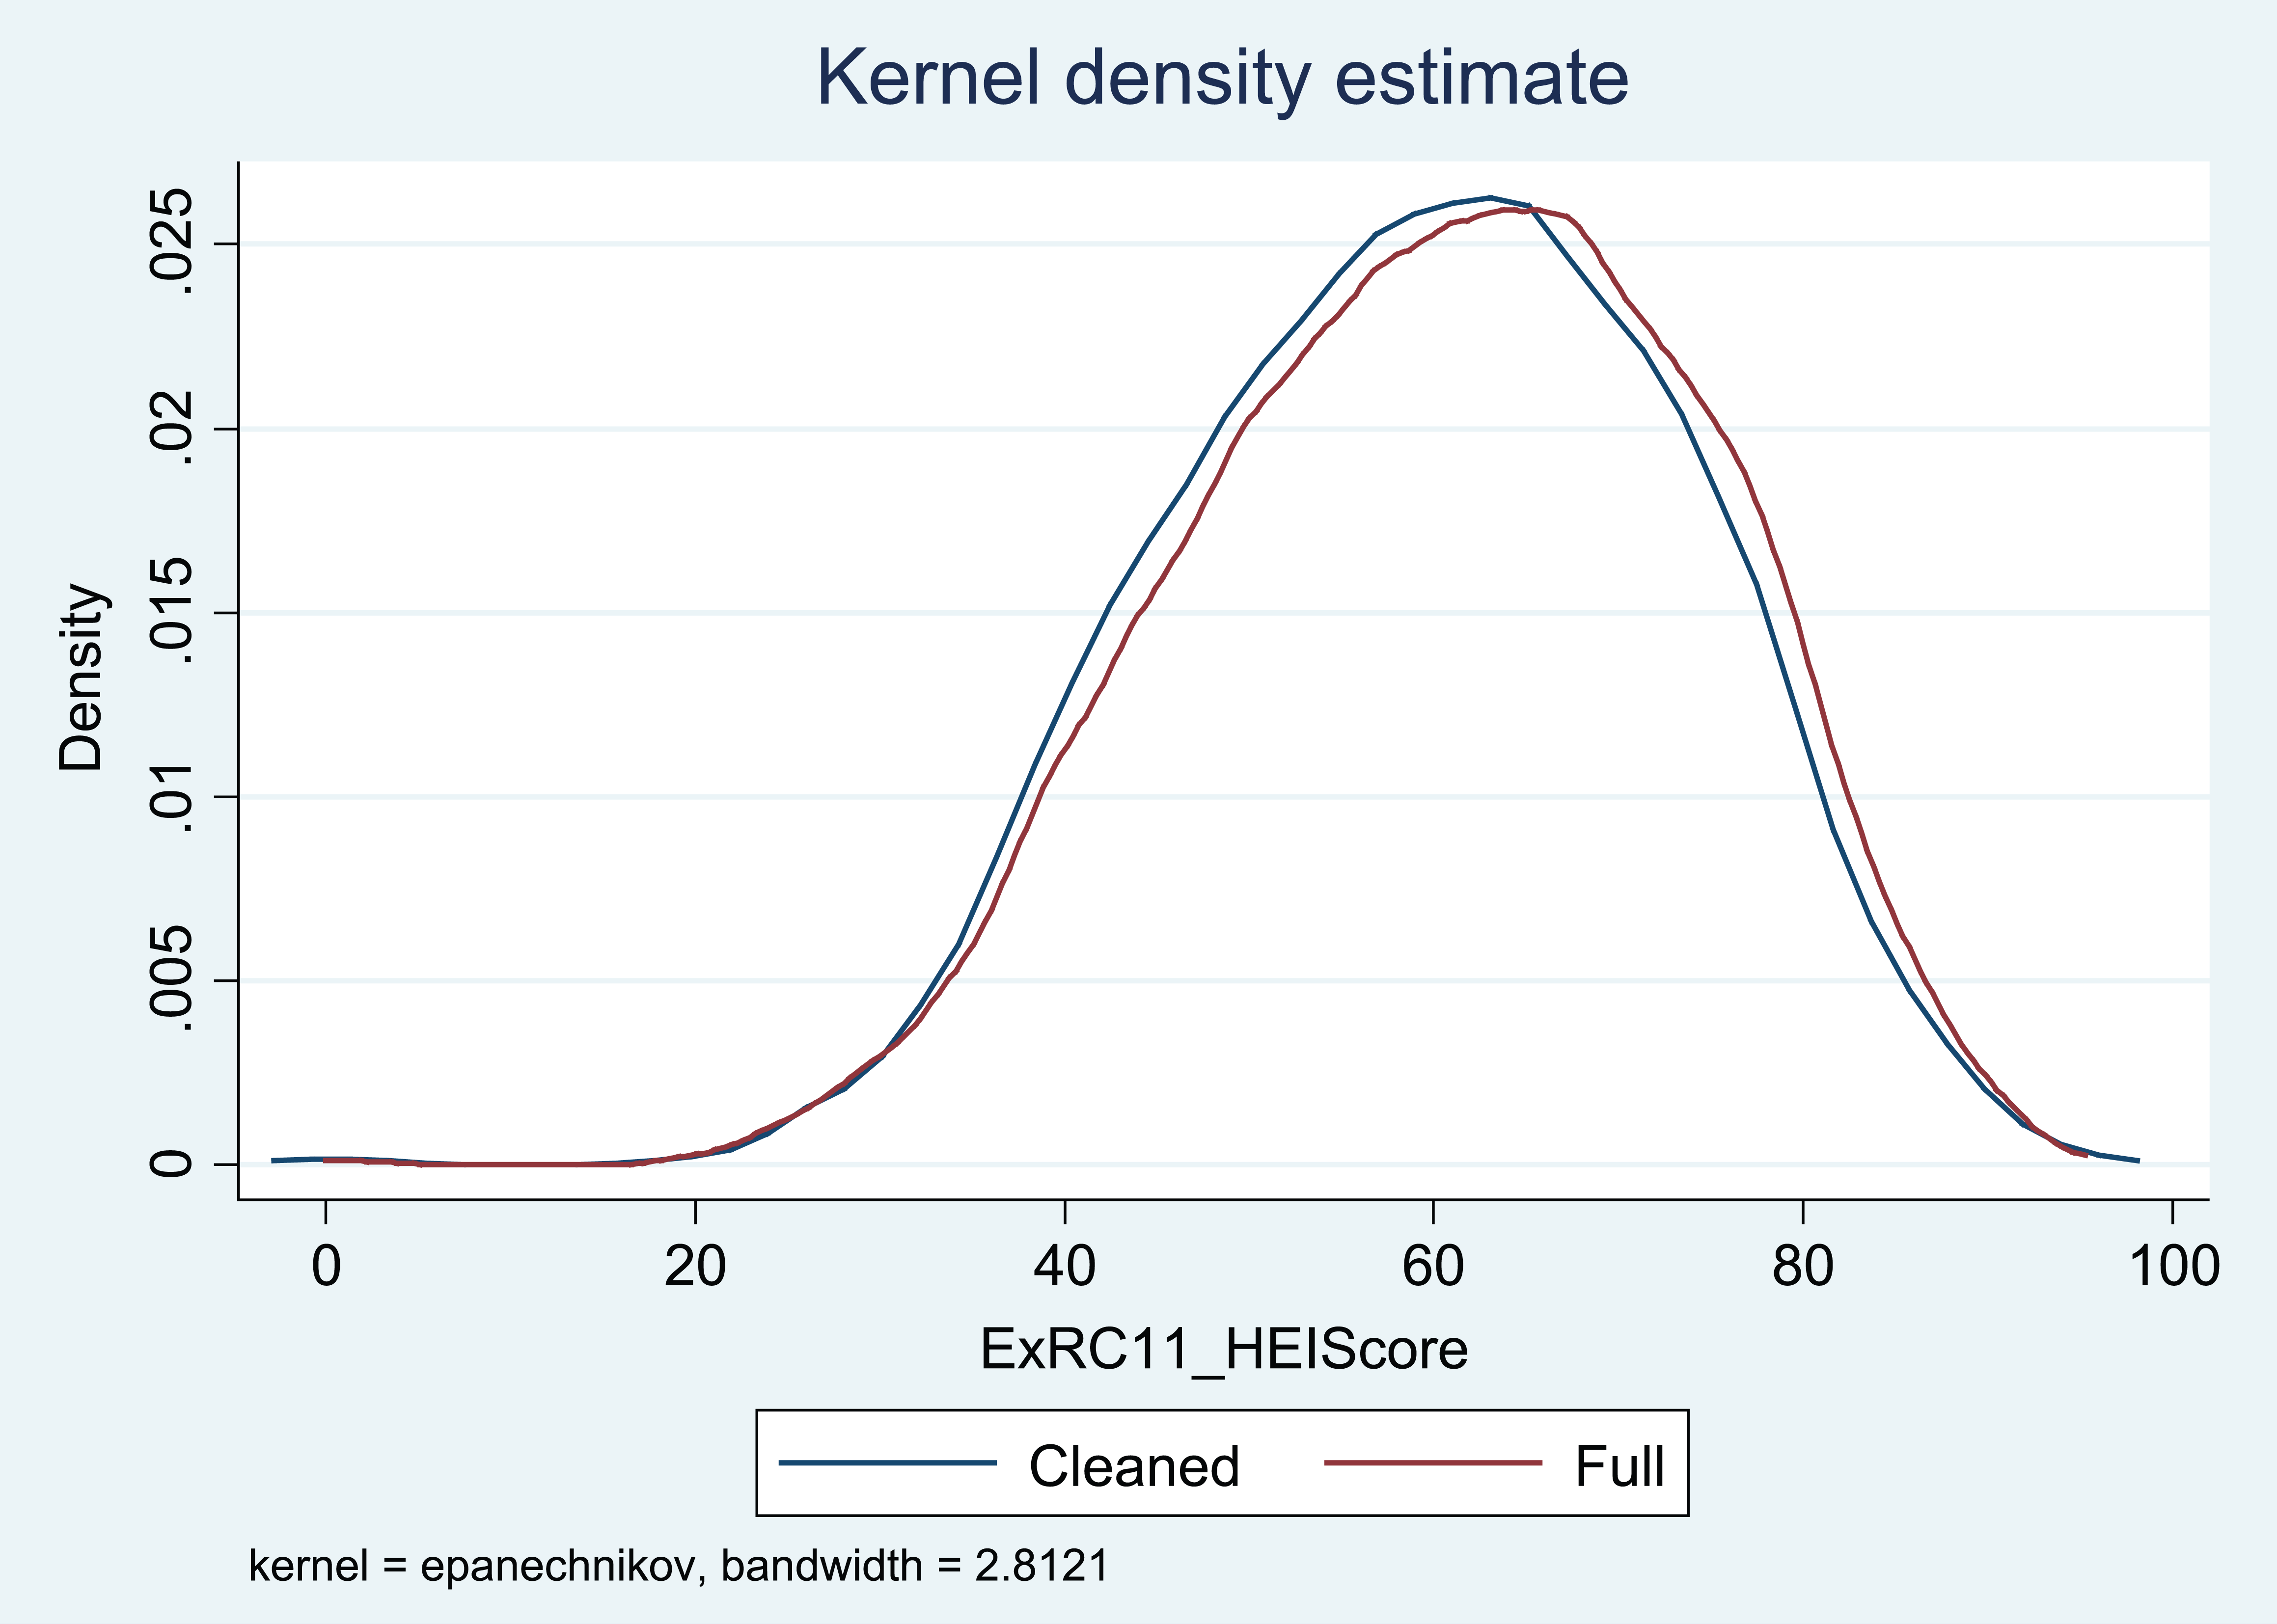
The Kolmogorov-Smirnov test comparison of the cleaned and full data distributions for the SNAP-Ed only exit HEI scores. HEI, Healthy Eating Index; SNAP-Ed, Supplemental Nutrition Assistance Program–Education.
Dependent Variable
The 2005 HEI scores were used to estimate outcomes. The USDA’s Center for Nutrition Policy and Promotion developed the HEI in 1995 as a tool to help assess and monitor Americans’ diets. 27 The HEI score is composed of 10 components representative of 3 key aspects of diet. The first 5 components focused on nutrient adequacy and included the 5 food pyramid categories: fruit, vegetables, grains, milk, and meat. Consumption of fat, saturated fat, cholesterol, and sodium were included as aspects of a diet that should be limited and were reverse scored. The final component was a measure of an individual’s variety in food choices. 28 Each of the above components was scored on a scale of 0 to 10, with 10 being preferred. The scores of each of the 10 components were then summed to create a composite score along a scale of 0 to 100. Scores greater than or equal to 80 suggested a good diet, scores greater than 51 but less than 80, a diet that needs improvement, and scores less than 51, a poor diet. 27 The dependent variable for this model was the change in HEI score, as postmeasure minus baseline, where positive values suggest movement toward a preferred dietary intake.
Regression analysis was most appropriate to analyze change in HEI scores despite the HEI scores having lower and upper bounds. The change in HEI scores (exit score − baseline score) is a continuous set with technical bounds of −100 to 100. However, the changes in HEI scores were approximately normally distributed with mean 2.3. Hence, the model could be estimated with least squares specification with change in HEI score as the dependent variable. We relied on asymptotics for such analysis, because the sample was sufficiently large and empirically normally distributed, where the error term was approximately normally distributed.
Independent Variables
To capture the demographic and SES effects, income, residence, educational attainment, age, race and ethnicity variables were included as independent variables. Household income was captured as a monthly, per-person income variable (monthly household income divided by the number of people living in the household). These per-person income values were then divided into 5 income groups delineated around natural groupings with approximately equal counts. An indicator variable for whether the participant lived in a city or suburb of at least 50,000 people was used to capture type of residency. Educational attainment was represented by a single indicator variable taking the value of 1 if the participant had attained the high school diploma level or higher. Age was measured as a continuous variable. Race was divided into 3 groups—Caucasian, African American, and Other (American Indian or Alaskan Native, Asian, and Native Hawaiian or Other Pacific Islander). Ethnicity was captured using an indicator variable with a value of 1 if the participant selected Hispanic heritage. For the regressions, Caucasian and non-Hispanic were used as the regression referent group.
For program characteristics, the number of lessons and a squared number of lessons were included. Number of lessons was expected to increase the change in HEI scores, but at a decreasing rate. Whether the participant completed EFNEP or SNAP-Ed was also included in the full regression and then the data were split between the 2 groups and analyzed individually. The original data set was composed of 26% EFNEP and 74% SNAP-Ed participants, but the final study sample had 41% and 59% participants from these programs, respectively, due to the different program policies at that time.
Pre- and postbehavioral items had Likert-type scale responses of 1 = never, 2 = seldom, 3 = sometimes, 4 = most times, 5 = always, and 0 = decline comment. A change in response indicator variable was created for each item that took the value of 1 if there was an improvement in the behavior at the end of the program or if the participant started and ended at the highest ranking response. For example, for the item, “I think about healthy food choices” this would be would be a 1 if the score increased after participating in the program or started and ended at 5, and 0 otherwise. The responses for 1 item were reversed to reflect that “never” was preferred choice response.
The following 7 indicator variables for behavioral change items have economic importance and were also included in the regressions.
I compare prices when I shop to find the best buy.
I run out of food before the end of the month. (Scale reversed)
I budget enough money for food and other food-related purchases.
I use a grocery list when I shop for food.
I use the information on food labels to compare the fat or other nutrients.
I plan meals for a few days ahead of time before going grocery shopping.
I think about healthy food choices.
Findings
Full Sample Regression
Entry HEI scores were the baseline HEI values and compared to exit HEI scores on completing the EFNEP/SNAP-Ed program. The mean baseline HEI score in our sample was 58.1 (SD 13.5), while the mean exit score increased to 60.4 (SD 13.9). On average, participants had a higher HEI after completing the program than entering the program. As both entry and exit scores were derived from 1-day dietary recalls, the change in HEI varied between a decline of 75.1 and increase by 63.6. Although a dietary intake from only 1 day cannot reflect an individuals’ usual intake due to day-to-day variation, it can be an unbiased estimate of a group’s usual mean intake. 29 Because the SNAP-Ed and EFNEP instructors work Monday to Friday, it is only these days that are represented by the HEI scores. This is a benefit to this study, because dietary intakes vary the most on the weekends. 29
Table 2 shows the regression results where variance/covariance robust estimators were employed throughout the estimations (using STATA 12, White’s heteroscedastic-consistent standard errors). Ten variables were found to significantly relate to the change in HEI (with significance level in parentheses): baseline HEI (1%), monthly income per person being within $100 and $500 (5%), being female (1%), living in a city or a suburb (5%), being African American (1%) or a race other than African American or Caucasian (1%), participating in EFNEP training (1%), and improvement in 3 food resource management practices—planning meals before grocery shopping (10%), comparing prices (10%), and budgeting enough money for food and food-related purchases (1%).
Regression Results for the Full Analysis and the Individual Program Analysis (Base Group: Caucasian Within the Income per Person Group of at Less Than $100/Month) a .
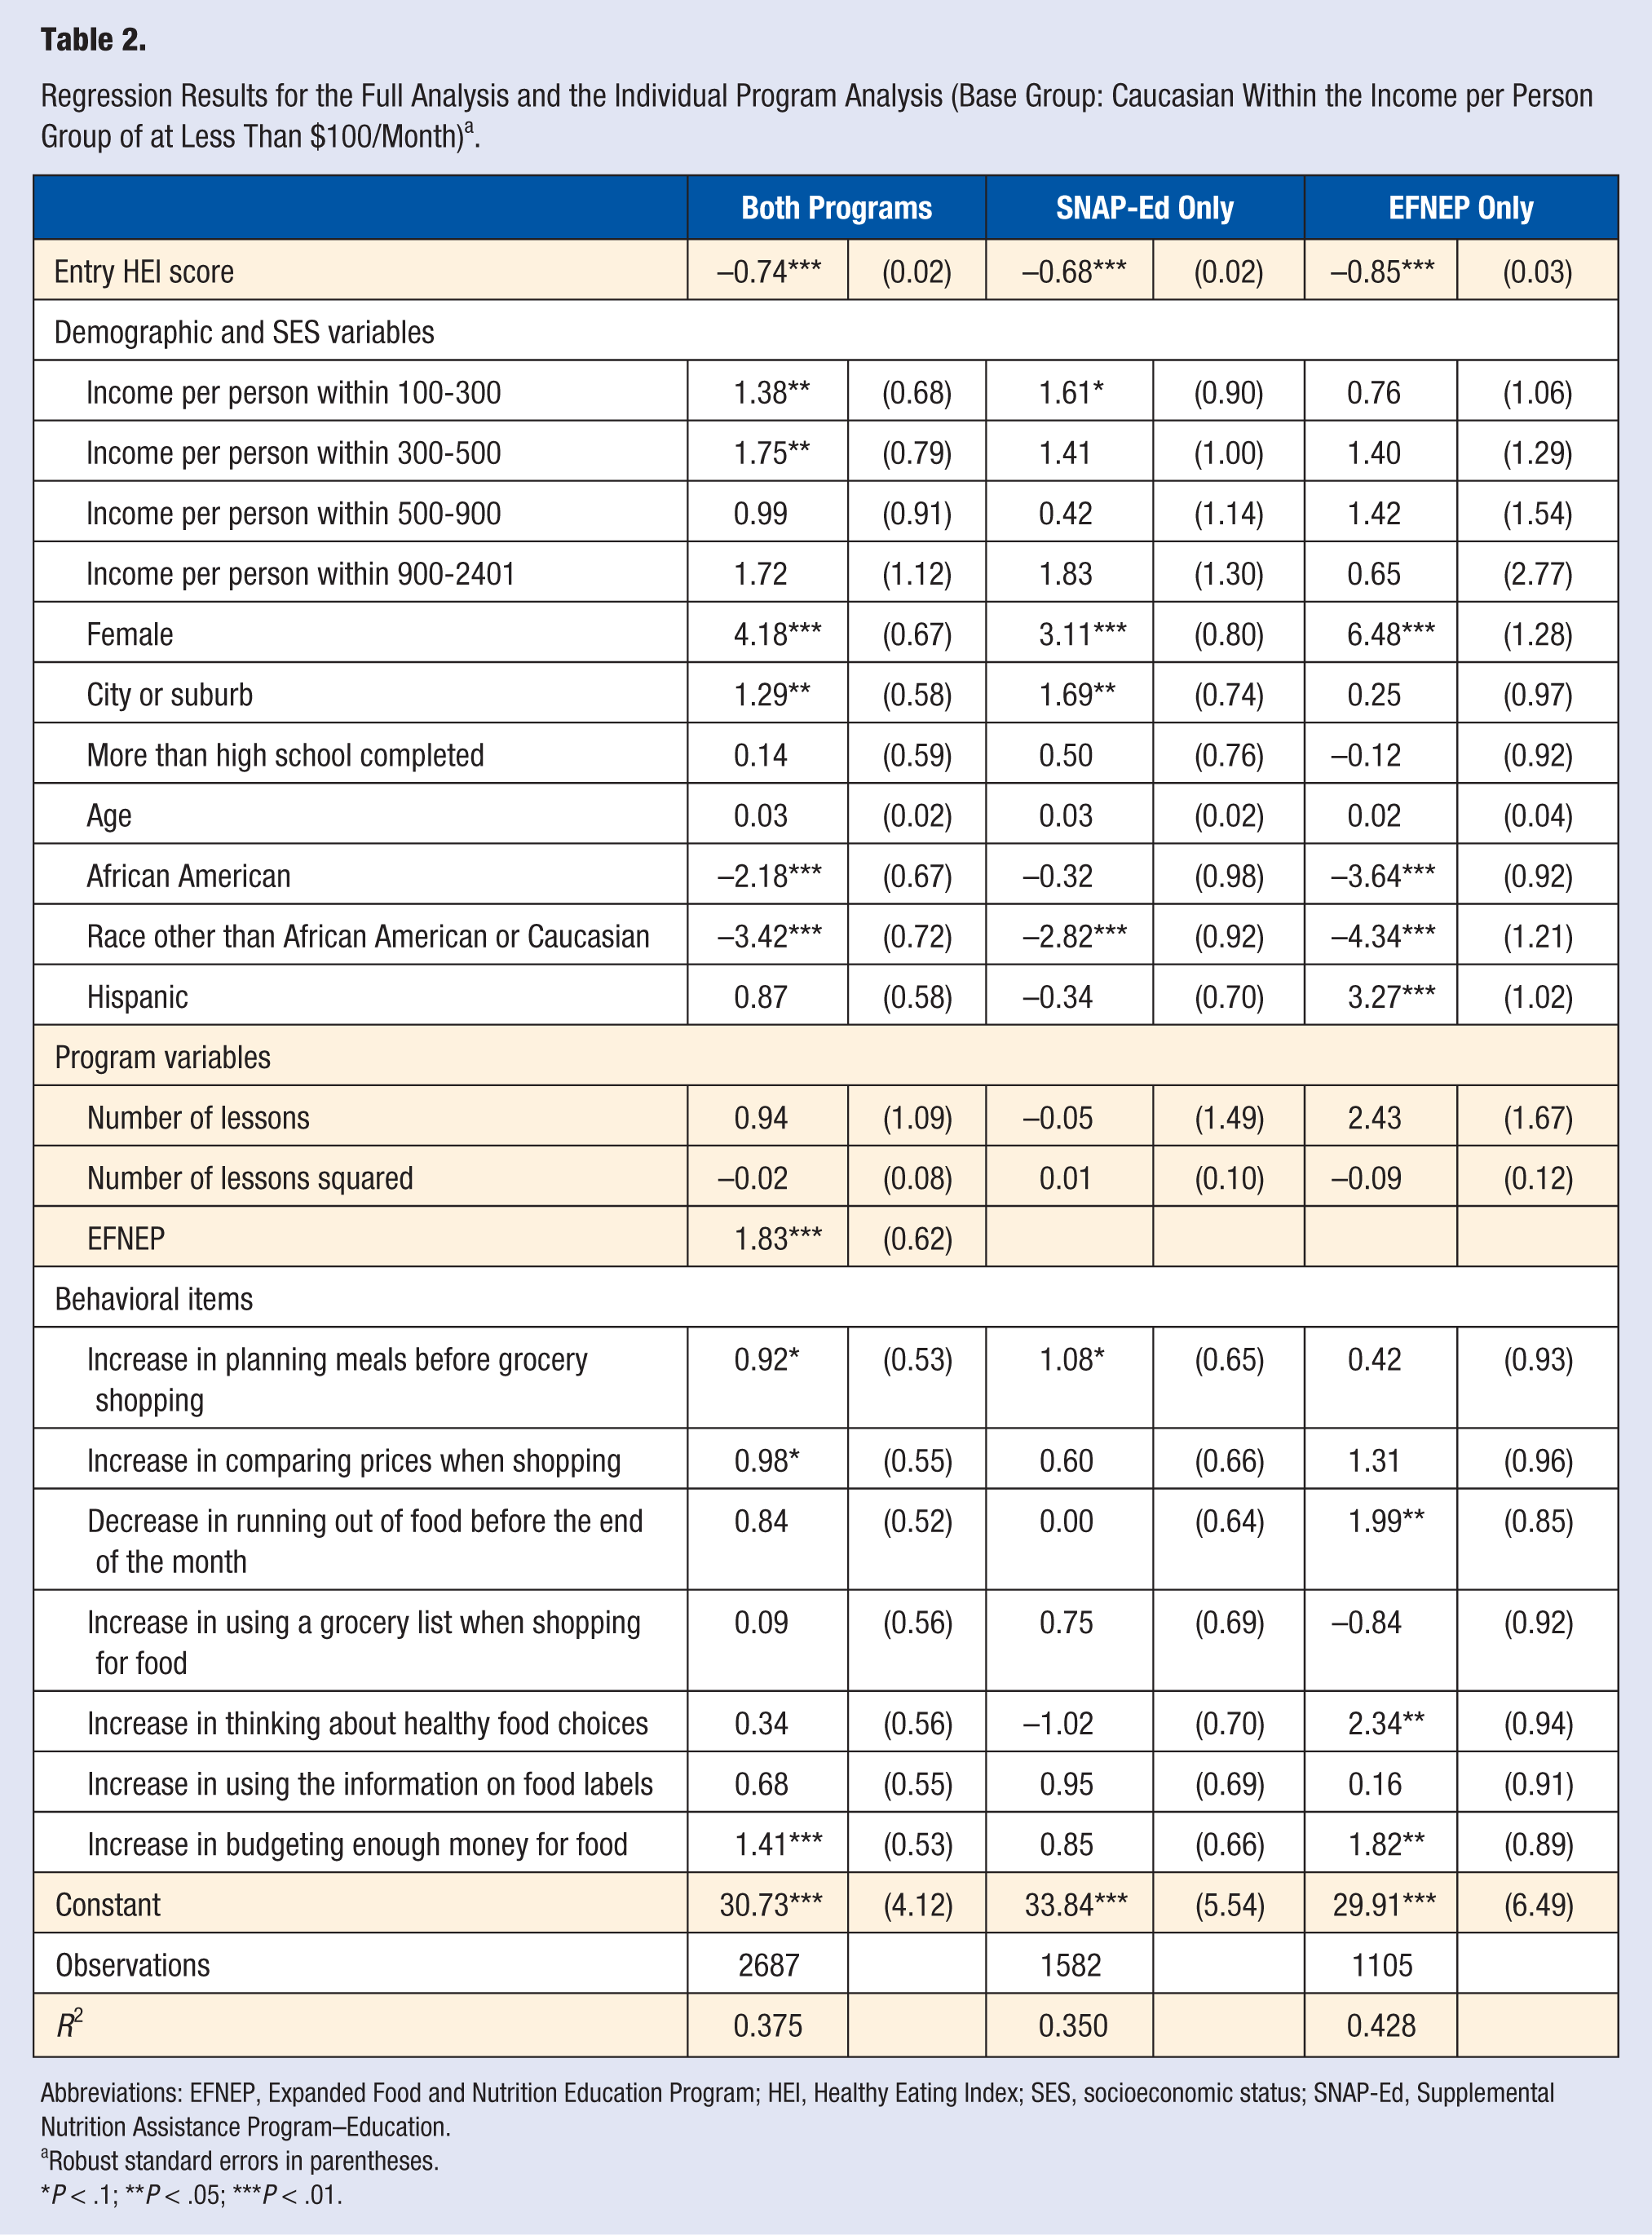
Abbreviations: EFNEP, Expanded Food and Nutrition Education Program; HEI, Healthy Eating Index; SES, socioeconomic status; SNAP-Ed, Supplemental Nutrition Assistance Program–Education.
Robust standard errors in parentheses.
P < .1; **P < .05; ***P < .01.
The baseline HEI score was significant and negative implying that those entering the educational program with high HEI scores were less likely to experience increased HEI scores on program completion compared with those entering with lower HEI scores. It also suggests that those with the lowest HEI scores at the beginning of the program experienced the largest gains in terms of improved HEI scores. This variable is the single largest predictor of the change in HEI scores, explaining approximately 34% of total variation in the model (calculated by the R2 of regressing the change in HEI scores against the baseline score only [not shown]).
In order to explore the changes in HEI scores across the differing baseline HEI score groups, a series of steps were completed. First, the baseline HEI scores were divided into 4 groups: 0-40, 40-60, 60-80, and 80-100. Second, the average baseline HEI scores were calculated for each group. Then the average changes in HEI scores were calculated by group. Last, those average changes were added to the average baseline scores to yield the average exit score for that group of observations. Figure 3 shows the movement of different baseline HEI score groups. The 2 lowest baseline HEI score groups benefited the most from the programs, with almost 20- and 8-point average increases, while the participants who started with relatively high scores had less increase or even a decline in HEI scores, after completing the program. All 4 group changes were significantly different from zero (t tests were run for each and all yielded P values of 0.000). Both the results from the regression and change in HEI scores groupings suggested that those who had initial HEI scores less than 60 benefited the most from food and nutrition education.
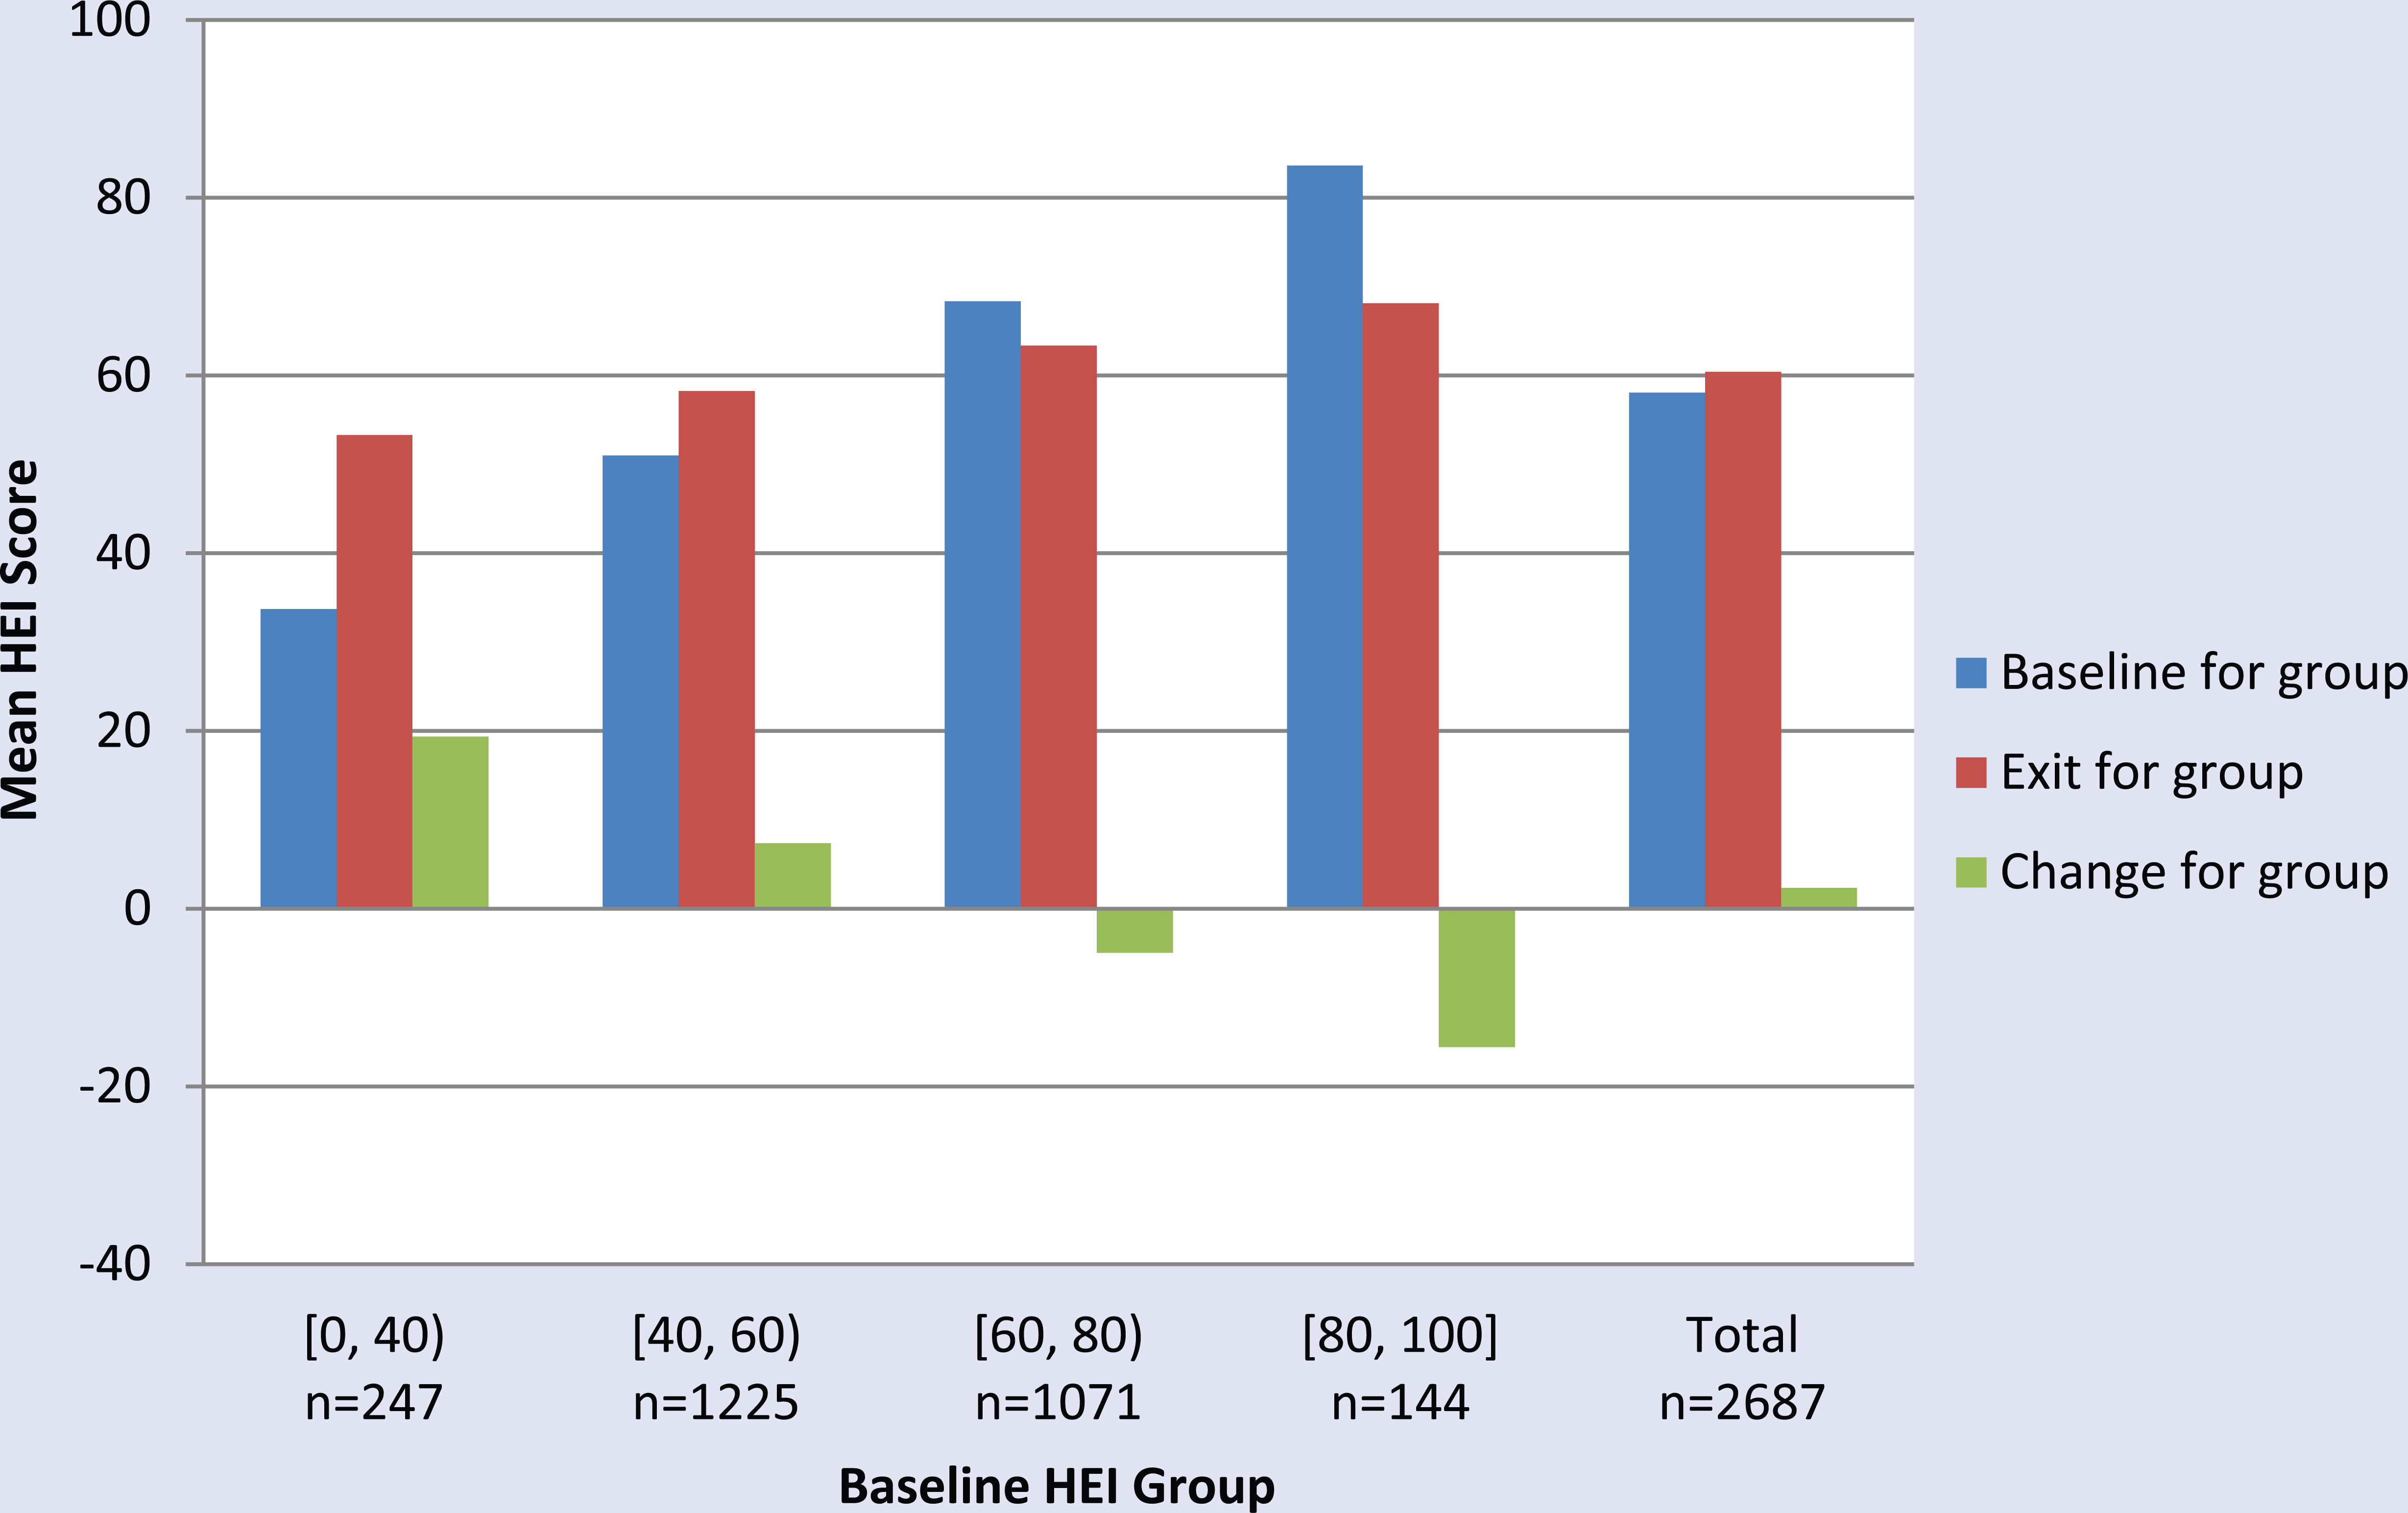
Healthy Eating Index (HEI) growth diagram with the participants grouped by baseline HEI. The mean HEI score at baseline and exit along with the change are shown for each group and the total. Data are for both programs.
The 4 demographic and SES variables that significantly related to the change in HEI were income, gender, residence, and race. The base income group was those households with less than $100 in monthly per-person income. Those households with monthly per-person incomes between $100 and $500 had a statistically significant increase in change in HEI scores relative to those with less than $100 per person (at the 5% significance level). The lack of significance for the 2 highest income groups ($500 or more per person) in both programs and in each program individually demonstrated that these programs did not help the highest income participants any differently than they did the lowest income participants. Based on the literature, we expected those with the highest income to be able to make more improvements in eating habits than those with lower incomes, but our findings showed that the middle income groups increased their HEI the most. This finding could be due to the fact that within the 2 highest income groups are households with a substantially lower proportion of children and thus these households might have less motivation for improvement (the proportion of households with income per person greater than $500 that have children present was 0.29 while this proportion was 0.75 for households with between $100 and $500 per person). In addition, the sample included in this study is truncated to households with less than $2,401 in monthly household income, thereby reducing the influence of higher income categories.
Of further practical significance, female participants appeared to reap greater benefits from program participation than did their male counterparts, based on change in HEI scores. Specifically, females exhibited an average increase of 4 points over male participants in HEI score changes. In an attempt to gain a better understanding of this finding, females and males were compared across many different demographic responses. The two noteworthy differences between the female and male participants was that female participants tended to have higher incomes (almost $90 more a month) on average and the female group was more likely to have children present (almost 20% higher). Note that findings are based on the gender of participant, rather than the makeup of the household.
Living in a city or suburb had a positive association with an increase in HEI score postprogram. This might be due in part, to relatively greater accessibility to a variety of food sources. Furthermore, non-Caucasian households tended to exhibit lower HEI score changes than Caucasian households. This finding was consistent with most previous research. 21 However, contrary to most of the previous research,9 -12 we did not find education to be a significant factor in outcomes. This deviation may be explained by the generally low level of educational attainment in the sample, where the low proportion of participants who completed a bachelor’s degree (1.2%) limited the role of education in the analysis.
Participation in the EFNEP program yielded a higher increase in HEI scores at completion than SNAP-Ed. This finding deserved further scrutiny. On average EFNEP participants tended to be younger, have lower incomes, and remain in the program slightly longer than did SNAP-Ed participants. The program differences might also reflect differences in program targets and mandates at that time. At baseline, or entry, HEI scores were virtually identical between the 2 groups. This finding might reflect differences in program delivery and focus.
Behavioral change is a key factor concerning the effectiveness of this type of programming for Michigan’s low income residents, though only three of the seven behavioral metrics appeared to be significantly associated with the change in HEI scores—planning meals before shopping, comparing prices, and budgeting enough money for food. All 3 were positive and statistically significant meaning that participants who improved these behaviors or practiced these behaviors extensively tended to exhibit greater HEI score increases. Planning and budgeting both occur outside the store, but have implications for purchasing choices and potential substitution for impulse purchases.
Individual Program Analysis
The individual programs were analyzed separately and the results are also shown in Table 2. There were 3 (5) variables that were significant for the SNAP-Ed (EFNEP) program that were not significant for the EFNEP (SNAP-Ed) program. Only one income category exhibited significance for the individual program regression—that of households with per-person incomes between $100 and $300 with an increase of HEI score of 1.61 over those with per-person incomes less than $100. On average, SNAP-Ed participants living in cities and suburbs had a 1.69 point higher increase in their HEI score than those who did not. This difference was not present for the EFNEP participants. This finding was most likely due to the differences in counties that these programs target. The proportion of EFNEP participants living in a city or suburb was much higher than for the SNAP-Ed population (almost 3 times as high). The SNAP-Ed program helped the Hispanic participants on average the same as the non-Hispanic participants, while the Hispanic EFNEP participants increased their HEI scores by an average 3.3 points higher than non-Hispanic participants. African American participants’ HEI scores improved significantly less than the Caucasians after completing the EFNEP program, but the difference in scores were essentially the same among them in the SNAP-Ed program. For the SNAP-Ed participants, as they increased the frequency of planning meals before shopping, their HEI scores increased by a point on average while for the EFNEP participants HEI scores did not increase. When SNAP-Ed participants increased the frequency of thinking about healthy foods, their HEI scores remained statistically the same. By comparison this behavior was associated with an average 2.3 point increase in HEI scores for EFNEP participants.
Discussion and Conclusion
This study suggests that lower income, Caucasian, female, and city and suburban residents in Michigan who completed EFNEP lessons benefited the most from nutrition education. The most important factor that related to HEI scores was the participants’ baseline HEI score. The higher the initial score, the lower the HEI score increase. EFNEP participants had greater positive changes in their HEI scores than SNAP-Ed participants even though they had similar baseline HEI scores. Nutrition and health education appeared to improve HEI overall. However, when the participants were broken into groups based on their initial HEI scores, this is no longer true for the participants with baseline HEI scores greater than 60. This finding supports the need for new methods of improving dietary behaviors of those with relatively high initial HEI scores. The findings suggest targeting program delivery based on participants’ entry HEI scores. Alternatively, the findings might suggest perverse participant incentives in completing the program, where realigning participants’ interest in the educational material might improve outcomes across all participants. For example, mandating participation for SNAP participation might place participant program incentives away from improving dietary outcomes toward meeting program requirements. Policy makers have additional policy options around participants in SNAP programs. Policy could be more restrictive with the allowable purchase options with electronic benefit transfer (EBT), for instance, have maximum limits on of allowable unhealthy foods bought (eg, energy-dense foods) or have minimum requirements of healthy foods bought (eg, fruits and vegetables).
Other policy-related outcomes were found. Rural areas exhibited smaller improvements in HEI scores. With common curricula between the 2 groups, it is likely that environmental factors contributed to such findings. The lifestyle of a city/suburban resident may vary significantly from small-town residents, as well as their access to healthy (and unhealthy) foods. Such heterogeneity should be considered, as outcomes reflect differences in program participants. Based on the results of this study, Michigan SNAP-Ed seems to generate better outcomes for city and suburban residents relative to small town participants. However, this could be due to the greater average distance to healthy food locations that they have compared to city residents. 30 But policies can help close this divide. For example, increasing EBT participation in rural farmers markets is one way policy can increase rural community access to those dietary behaviors advocated in SNAP-Ed and EFNEP programming. Many states have adopted such policies. Other possible policy changes include the use of food hubs and online ordering with EBT benefits to bring healthy foods directly to the rural low-income neighborhoods. 4
With the growing costs of health care and the fact that a third of Americans are obese, it is critical to determine the most effective ways to change behavior. This study suggests that comparing prices, planning before shopping and budgeting food money behavioral improvements are the most effective toward improving dietary intake. Hence, University Extension Services and nongovernmental organizations that work with similar participants should focus on teaching participants how to do so. Because these behavioral changes are all related to the supermarket, more interventions could occur at supermarkets to help enforce these behavioral changes. Along these same lines, programs need to address and emphasize the common misconception 15 that healthier foods are more expensive than unhealthy foods. Finally, single dietary recalls may be insufficient in gauging the actual outcomes of such nutrition education programs. Ideally, program administrators and instructors should follow up with the participants two or three years after program completion to measure the long-term effects. Sustainability of the eating behaviors taught in these lessons is essential to maintaining a healthy life.
Limitations
This study was a quasi-experiment hence no control group was used to distinguish if the effects observed were solely due to the program involvement or due to an outside source that affected everyone in and out of the programs. Another limitation to this study was the potential of some selection bias because the participants chose whether to participate and to complete the programs. The program attrition rate was about 66% (calculated by dividing the number of participants with both baseline and exit HEI scores recorded by the number of participants with a baseline HEI score recorded). The distributions for the baseline HEI scores, education and income for the participants who completed the programs versus the participants who started but dropped out were compared again using the Kolmogorov-Smirnov test. The test results for all 3 show that the program completers and dropouts were statistically similar, suggesting a low chance of selection bias. Finally, using HEI scores is a good mechanism for measuring program performance. Where complete program HEI scores are collected, reliance on single-day scores blunt the potential effectiveness at evaluating program outcomes at the individual level. Aside from taking invasive biometrics, multiple and consecutive scores would increase the evaluative capacity of such programs.
Footnotes
Acknowledgements
The authors acknowledge funding from the Michigan State University AgBioResearch and the Michigan Stand the Michigan State University Extension. The content is solely the responsibility of the authors and does not necessarily represent the official views of the funding agencies.
Declaration of Conflicting Interests
The author(s) declared no potential conflicts of interest with respect to the research, authorship, and/or publication of this article.