
Abstract
This study compared nutrient intake and body weight measures in children 4 to 8 (n = 1480) and 9 to 13 (n = 1790), and adolescents 14 to 18 years of age (n = 1826) participating in 1999-2002 NHANES and consuming a presweetened ready-to-eat cereal (PSRTEC), a non-PSRTEC (NPSRTEC), or other breakfast (OB). Sample weights were applied, and logistic regression identified differences among breakfast consumption groups controlling for appropriate covariates. Breakfast type varied by the above-mentioned age groups: 34% (n = 507), 33% (n = 593), and 23% (n = 416) consumed PSRTEC, respectively; 12% (n = 178), 9% (n = 165), and 8% (n = 144), respectively, consumed NPSRTEC; and 54% (n = 795), 58% (n = 1032), and 69% (n = 1266), respectively, consumed OBs. RTEC consumers had significantly higher intakes of thiamin, riboflavin, niacin, vitamin B6 and B12, folate, calcium, magnesium, iron, and zinc than OB consumers. In children 4 to 8 years old and 9 to 13 years old, added sugars (103.3 ± 2.6 and 111.3 ± 3.0 g) were highest in PSRTEC consumers. Fiber intake was highest in NPSRTEC (4-8 and 9-13 years of age) consumers (14.3 ± 0.4 and 14.7 ± 0.7 g) and lowest in 14- to 18-year-old OB consumers (11.9 ± 0.3 g). Weight measures were not higher in either group of RTEC consumers compared with OB consumers. Data suggest that RTEC contribute a high level of nutrients to the diet, and PSRTEC is not associated with higher body weight in children.
One concern is that many cereals consumed by children are presweetened, and there is concern that intake of added sugars may dilute the micronutrient density of the diet or increase weight.
Introduction
Ready-to-eat cereals (RTECs) are those cereals that can be consumed without further preparation, so they are convenient; in addition, most are low in fat and cholesterol, and more than 90% of RTECs are fortified with essential micronutrients. 1 RTECs may be an appropriate food choice to help children meet nutrient recommendations. 2 The majority of RTECs are consumed at breakfast and provide a significant source of nutrients in the diets of American children. 3 Consumption of RTECs at breakfast has been associated with higher intakes of fiber, iron, folate and other B vitamins, vitamin C, potassium, and zinc, and with lower intakes of total fat and cholesterol, when compared with other breakfast (OB) types.4-7 Children who ate RTECs for breakfast also had increased intakes of milk and calcium. 3 Children 1 to 12 years of age who consumed RTECs at breakfast had lower body mass indices (BMIs) than children consuming OBs or skipping breakfast7,8; and in a longitudinal study, the frequency of cereal consumption, although not breakfast, was associated with lower BMI z scores in girls 9 to 19 years of age. 8
One concern is that many cereals consumed by children are presweetened, and there is concern that intake of added sugars may dilute the micronutrient density of the diet9-12 or increase weight. A recent study showed that cereals marketed to children, although not specifically identified as presweetened RTECs (PSRTECs), were significantly higher in carbohydrate, sugar, and sodium content (per gram) and significantly lower in protein and fiber content (per gram) than cereals that were not marketed to children. 9
Studies that have looked at the nutrient contribution of food sources in the diet have shown that the added sugars contributed by PSRTECs have been modest. 10 Joyce et al 10 showed that high intake of added sugars, from any source, was associated with lower intake of vitamins B12 and C, magnesium, calcium, and zinc in children 5 to 12 years old. Other studies have not shown this.11,13,14 Data collected from children 6 to 11 years old participating in the Continuing Survey of Food Intake by Individuals 1994-1996 and 1998 showed that higher intakes of PSRTECs was associated with increased intake of calcium, folate, and servings of dairy. 14 Most studies looking at added sugars in the diet of children have concentrated on sweetened beverages12,15,16 and have not looked specifically at RTECs. 14 The energy contribution of PSRTECs and their effect on weight in children is unclear.
A number of studies have looked at the nutrient contribution to the total diet of RTECs at breakfast17-20 and the relationship of breakfast consumption with overweight and obesity. 21 Very few studies have examined the effect of PSRTECs or non-PSRTECs (NPSRTECs) and OBs on nutrient intake and body weight in children and adolescents. The purpose of this study was to determine and compare nutrient intake and body weight measures in children 4 to 8 and 9 to 13 years old and in adolescents 14 to 18 years old consuming a PSRTEC breakfast, a NPSRTEC breakfast, and OBs.
Methods
Study Sample
The NHANES is a cross-sectional continuous program that collects information about the nutrition and health status of the US population using a complex, multistage probability sampling design. This study included data from children 4 to 8 (n = 1480) and 9 to 13 (n = 1790) years old and adolescents 14 to 18 years old (n = 1826) participating in the 1999-2002 NHANES and consuming breakfast. Pregnant and lactating females were excluded from the analyses. Breakfast skippers were also excluded from the analyses because the scope of this study was limited to the type of breakfast consumed. Because of the nature of the data (secondary data analysis) and the lack of personal identifiers in the data set, this study was exempted by the institutional review board of the Louisiana State University AgCenter.
Measures
The types and amounts of foods and beverages consumed were collected by using the multiple-pass, 24-hour diet recall method. 22 For this study, a single 24-hour diet recall was used. Parents or guardians reported the dietary intakes for children younger than 6 years and assisted children between 6 and 11 years old; children/adolescents older than 11 years completed their own recall. The breakfast meal was self-defined. Children/adolescents were categorized into 1 of 3 breakfast consumption groups: PSRTEC breakfast consumers (regardless of what else was consumed at breakfast), NPSRTEC breakfast consumers (regardless of what else was consumed at breakfast), and OB consumers (no RTEC was consumed at breakfast) by self-report or parental report. As the purpose of this article was to compare breakfast types, children and adolescents who were breakfast skippers (n = 1478) who participated in the NHANES 1999-2002 were not included in these analyses. Detailed descriptions of the dietary recall methods are provided in the NHANES Dietary Interviewers Procedure Manual, which includes pictures of the Computer-Assisted Dietary Interview systems screens, measurement guides, and charts used to collect dietary information. 23 For the NHANES 1999-2000 data, the USDA 1994-1998 Survey Nutrient Database was used to code and report intake of energy and nutrients. The USDA Food and Nutrient Database for Dietary Studies (version 1) 24 was used for processing the dietary recall data for 2001-2002. Only dietary recalls deemed “reliable and meeting minimum criteria” by the National Center for Health Statistics staff were used for the analysis.
In the original release of NHANES 1999-2000, data on vitamin A intake were only available in micrograms of retinol equivalents, and vitamin E intake data were only available in milligrams of α-tocopherol (mg AT) equivalents. Currently, dietary reference intakes (DRIs) are expressed for vitamin A as micrograms of retinol activity equivalents (µg RAE) and for vitamin E as mg AT. The special database released by the USDA in 2006 25 was used to determine vitamin A in µg RAE and vitamin E in mg AT.
Presweetened RTEC was defined as cereal eaten during breakfast with at least 6 g of sugar per serving. This cut-off was based on the exclusion criteria for cereals available through the Supplemental Food and Nutrition Education Program for Women, Infants, and Children 26 ; there is no other specific definition. Total added sugars food composition data were obtained from the Pyramid Servings Database for USDA Survey Food Codes version 1.0. 27 Added sugars were defined by the USDA as white sugar, brown sugar, raw sugar, corn syrup, corn syrup solids, high fructose corn syrup, malt syrup, maple syrup, pancake syrup, fructose sweetener, liquid fructose, honey, molasses, anhydrous dextrose, crystal dextrose, and dextrin that are eaten separately or used as an ingredient in processed or prepared foods. Naturally occurring sugars, such as lactose in milk, were not included as added sugars. Total sugar was available in the 2001-2002 data set but not in the 1999-2000 data set. Using the 2001-2002 data set a ratio of total sugar per gram of each individual food was derived allowing total sugar to be calculated for the 1999-2000 data. A factor of 4.196 was used to convert total added sugars in the Pyramid Servings Database from teaspoons to grams.
Anthropometric Measures
Heights and weights were measured in the Mobile Examination Center of NHANES. BMI was calculated as body weight (in kilograms) divided by height (in meters) squared. Weight-for-age z-score and BMI-for-age z-score were calculated using growth chart programs available from the CDC. 28 Waist circumference was also determined by trained individuals. The NHANES Anthropometry Procedures Manual describes the protocol, equipment, and measurement of anthropometric data. 29 The manual also provides information about equipment, calibration, methods, quality control, and survey procedures.
Physical activity was used as a covariate in the statistical analyses. It was calculated using 2 separate questions from the NHANES survey. The first asks if the individual participated in any vigorous activity over the last 30 days, and the second asks how many times per week the individual played or exercised enough to make them breathe hard or sweat. For approximately half of the population, the participant was asked the first question but not the second, and the other half was asked the second question but not the first. If the answer to the first question was yes or the answer to the second question was at least 7, then that participant was categorized as having a high physical activity level.
Statistical Analysis
Sample-weighted data were used in all statistical analyses, and all analyses were performed using SUDAAN Release 9.0.1 (Research Triangle Institute, Research Triangle Park, NC) to adjust the variance for the complex sample design. The sample-weighted percentages in breakfast consumption groups were calculated using PROC DESCRIPT of SUDAAN. Unadjusted means (and the standard error of the means) were also calculated using PROC DESCRIPT of SUDAAN. Least-square means (LSMEANS) and the standard errors of the least-square means (SE) were calculated using PROC REGRESS of SUDAAN.
Sample-weighted LSMEANS and SE were estimated for macronutrients and micronutrients consumed. Covariates included gender, ethnicity, socioeconomic status, and total energy. An additional covariate, physical activity, was included for body weight measures. The adjusted means for the breakfast consumption groups of each age group were compared using the Bonferroni method to adjust the significance level for multiple comparisons. Probability was set at P < .05.
Results
The proportion of children and adolescents in each breakfast consumption group by gender and ethnicity is shown in Table 1. Of the total sample (N = 5096) of children and adolescents who consumed breakfast, 29.7% consumed PSRTECs at breakfast, whereas 9.6% and 60.7% consumed NPSRTECs or OBs, respectively. Breakfast consumption varied by age: for children 4 to 8 years old, 34.3%, 12.0%, and 53.7% consumed PSRTECs, NPSRTECs, and OBs, respectively; for children 9 to 13 years old, 33.1%, 9.2%, and 57.7% consumed PSRTECs, NPSRTECs, and OBs, respectively. Among adolescents, 22.8%, 7.9%, and 69.3% consumed PSRTECs, NPSRTECs, and OBs, respectively. Of the 3 breakfast types considered in this study, NPSRTEC was the least frequently consumed in all age groups, followed by PSRTECs and OBs. In all age groups, a lower percentage of Hispanic children/adolescents consumed PSRTECs than the other ethnic groups (Table 1).
Number and Proportion (%) of Children and Adolescents in Breakfast Consumption Groups by Gender and Ethnicity in Children 4 to 8 and 9 to 13 Years Old and Adolescents 14 to 18 Years Old, NHANES 1999-2002
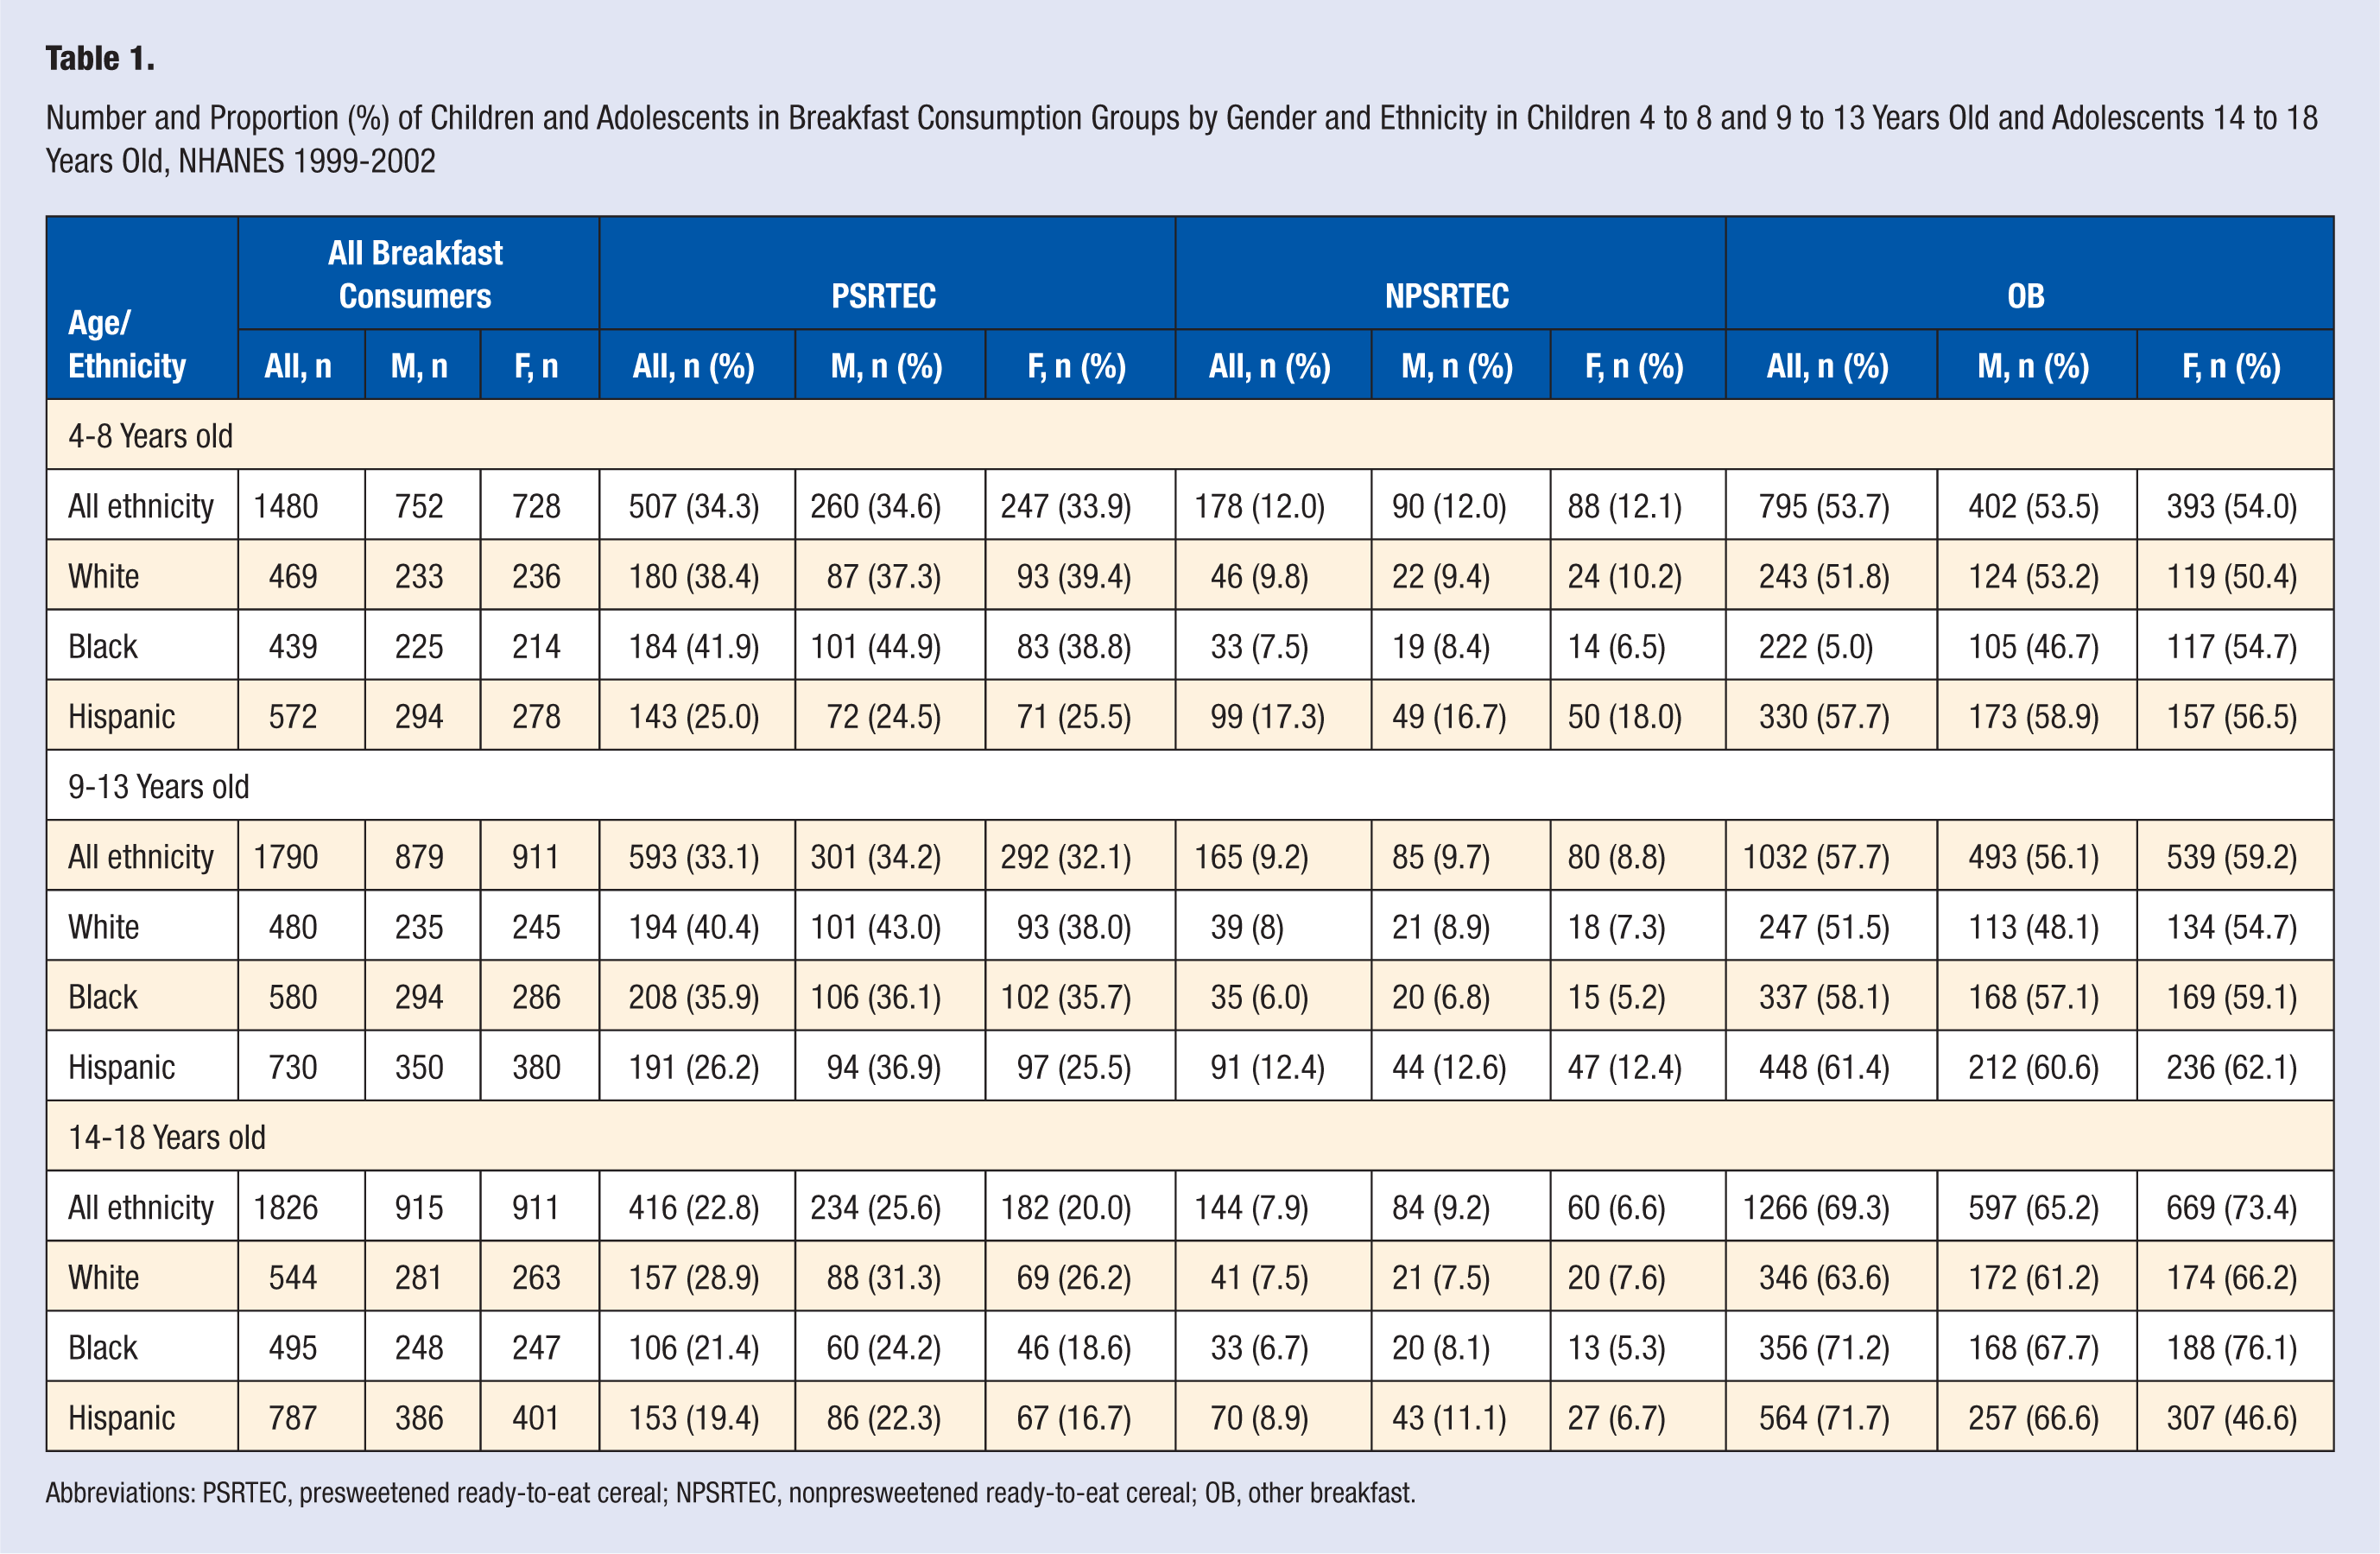
Abbreviations: PSRTEC, presweetened ready-to-eat cereal; NPSRTEC, nonpresweetened ready-to-eat cereal; OB, other breakfast.
Macronutrient Composition by Breakfast Consumption Group
Mean daily intake of energy, macronutrients, and percentage of energy is shown in Table 2. In children 4 to 8 years old, energy intake was highest in the PSRTEC group; in children 9 to 13 years old, NSPRTEC consumers had the lowest energy intake. Total fat intake was higher in OB consumers when compared with both groups of RTEC consumers. PSRTEC consumers (14-18 years old) had the lowest percentage energy consumption of saturated fatty acids (SFAs). Monounsaturated fatty acid (MUFA) intakes and polyunsaturated fatty acid intakes were higher in OB consumers compared with both groups of RTEC consumers. In children 4 to 8 years old, cholesterol intake was lowest in PSRTEC consumers; in older children and adolescents, both RTEC consumption groups had lower intakes of cholesterol than OB consumers.
Mean Daily Intake of Energy and Macronutrients and Percentage of Energy From Macronutrients in Children 4 to 8 and 9 to 13 Years of Age and Adolescents 14 to 18 Years of Age by Breakfast Consumption Group, NHANES 1999-2002 a
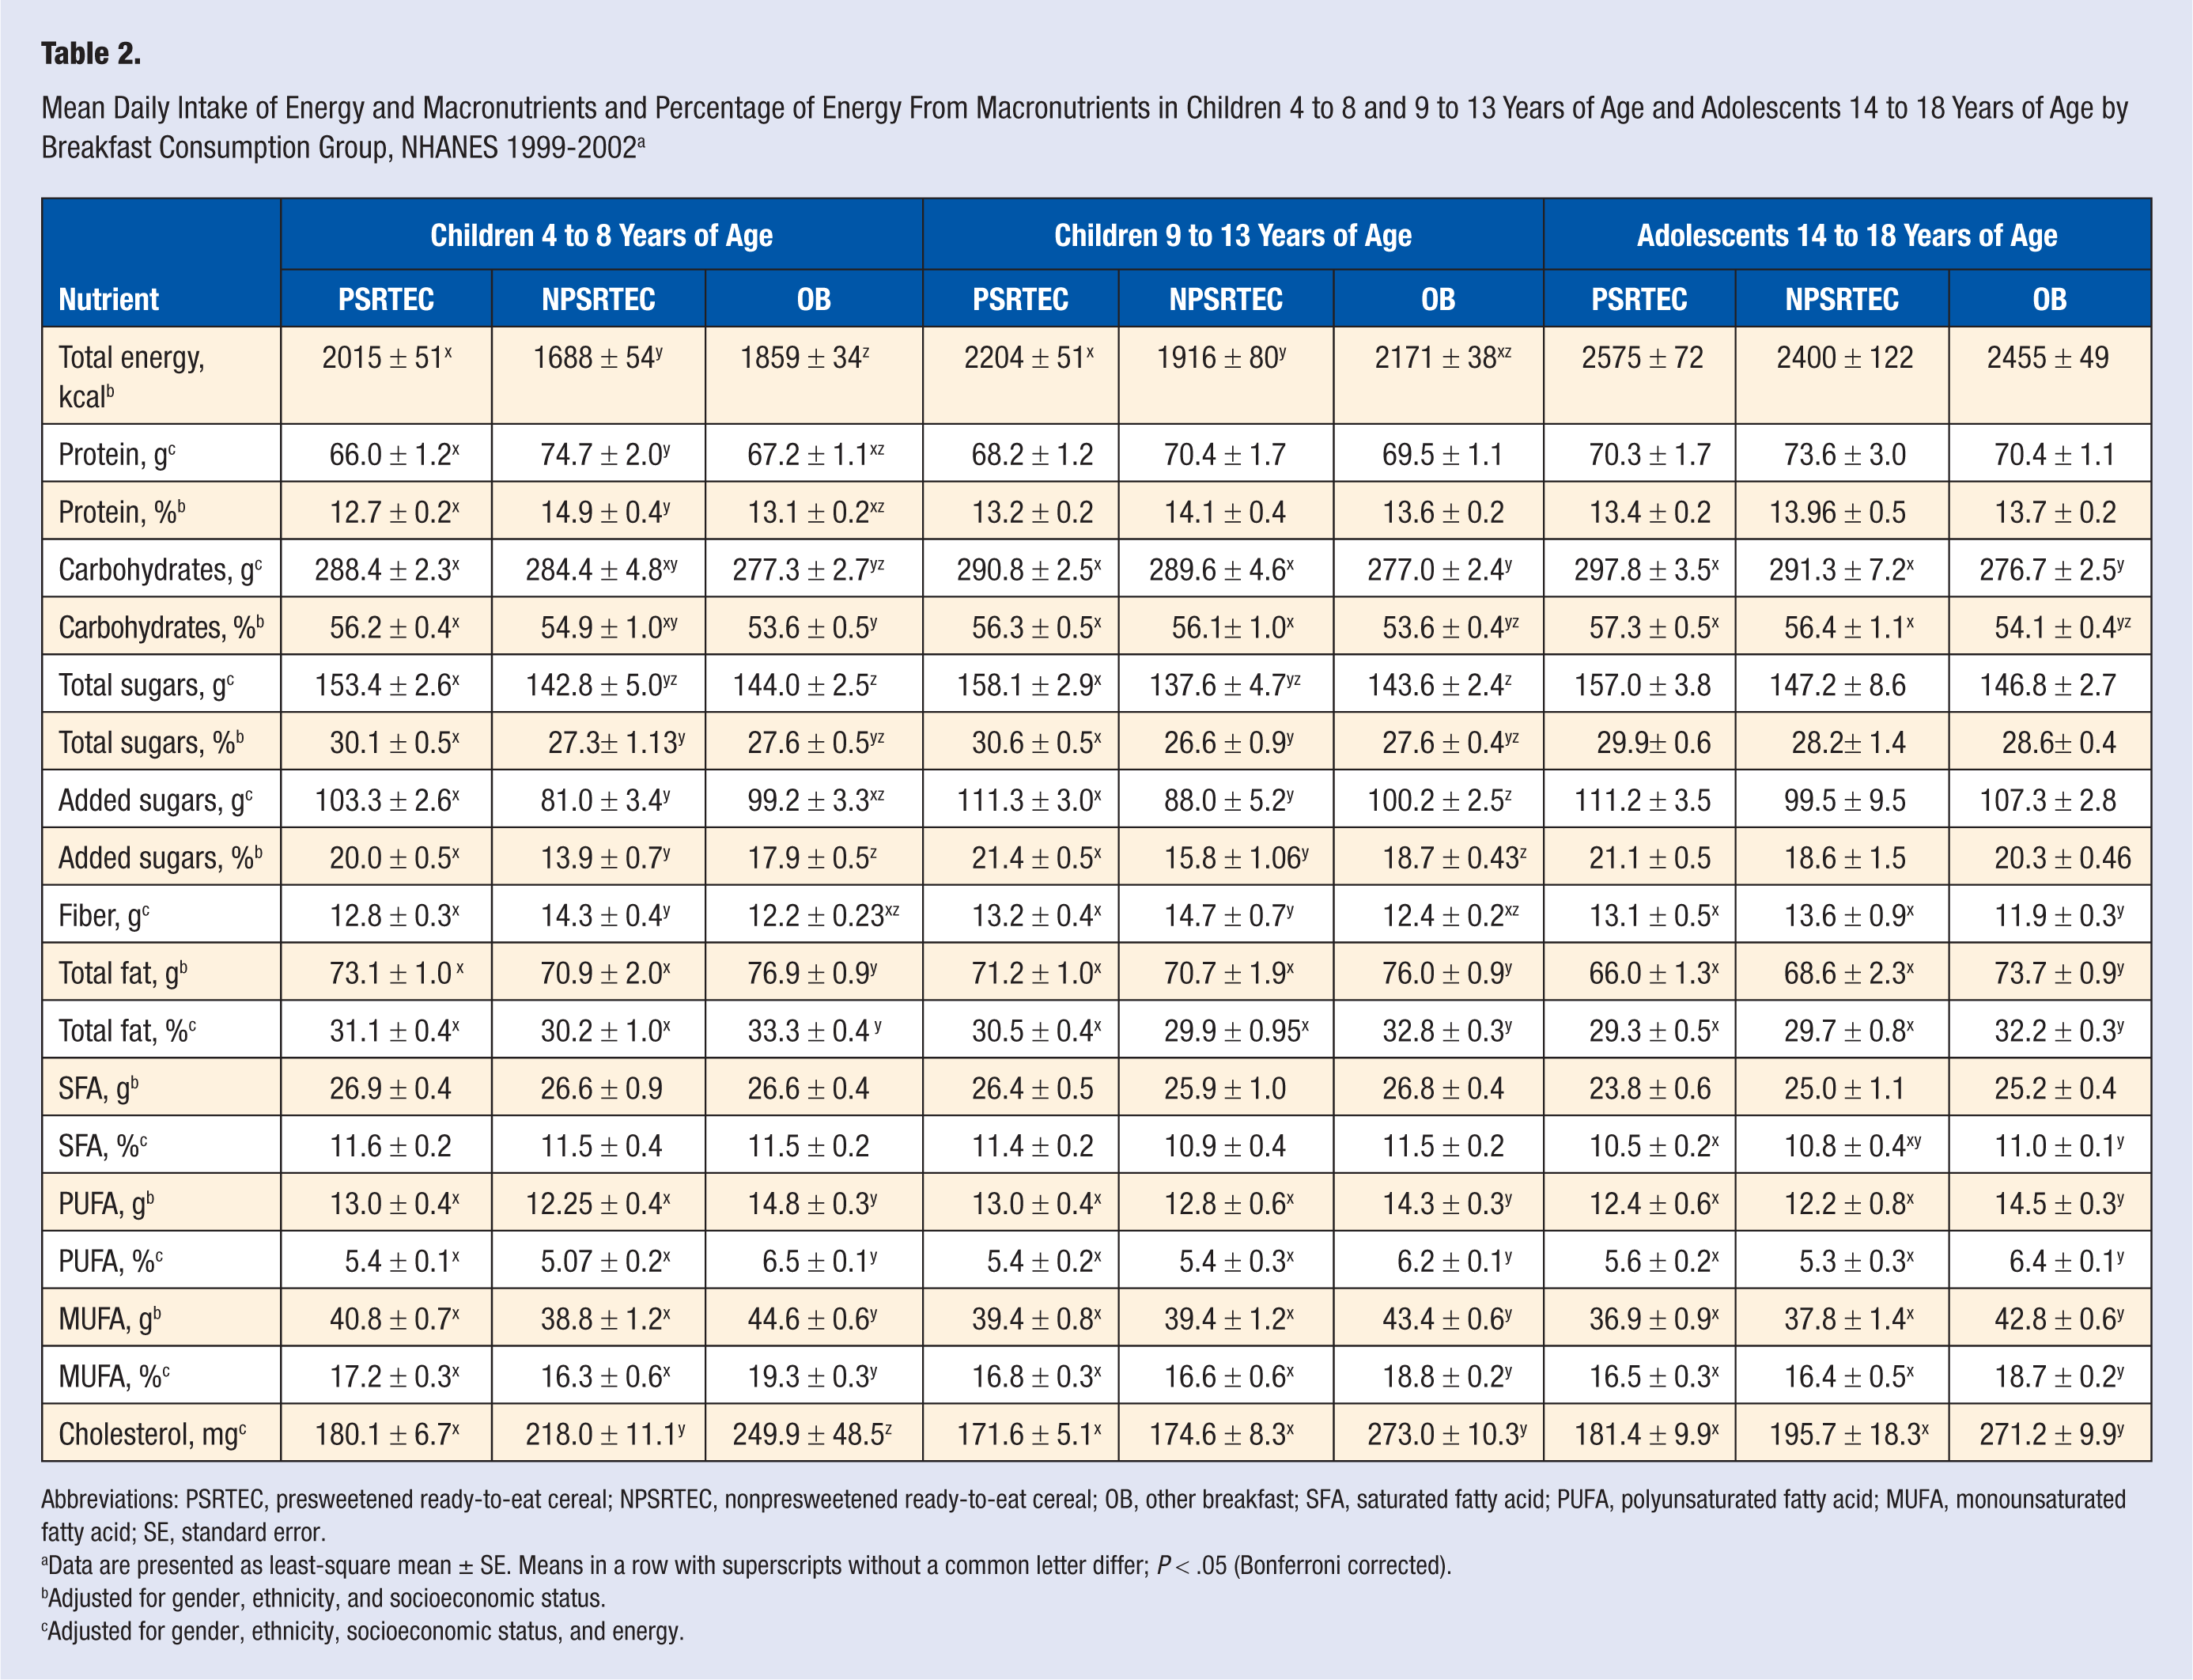
Abbreviations: PSRTEC, presweetened ready-to-eat cereal; NPSRTEC, nonpresweetened ready-to-eat cereal; OB, other breakfast; SFA, saturated fatty acid; PUFA, polyunsaturated fatty acid; MUFA, monounsaturated fatty acid; SE, standard error.
Data are presented as least-square mean ± SE. Means in a row with superscripts without a common letter differ; P < .05 (Bonferroni corrected).
Adjusted for gender, ethnicity, and socioeconomic status.
Adjusted for gender, ethnicity, socioeconomic status, and energy.
Consumption of total carbohydrates, total and added sugars, and fiber varied by age group and by breakfast consumption group (Table 2). In children 4 to 8 years old, total and added sugars were highest in the PSRTEC consumers, constituting 30.1% and 20.0% of energy, respectively (Figure 1). In children 9 to 13 years old, total and added sugars were also highest in PSRTEC consumers constituting 30.6% and 21.4% of energy, respectively. In children 4 to 8 and 9 to 13 years old, dietary fiber intake was higher in those consuming NPSRTECs than in those consuming either PSRTECs or OBs. In adolescents 14 to 18 years old, dietary fiber intake in both RTEC consumption groups was the same, and both intakes were higher than that for the OB group.
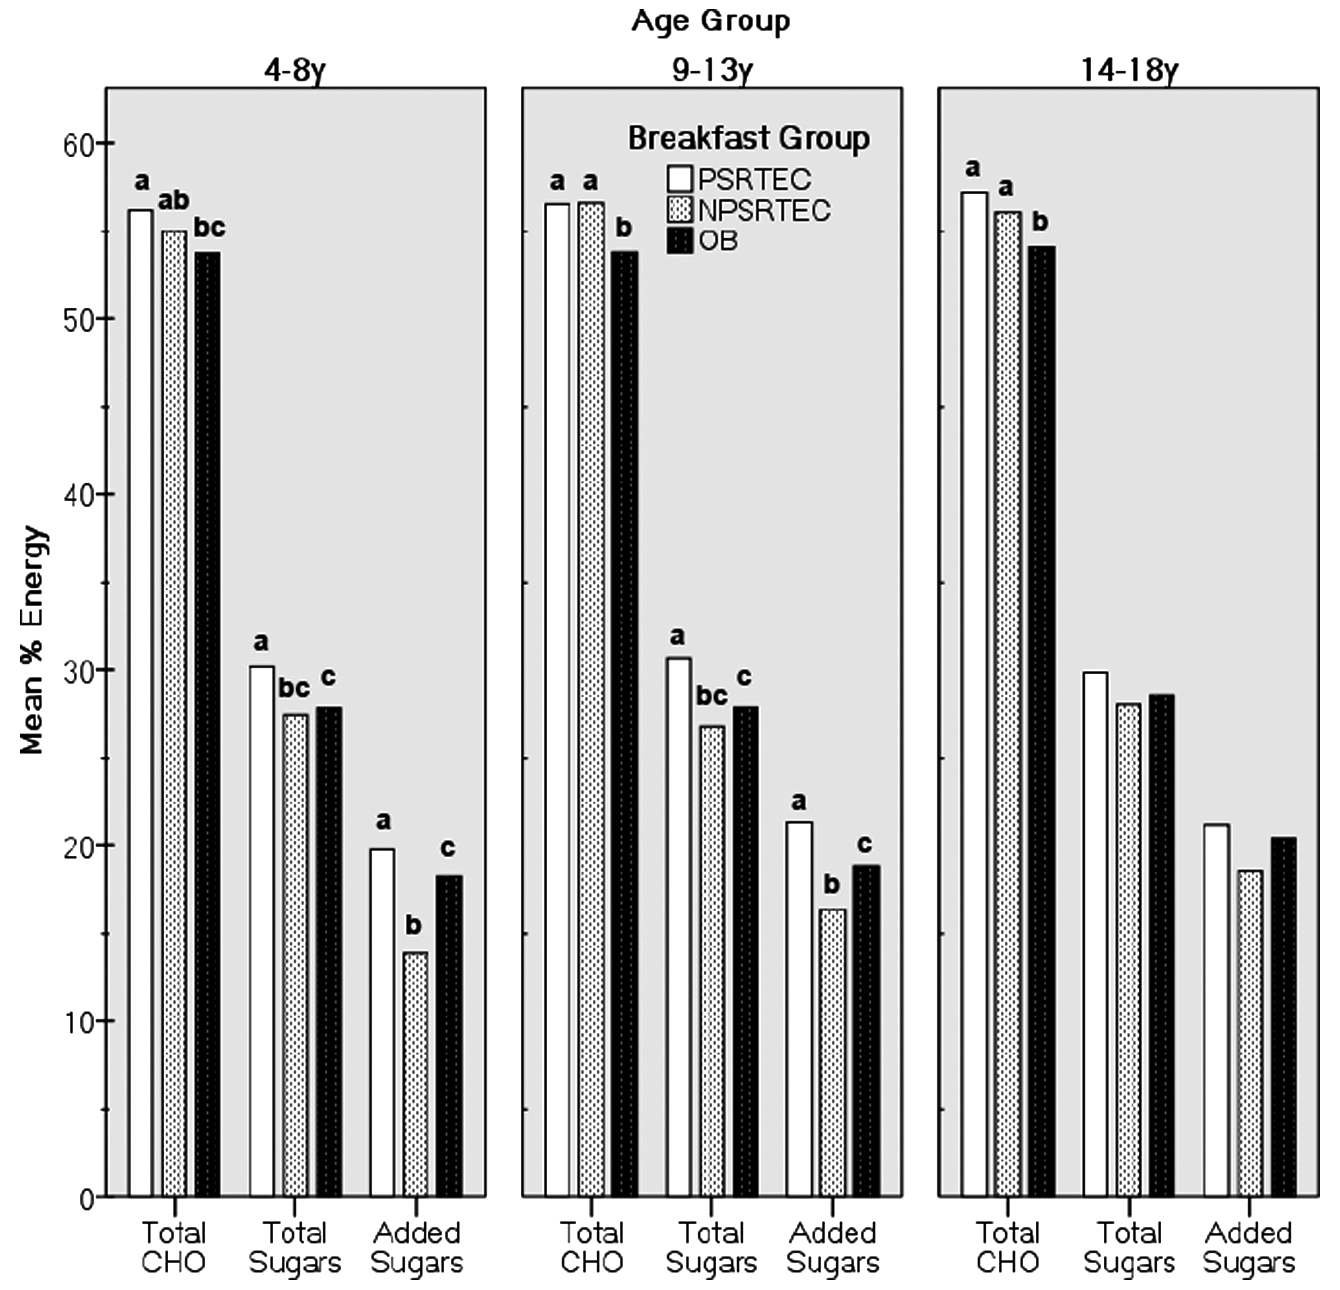
Mean Percentage of Energy From Carbohydrates, Total Sugars, and Added Sugars in Children 4 to 8 and 9 to 13 Years Old, and Adolescents 14 to 18 Years Old by Breakfast Consumption Group, NHANES 1999-2002.a
Micronutrient Composition by Breakfast Consumption Group
Table 3 shows the micronutrient intake composition for children and adolescents by breakfast consumption group. Vitamins B6 and B12, thiamin, riboflavin, niacin, and folate were highest in both groups of RTEC consumers when compared with OB consumers. Calcium intake was higher in both groups of RTEC consumers when compared with OB consumers; however, consumption was lower in PSRTEC consumers when compared with NPSRTEC consumers in children 9 to 13 years old. Zinc intake was highest in both groups of RTEC consumers when compared with OB consumers, and in children 9 to 13 years old, zinc was highest in PSRTEC consumers. Magnesium and potassium intake varied but was generally lowest in OB consumers.
Mean Daily Intake of Micronutrients in Children 4 to 8 and 9 to 13 Years of Age and Adolescents 14 to 18 Years of Age by Breakfast Consumption Group, NHANES 1999-2002 a
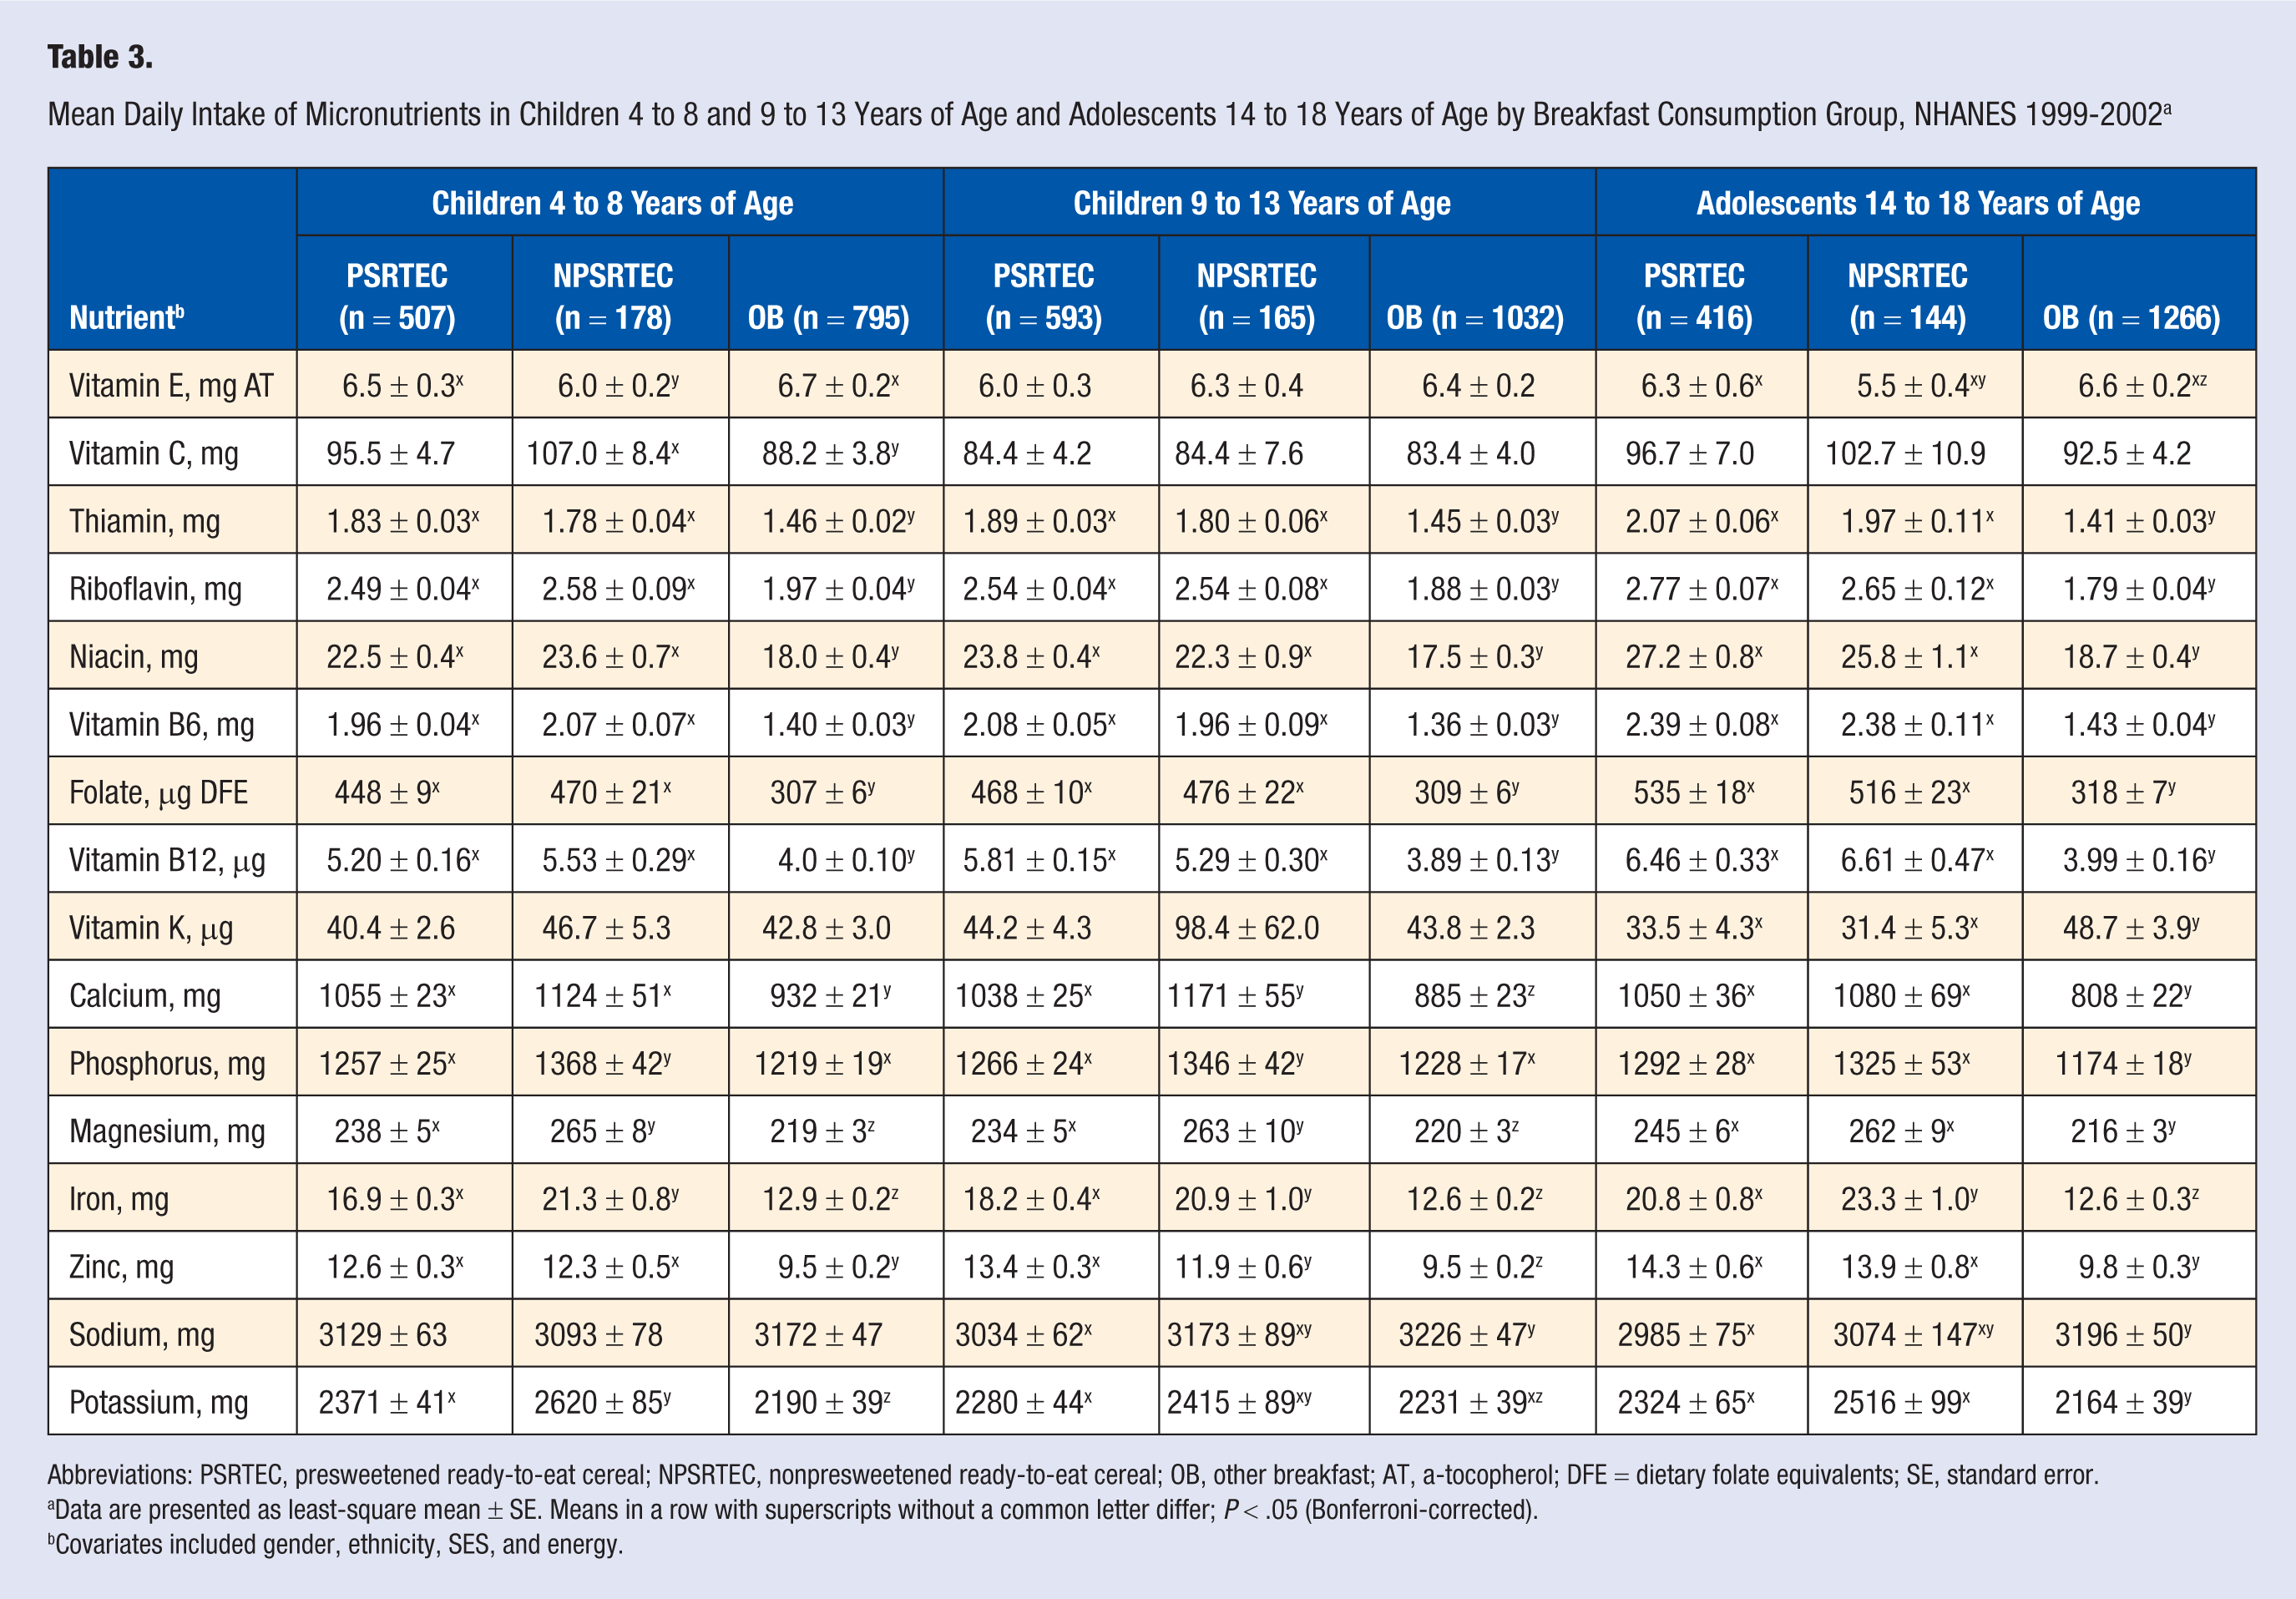
Abbreviations: PSRTEC, presweetened ready-to-eat cereal; NPSRTEC, nonpresweetened ready-to-eat cereal; OB, other breakfast; AT, a-tocopherol; DFE = dietary folate equivalents; SE, standard error.
Data are presented as least-square mean ± SE. Means in a row with superscripts without a common letter differ; P < .05 (Bonferroni-corrected).
Covariates included gender, ethnicity, SES, and energy.
Mean Levels of Body Weight Measures by Breakfast Consumption Group
Mean adjusted levels of body weight measures by breakfast consumption group are shown in Table 4. For children 4 to 8 years old, there were no differences in any weight measure. For children 9 to 13 years old and for adolescents 14 to 18 years old, NPSRTEC consumers had a lower BMI and BMI-for-age z-score than OB consumers. OB consumers had the highest waist circumference only in adolescents.
Mean Body Weight Measures in Children 4 to 8 and 9 to 13 Years of Age and Adolescents 14 to 18 Years of Age by Breakfast Consumption Group, NHANES 1999-2002 a
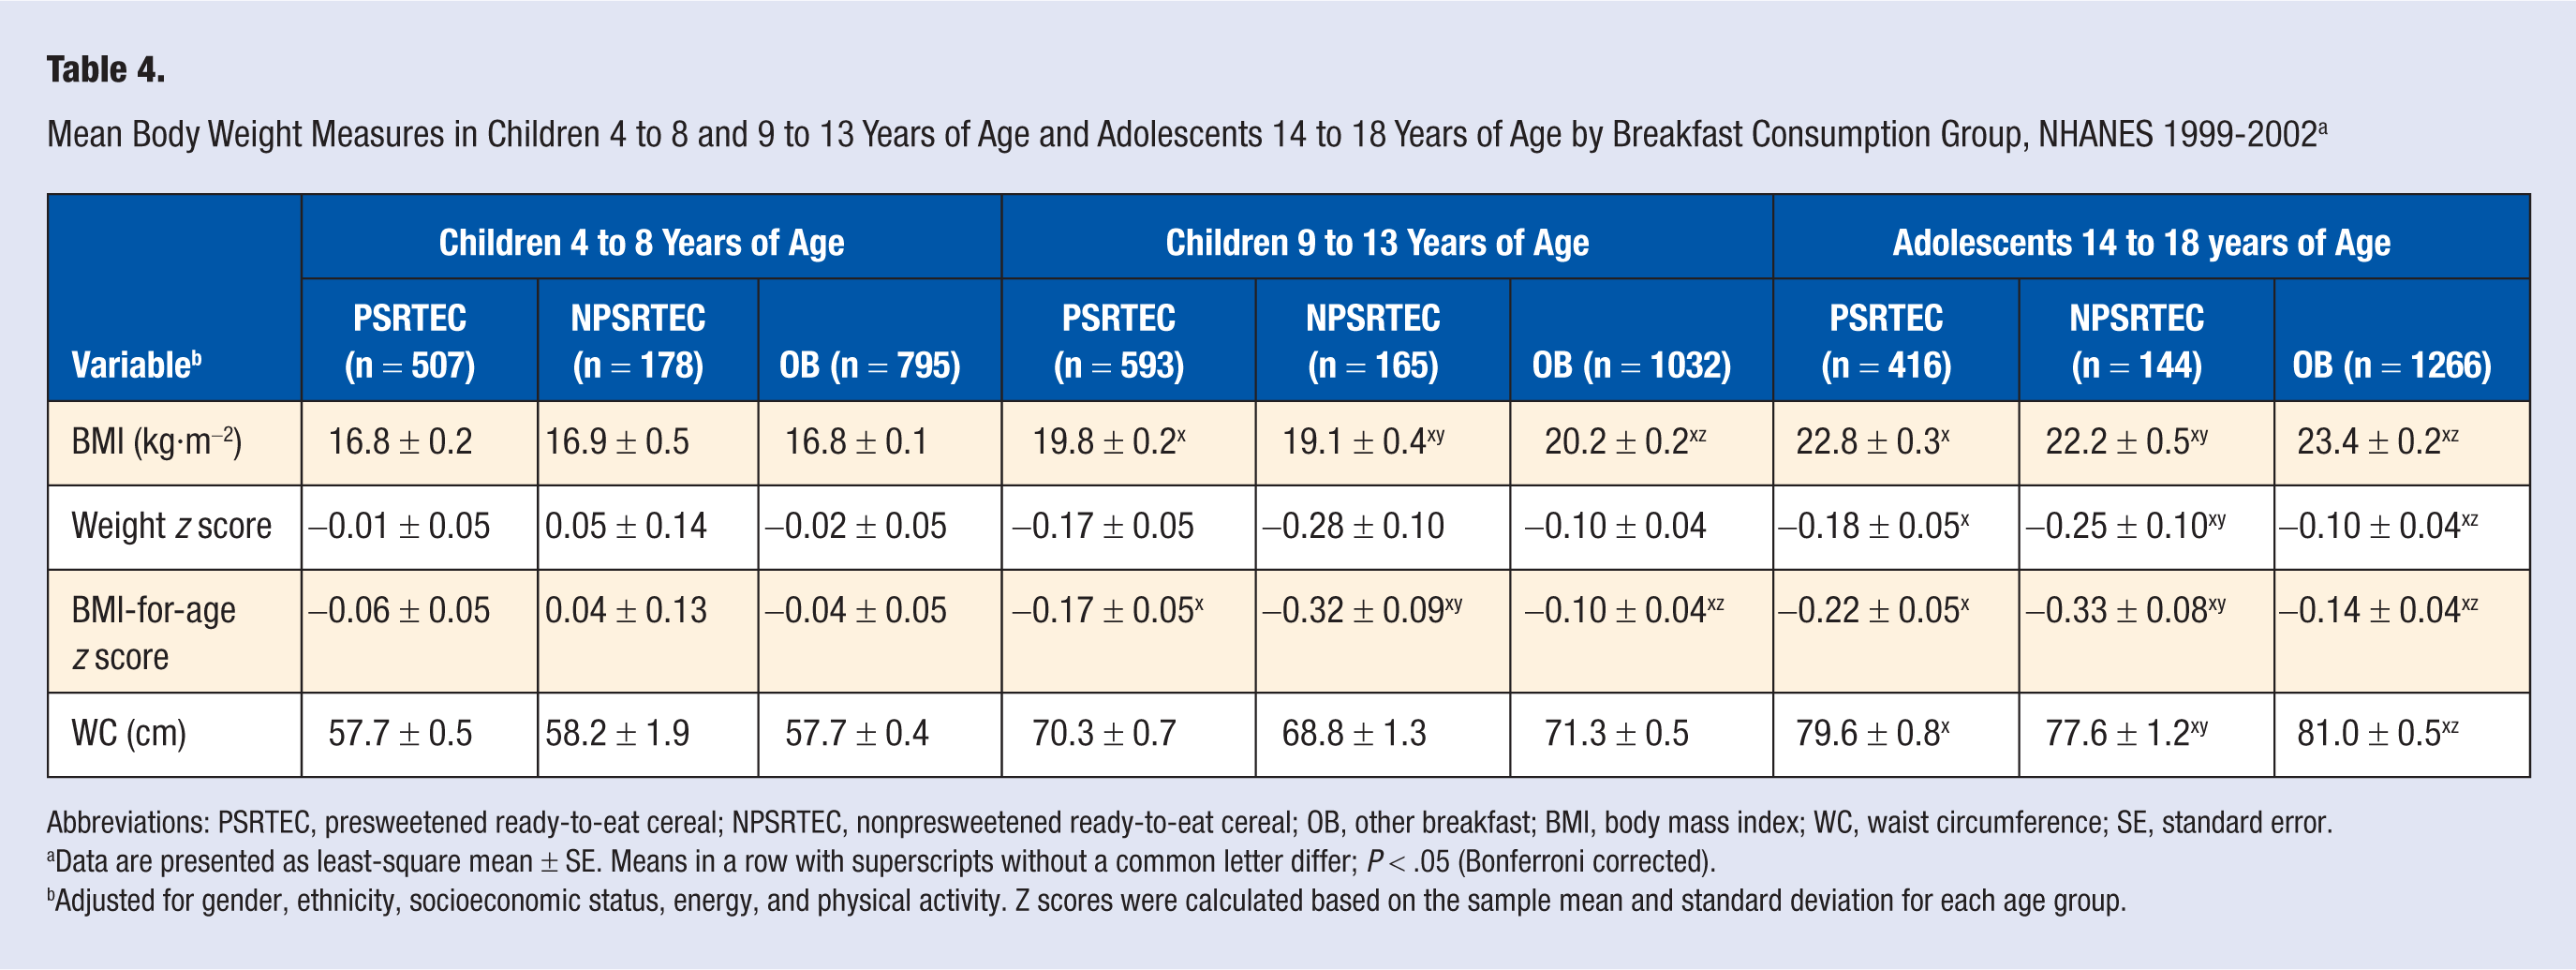
Abbreviations: PSRTEC, presweetened ready-to-eat cereal; NPSRTEC, nonpresweetened ready-to-eat cereal; OB, other breakfast; BMI, body mass index; WC, waist circumference; SE, standard error.
Data are presented as least-square mean ± SE. Means in a row with superscripts without a common letter differ; P < .05 (Bonferroni corrected).
Adjusted for gender, ethnicity, socioeconomic status, energy, and physical activity.
Discussion
This study showed that consumption of RTECs, presweetened or not, for breakfast was associated with higher micronutrient intake in children and adolescents than consumption of OBs. Total sugar and added sugar consumption was higher in the PSRTEC consumers when compared with the OB consumption group, but not NPSRTEC consumers, in children but not in adolescents. No weight measure was higher in PSRTEC consumers than in the other 2 groups. This is the first study to examine the contribution of PSRTECs to nutrient intake using a nationally representative data set.
More children in all age groups consumed OBs than either type of RTEC. However, of children and adolescents consuming RTECs, a higher proportion consumed PSRTECs than NPSRTECs. There was an ethnic difference among breakfast consumption groups. Hispanic children (4-8 and 9-13 years old) had the highest prevalence of OB consumption, and of those consuming RTECs, these children had the highest intake of NPSRTECs and the lowest intake of PSRTECs. Of concern was that in this study, 10%, 20%, and 32% of children/adolescents in the age groups, respectively, skipped breakfast (data not shown). These data are consistent with results from other studies,30,31 which suggest that older children are more likely to skip breakfast. Further research is needed to determine the reasons, but breakfast skipping may be partially attributable to environmental or behavioral changes that occur with increasing age, such as the changes in food choices available at school or changes in eating behaviors that are influenced by peers.30,32-34 It is important to continue to encourage breakfast consumption as children mature.
Mean protein, carbohydrate, and fat intake were all within current dietary recommendations for children from 4 to 18 years old as promulgated by the Institute of Medicine (IOM). When stated as a percentage of energy, these are 25% to 35% for fat, 45% to 65% for carbohydrates, and 10% to 30% for protein. 35 Recently, it was shown that cereals marketed to children, which may emphasize presweetened cereals, had a similar fat content but significantly lower protein content compared with cereals not marketed to children. 9 In adolescents, intake of SFAs was lower in those consuming PSRTECs when compared with those consuming OBs; however, mean intake from all groups exceeded the current recommendation. 35 Data from the present study showed that only in children 4 to 8 years old was percentage protein lower in the PSRTEC group when compared with the OB consumption group. The protein intake in children in this age group was within the recommended levels.
Fiber has been identified as a shortfall nutrient by the 2005 Dietary Guidelines Advisory Committee. 36 In children of both age groups, the highest mean fiber intake was in children consuming NPSRTECs; in adolescents, both groups consuming RTECs had a higher fiber intake than those consuming OBs. In none of the breakfast consumption groups did children meet the recommendations for fiber intake. 35 Other studies have shown that RTECs are a significant source of fiber for children.5,7,8 Children in this study may have consumed low-fiber cereals—in either group but especially in the PSRTEC group 9 —which indicates the need to promote increased intake of RTECs with higher fiber content or the need to supplement RTECs with additional fiber. 14
A principal concern about consumption of PSRTECs is the sugar that may be added to a child’s diet. This study showed that total and added sugars were highest among children consuming PSRTECs. In children consuming PSRTECs, the percentage of energy from added sugars was 20% and 21% in the 4- to 8- and 9- to 13-year-old age groups, respectively. In children of both age groups, added sugar intake was highest in the PSRTEC consumption group and lowest in the OB consumption group. In adolescents consuming PSRTECs, added sugars also contributed 21% of energy to the diet; that this age group showed no differences in percentage added sugar intake among the breakfast consumption groups may reflect the lower intake of PSRTECs compared with the other 2 age groups or to overall differences in diet.
The recommendations for added sugars in children and adolescents are not clear. The IOM found insufficient evidence of the association between added sugar and dental caries, behavior, cancer, risk of obesity, or risk of hyperlipidemia to set an upper limit for added sugars. The IOM did recommend that intake of added sugars may be as high as 25% of total energy without “detrimental effect” on micronutrient intake. 35 This recommendation was also promulgated by the American Dietetic Association in their position paper on healthy children 2 to 11 years old. 37 Furthermore, the DRIs set by the IOM are the basis for the Dietary Guidelines for Americans and MyPyramid, suggesting that the 25% of energy may be appropriate for children and adolescents. The IOM recommendation is considerably higher than the WHO recommendation of <10% of energy from “free sugars.” 38 Clearly, more studies are needed in children to determine recommendations for added sugars.
The 2005 Dietary Guidelines for Americans determined that small amounts of sugars added to nutrient-dense foods, such as cereals, may increase intake by enhancing palatability of these products, thus, improving nutrient intake without contributing excessive calories. 36 Using NHANES 2001-2002 data, it has been shown that 4% of energy from added sugars in the diet came from RTECs and that RTECs ranked sixth in overall contribution of added sugars to the diet. 39 The principal contributors to the total energy from added sugars in the diet were beverages, including sweetened carbonated beverages (37% of energy), fruit drinks (11%), and tea (3%); other sources included grain-based desserts (12%) and dairy desserts and candy (6% each).
Guthrie and Morton 40 stated that many foods and beverages with added sugars have lower micronutrient densities compared with foods and beverages with naturally occurring sugars. Some reports have linked high intakes of added sugars with low intakes of several micronutrients.11,14,41,42 Overall, this study showed that consumption of RTECs was associated with a better micronutrient profile than consumption of OBs. This is consistent with other studies that have shown that consumption of RTECs improves micronutrient intake.5,7,43 This finding is also consistent with that of Frary et al, 14 which showed that consumption of presweetened cereals increased the likelihood of the children and adolescents meeting the recommendations for select micronutrients, whereas the consumption of sugar-sweetened beverages, sugars and sweets, and sweetened grain foods decreased the likelihood of meeting the DRI for many micronutrients.
Consumption of added sugars has been associated with increased energy intake, which may lead to obesity 44 ; however, most of the research looking at this issue has been done with sweetened beverages. In this study, consumption of PSRTECs was associated with increased energy intake in children 4 to 8 years old; in children 9 to 13 years old, energy intake was lowest in NPSRTEC consumers. Children consuming PSRTECs were not heavier than those consuming NPSRTECs or OBs. Reasons for the higher level of energy intake without a concomitant higher BMI are not clear; however, in the youngest age group, the children may be too young for an effect of total energy intake on BMI to be discerned. Adiposity rebound occurs at approximately 5.5 to 6 years 45 ; therefore, a longitudinal study may be needed to fully assess the effect of PSRTECs on weight status. It is also possible that those consuming an RTEC breakfast have an overall healthier lifestyle. For example, those consuming RTECs generally have a higher intake of milk and calcium than non-RTEC consumers.2,3 Higher levels of calcium were seen in the current study for this group when compared with OB consumers. The role of calcium in the accretion of bone mineral density has been well established. Most, although not all,46,47 studies have also shown that milk/calcium intake was associated with other health benefits in children and adolescents, including lower body weight and lower levels of body fat.48-55
The literature is conflicting as to whether consumption of RTECs is associated with lower body weight measures than in those consuming OBs. Most studies have shown that consumption of RTECs is associated with lower weight measures.7,8,56,57 Two recent surveys using nationally representative data have suggested that consumption of RTECs is not associated with lower weight measures in black children and adolescents.43,58 This suggests the possibility of racial differences in response to consumption of RTEC or other foods; alternately, the study populations may have influenced these findings. Further study is needed.
This study had several limitations. The cross-sectional study design of NHANES does not provide the longitudinal data needed to determine if the increased energy intake associated with consumption of PSRTECs would lead to increased weight over time. No cause and effect relationships can be determined. A single dietary recall may not represent the typical intake 59 of the study population and under- or overreporting of energy may have occurred.60,61 Children of preschool age typically spend time away from their parents in child care facilities or schools, and parents may be unaware of everything that the child consumed the day before; thus, parental reporting is subject to reporting errors. A recent study showed that children in the fourth grade who consumed school breakfast were likely to misreport intake of beverage and grain products, including cereals; although children were more likely to misreport intake of hot cereal, misreporting intake of RTECs is a possibility. 62 Furthermore, no attempt was made to determine the sugar added to NPSRTECs. Intake of dietary supplements was not considered in this study. Finally, this study assessed the total daily intake and not the contribution of RTECs in the breakfast meal only and did not assess the other foods consumed with RTECs at breakfast or RTECs consumed at other meals.
Conclusions
In this study, consumption of PSRTECs and NPSRTECs at breakfast was associated with diets that met recommendations for daily fat, SFA, and cholesterol intakes and was higher in micronutrients than consumption of OBs. Both groups of RTEC consumers had improved nutrient intake compared with OB consumers; however, consumption of PSRTECs was associated with lower fiber intake in all age groups and higher added sugar intakes in both age groups of children than consumption of NPSRTECs. Both are of concern and suggest that NPSRTECs may be a better choice for children; however, results suggested that most children did not consume NPSRTECs. There was no indication that consuming PSRTECs was associated with a higher BMI or other weight measures when compared with NPSRTECs or OBs. Recent changes by the food industry have included reducing the sugar content and increasing the fiber content of PSRTECs. It is important to encourage breakfast intake by all children and adolescents.
Footnotes
Acknowledgements
Partial support was received from the USDA Hatch Projects 940-36-3104 Project #93673 and LAB 93676 #0199070 and the Kellogg’s Corporate Citizenship Fund. This work is a publication of the United States Department of Agriculture (USDA/ARS) Children’s Nutrition Research Center, Department of Pediatrics, Baylor College of Medicine in Houston, Texas, and was also funded in part with federal funds from the USDA/Agricultural Research Service under Cooperative Agreement No. 58-6250-6-003.
This work was presented, in part, as a poster presentation at the Food and Nutrition Conference and Expo in 2008. The contents of this publication do not necessarily reflect the views or policies of the USDA, nor does the mention of trade names, commercial products, or organizations imply endorsement from the US government.