
Abstract
Objectives
Develop a high-throughput, fully automated workflow for dicentric chromosome and micronucleus assays to enable rapid, accurate radiation dose estimation in radiological or nuclear emergencies.
Methods
Blood from four healthy donors was irradiated (0–5.00 Gy, 137Cs γ-rays), repaired for 2 h at 37°C, and processed via an integrated platform (Chromprep + Metafer 4 + LS-CAS). Dicentric chromosomes (per 100 cells) and micronucleus (per 1,000 cells) were automatically scored. Dose–response data fitted to a quadratic model and validated using blinded samples with 95% confidence intervals accounting for Poisson statistics and curve uncertainty.
Results
The automated dose-response curves for chromosome aberrations and micronuclei are y=8.4642x2-3.7786x+1.5439 and y=23.348x2+60.469x-1.6856, respectively. Calibration curves showed excellent fit (R2=0.997 fordicentric chromosome; R2=0.996 formicronucleus). All validation doses fell within estimated confidence intervals. The system achieved end-to-end automation with minimal human intervention while maintaining high accuracy and reproducibility.
Conclusion
This workflow provides a standardized, scalable, and reliable solution for rapid biodosimetry in mass-casualty radiological incidents, effectively bridging laboratory capacity and real-world emergency response needs.

Keywords
Introduction
Radiation biological dosimetry is a method for assessing an individual’s absorbed dose by analyzing biomarkers in biological specimens. 1 It has important applications in nuclear-accident emergency response, occupational health surveillance, medical radiotherapy, and epidemiological research, and is an indispensable tool in radiation-safety management.2,3
Commonly used biodosimetry approaches include dicentric chromosome analysis, the cytokinesis-block micronucleus assay, fluorescence in situ hybridization (FISH), gene-expression profiling, metabolite analysis, and electron paramagnetic resonance (EPR). Among these, dicentric chromosome and cytokinesis-block micronucleus assays are recognized by the International Atomic Energy Agency (IAEA) as the two most important methods in radiation biodosimetry due to their complementary roles: dicentric chromosome analysis—highly specific and accurate—is considered the gold standard for medium-to-high dose estimation (0.5-5.00 Gy), whereas the micronucleus assay, being rapid and technically simpler, is ideal for low-dose screening and large-scale triage.4,5 Despite their utility, both methods face significant practical limitations. Sample preparation involves handling hazardous chemicals such as glacial acetic acid and methanol, posing chronic health risks including dermatitis, respiratory irritation, and potential neurotoxicity. 6 More critically, conventional analysis is labor-intensive, time-consuming (often requiring 4-5 days per sample), and heavily dependent on expert cytogeneticists for subjective interpretation—a major bottleneck in mass-casualty scenarios. 7 Although semi-automated platforms (e.g., Metafer, CytoVision) have been adopted to accelerate metaphase finding and initial aberration detection, they still require extensive manual review, particularly for complex chromosomal rearrangements, and lack standardized scoring criteria across laboratories.7,8 Recent advances in artificial intelligence, including convolutional neural networks for dicentric chromosome and micronucleus recognition, show promise in controlled settings,9-11 yet no study has integrated end-to-end automation—from blood culture and slide preparation to high-throughput imaging, dose–response modeling, and blinded dose validation—within a single, validated pipeline suitable for emergency response. This unmet need forms the foundation of our work.
The Automated Application Laboratory is equipped with an automated cell harvester, an integrated slide preparation–staining system, and an intelligent scanning and analysis platform required for radiation biodosimetry. This workflow reduces occupational hazards during specimen processing, improves efficiency, consistency, and sample quality, and enables comprehensive data recording and traceability, offering substantial value for occupational protection research, clinical diagnostics, and quality control. In parallel, Automated scanning and analysis enable high-throughput data processing, accurate model development, and the generation of calibration curves for radiation biodosimetry with associated risk assessment, thereby markedly improving the accuracy and efficiency of dose estimation while reducing dependence on specialized personnel, with important implications for radiation protection and medical applications.
Materials and Methods
Major Instruments and Reagents
137Cs γ-ray irradiator (Autocell 40, Atomic Energy of Canada Limited); automated cell harvester (Chromprep II, Shanghai Lechen Biotechnology Co., Ltd.); slide preparation system (Chromprep AS, Shanghai Lechen Biotechnology Co., Ltd.); automated scanning and analysis system (Metafer 4, Carl Zeiss and MetaSystems, Germany); dose-curve fitting software (LS-CAS, Lishi Intelligent Technology [Shanghai] Co., Ltd.); peripheral blood cell culture medium (Chromed P, Shanghai Lechen Biotechnology Co., Ltd.); Giemsa stain (Chromed G, Shanghai Lechen Biotechnology Co., Ltd.); cytochalasin B (C805410, Macklin Biochemical Co., Ltd., Shanghai, China).
Sample Collection
Validation of human peripheral-blood radiation biomarkers in the Automated Application Laboratory. Five volunteers were recruited; for each, 2 mL of heparinized whole blood was collected. The five samples were irradiated in vitro with γ-rays at 3.20 Gy (0.78 Gy/min). After a 2-h post-irradiation repair at 37 °C, samples underwent culture, slide preparation, and software-based scanning and analysis. For each culture, 0.5 mL of blood was added to the medium; 0.5 mL of the harvested cell suspension was collected by the automated harvester or manually; five slides per tube were prepared by the slide maker or by manual dropping. Assuming a 64-sample-throughput setup, one batch required approximately 8 h to complete harvesting and slide preparation—comparable to manual preparation time.
For scanning and analysis, a human analyst working an 8-h day could score ∼1 dicentric-chromosome slide or ∼2 micronucleus slides, whereas the instrument could scan and evaluate one micronucleus slide every 15 min and assess 12 metaphase cells per minute at high magnification.
Establishment of the Human Peripheral-Blood Biodosimetry Calibration Curve
Four healthy adult volunteers were recruited (2 males and 2 females, 17–40 years). Inclusion criteria: non-radiation workers; no smoking or alcohol habits; no exposure to toxic or hazardous chemicals within the past 6 months; no history of radiation exposure; no acute or chronic diseases; and no viral infection within the past month. Heparinized antecubital venous blood was drawn—nine tubes per person, 3 mL per tube.
Validation of the Biodosimetry Calibration Curve
In order to verify the calibration curve of biological dose determination, three healthy adult volunteers were recruited (2 males and 1 female, 25–35 years), and a tube (3 mL) of heparinized blood was collected from each person’s antecubital vein.
Dosimetric Calibration of the 137Cs Irradiation Source
A 137Cs γ-ray source provided by the Institute of Radiation Medicine, Chinese Academy of Medical Sciences. The absorbed dose rate of the 137Cs γ-ray irradiator was calibrated annually by the National Institute of Metrology, China (NIM), using an ionization chamber traceable to primary standards. Prior to each irradiation experiment, the dose rate at the sample position was verified using Fricke dosimetry according to ISO/ASTM 51607. The measured dose rate was 0.78 Gy/min at room temperature (20 ± 2°C), with a combined standard uncertainty of <2% (k = 1). Dose uniformity across the sample holder was confirmed to be within ±3% using alanine pellets and Gafchromic™ EBT3 film. All irradiations were performed at a fixed source-to-sample distance, and exposure times were calculated based on the calibrated dose rate to achieve target doses of 0–5.00 Gy.
In-Vitro Irradiation
Irradiations were performed using the 137Cs γ-ray source. For the laboratory validation of peripheral-blood radiation biomarkers, the delivered dose was 3.20 Gy at a dose rate of 0.78 Gy/min. For construction of the biodosimetry dose–response curve, blood samples were irradiated at 0, 0.25, 0.50, 0.75, 1.00, 2.00, 3.00, 4.00, and 5.00 Gy at 0.78 Gy/min. For dicentric-chromosome curve validation, the doses were 0.60, 4.10, and 1.10 Gy at 0.78 Gy/min; for micronucleus curve validation, the doses were 0.40, 2.10, and 3.10 Gy at 0.78 Gy/min.
Cell Culture and Slide Preparation
Micro–whole-blood cultures were established following IAEA Technical Report Series No. 465, Cytogenetic Dosimetry: Applications in Radiological and Nuclear Emergency Preparedness and Response. 9 Cell harvesting was performed with the automated cell harvester, and slide preparation and staining were completed with the integrated slide preparation system.
Scoring of Dicentrics and Micronuclei
Slides were scanned with Metafer 4 using 10×/60× objectives. In the fully automated scoring mode, dicentrics and micronuclei were scored using the Metafer image-analysis platform modules (dicentric chromosome/micronucleus Score).
To ensure the validity of cytogenetic scoring, two key quality control indices were monitored in accordance with IAEA Technical Reports Series No. 465. 9
For the dicentric chromosome assay, the Metaphase Index (MI) was calculated as the percentage of metaphase cells (with a modal chromosome number of 2n = 46) among total viable lymphocytes counted:

For the cytokinesis-block micronucleus assay, the Nuclear Division Index (NDI) was used to evaluate lymphocyte proliferative capacity and verify successful cytochalasin-B blockage. Nuclear Division Index was calculated as:


Quality Assurance and Scorer Validation
Although the primary analysis was fully automated, a manual validation cohort was assessed to verify system performance. Three Scorers A, B, C, each with >5 years of experience, independently reviewed 500 randomly selected metaphase images per dose point. Intra-scorer reproducibility was evaluated by having each scorer re-analyze a 200-cell subset after a 14-day washout period. Inter-scorer agreement was calculated using Cohen’s kappa (Supplemental Table 1).
Dose Estimation and Statistical Analysis
Data were processed with LS-CAS. The relationships between dose and the dicentric-chromosome rate or micronucleus rate conformed to a quadratic polynomial and were fitted according to equation (1):

Dose estimates for validation samples were obtained with LS-CAS. Accounting for Poisson error and calibration-curve uncertainty, 95% upper and lower confidence limits were computed (IAEA, 2011). When the 95% confidence interval of the estimated dose encompassed the known delivered dose, the estimate was considered accurate.
This study was conducted from March 2023 to October 2024, covering sample recruitment, in vitro irradiation, automated detection, and data analysis. All experimental protocols were approved by the Ethics Committee of the Chongqing Center for Disease Control and Prevention (approval No. KY-2023-004-1), and all participants provided written informed consent.
Results
Validation of Human Peripheral-Blood Radiation Biomarkers in the Automated Application Laboratory
For metaphase (dicentric chromosome) preparations, the automated system detected a mean of 2220±509 metaphase cells per slide, with a coefficient of variation of 22.90%, compared to 2180 ±585 (variation 28.68%) for manual scoring. The repeatability, defined as the ratio of metaphases accepted in the first versus second scan, was 83.23% for the automated system and 89.49% for manual evaluation. Sensitivity, calculated as the ratio of scanner-accepted metaphases to the true count, was 98.34% for automation and 100.00% for manual assessment. Accuracy in dicentric chromosome detection was 35.62% per 100 cells, significantly lower than the 100.00% achieved by manual counting.
For binucleated-cell (micronucleus) preparations, the automated system identified a mean of 2653±185 binucleated cells per slide (variation 6.96%), while manual scoring yielded 2600 ± 256 (variation 8.41%). Repeatability was 97.45% for automated scanning versus 96.65% for manual review. Sensitivity was 98.46% for the automated system and 100.00% for manual scoring. Micronucleus detection accuracy was 85.69%, still notably lower than the 100.00% of manual evaluation.
Automatic System and Manual Detection Data

Quality Control of Cell Cultures
Comprehensive Analysis of Chromosome Aberration Rates, Quality Control Indices, and Radiation Dose

For the dicentric chromosome assay, 20,000 metaphase cells were scored per dose point. The values for dicentric chromosome counts are presented as mean ± standard deviation.
Comprehensive Analysis of Cell Micronucleus Rates, Quality Control Indices, and Radiation Dose
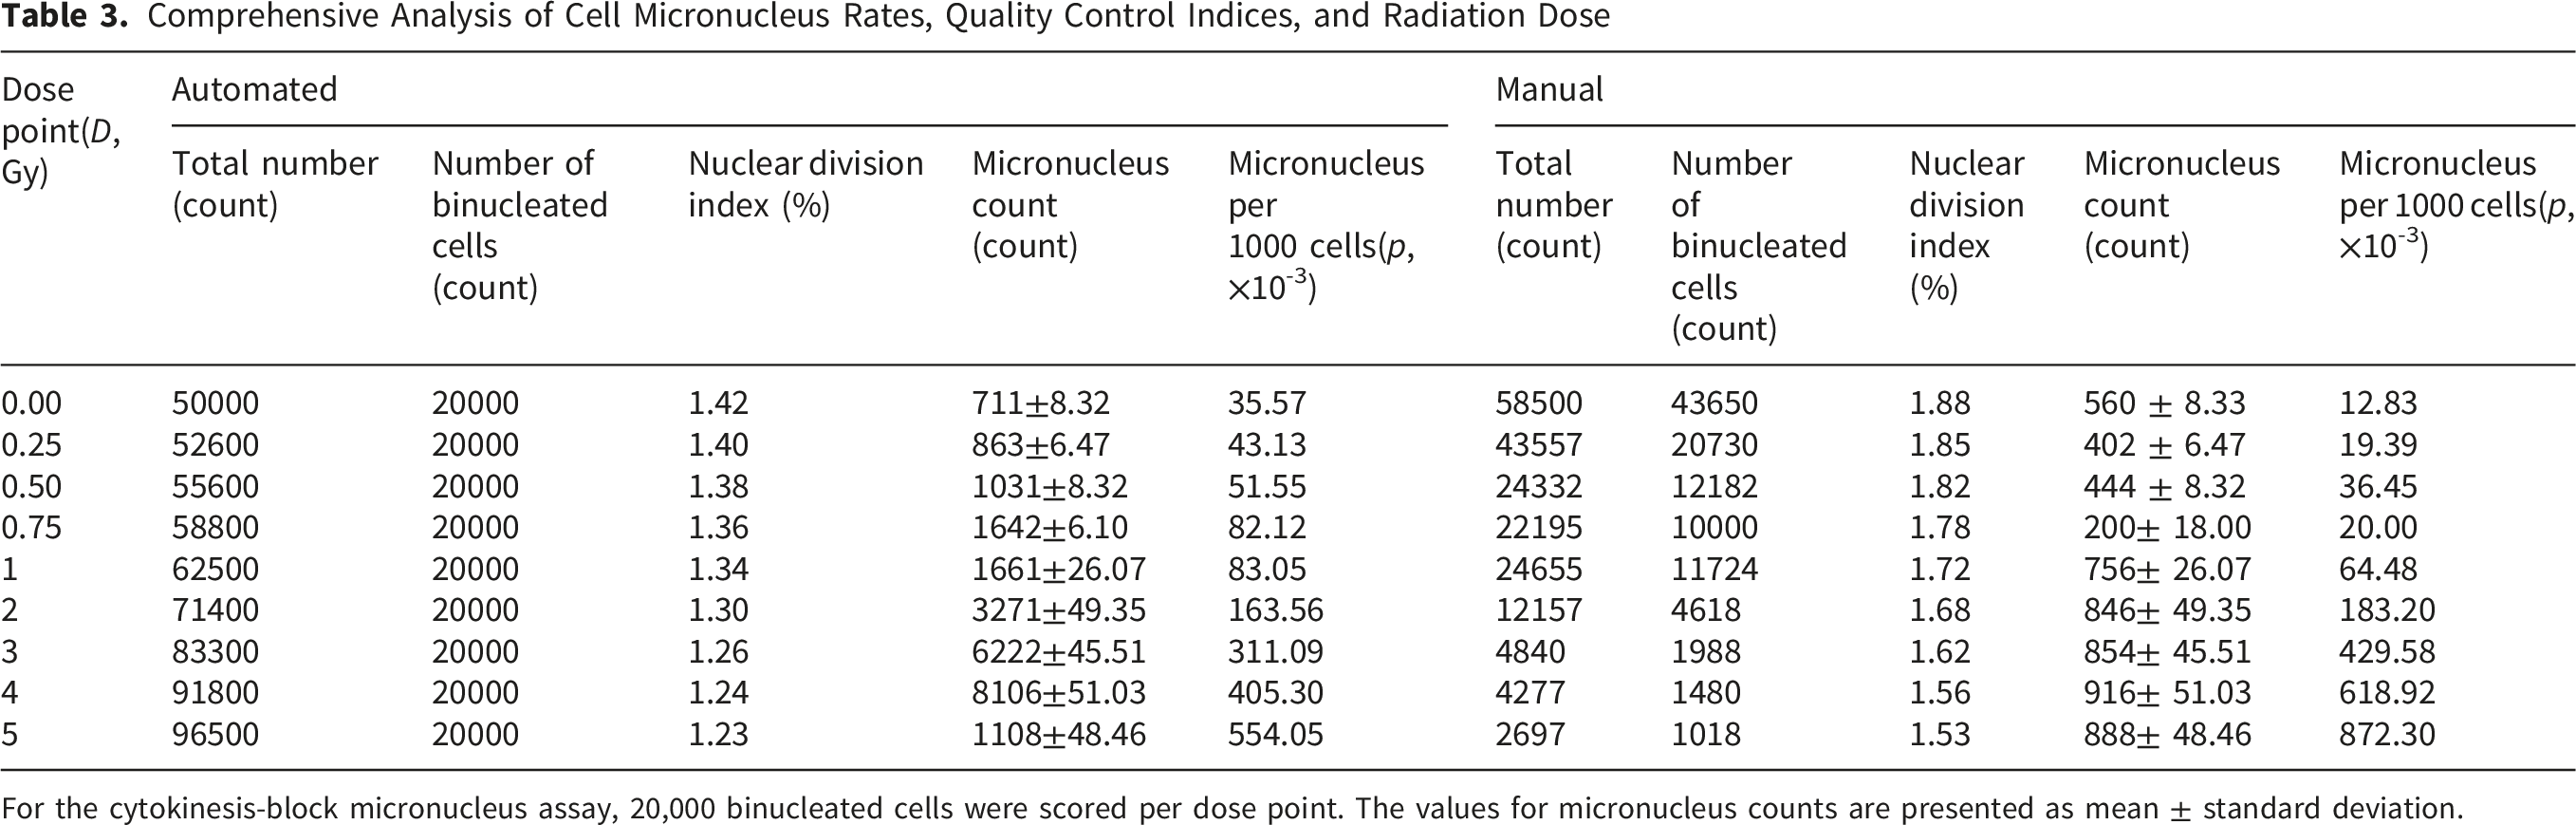
For the cytokinesis-block micronucleus assay, 20,000 binucleated cells were scored per dose point. The values for micronucleus counts are presented as mean ± standard deviation.
Relationship Between Cell Aberration Rate and Radiation Dose
Nine dose points were set at 0.00, 0.25, 0.50, 0.75, 1.00, 2.00, 3.00, 4.00, and 5.00 Gy, and four healthy adult volunteers (2 males, 2 females; 17–40 years) were irradiated in vitro at 0.78 Gy/min, followed by a 2-h repair at 37 °C. At each dose point, enough valid cells were scanned. With increasing dose, the cell dicentric chromosome and micronucleus rates rose progressively. At 0 Gy, the dicentric chromosome rate was 2.24 per 100 cells and the micronucleus rate was 35.57 per 1000 cells. Below 1.00 Gy, standard deviations were similar across doses and dose dependence was not pronounced; above 1.00 Gy, standard deviations increased markedly and dose dependence became evident ( Tables 2 and 3).
Across 0–5 Gy, the cell aberration rate (dicentric chromosome/micronucleus) exhibited a quadratic (second-order polynomial) relationship with dose. Two curve-comparison modes were used: (i) automated detection by the Automated Application Laboratory system, for which the cell aberration rates (dicentric chromosome/micronucleus) ranged from 2.23–47.92 per 100 cells and 35.57–554.05 per 1000 cells, respectively; and (ii) manual re-verification, in which all cells and event classes flagged by the automated system were reviewed and corrected by human experts, yielding cell aberration rates (dicentric chromosome/micronucleus) of 0.02–194.82 per 100 cells and 12.83–872.30 per 1000 cells, respectively ( Figures 1 and 2). Within 0–5.00 Gy, dose–response curves of per 100 cell dicentric chromosomes with 137Cs γ-rays Within 0–5.00 Gy, dose–response curves of per 1000 cell micronucleus with 137Cs γ-rays

Fitting and Validation of Biodosimetry Calibration Curves
Based on the effect plots of per-cell aberration versus dose, the relationships between dicentrics/micronuclei and delivered dose were fitted with a quadratic polynomial, y=aD 2 +bD+c Equation (1), where y denotes the per-cell yield of dicentrics or micronuclei (p), D is the absorbed dose (Gy), c is the background rate, a is the quadratic coefficient, and b is the linear coefficient. Using observed (y, D) pairs, the regression coefficients were estimated. For 137Cs γ-ray exposures over 0–5 Gy at 0.78 Gy/min, the automated detection yielded a dicentric rate (×10−2) dose–response curve of the form y=8.4642x2 - 3.7786x + 1.5439(coefficient of determination R2 = 0.997), and a micronucleus rate (×10−3) curve of the same form y=23.348x2 + 60.469x-1.6856 (R2 = 0.996) ( Figures 1 and 2).
Validation of Biological Dose-Response Curve

Discussion
Radiation biodosimetry plays a vital role in clinical care, emergency response, radiation protection, and personalized medicine, serving as an indispensable tool in modern radiation safety.8-11 In radiotherapy, it enhances understanding of biological effects across modalities, enabling risk reduction and treatment optimization.12-14 Recent advances in multimodal and automated-driven approaches—such as deep learning–based dose prediction—have significantly improved estimation accuracy and expanded clinical applicability.15,16 During radiological emergencies, rapid, high-throughput biodosimetry is essential for effective triage and medical decision-making.4,12
Despite progress, key challenges remain in automation, standardization, and throughput.17,18 Semi-automated chromosomal aberration analysis is widely promoted but lacks domestic technical standards and still depends heavily on expert review.19,20 This gap is explicitly documented by Zhao et al., who identified inconsistencies and outdated provisions in China’s current biological dosimetry standards framework, 21 underscoring the urgency of standardized, automated solutions like ours. Prior studies highlight persistent limitations: Amicis et al. found semi-automated systems required extensive manual correction for complex aberrations, while Lee et al. noted high sensitivity but non-negligible false positives.7,21 Our fully integrated platform (Chromprep + Metafer 4 + LS-CAS) addresses these gaps by achieving end-to-end automation with minimal intervention.4,22 It processes ∼20,000 valid cells per dose point—far exceeding conventional counts (<1,000 cells)—and delivers calibration curves with excellent fit (R2= 0.997 for dicentrics; R2= 0.996 for micronuclei), comparable to or better than those from international consortia like RENEB14,22 and notably superior to the high-throughput curve reported by Bi et al. (R2≈0.99)2 21 and consistent with the precision of molecular cytogenetic benchmarks such as Meher et al.1,23
The robustness of our system is further supported by stringent quality control metrics and external benchmarking. As shown in Table 2, both the Metaphase Index and Nuclear Division Index exhibited expected dose-dependent declines, consistent with established radiobiological responses. 24 Moreover, the dicentric frequencies at 0 Gy and 1 Gy align closely with those reported by Subramanian et al. and Jang et al. using comparable automated platforms,24,25 as summarized in Supplementary Table 2.7,17,18,23-25 This external concordance reinforces the biological plausibility and reliability of our calibration curve.
To contextualize performance, we benchmarked our system against recent literature. Dicentric detection sensitivity (96.2 per 100 cell at ≥1 Gy) aligns with Repin et al. (2021) (Cytometry A), though our pipeline analyzes unfiltered whole slides rather than pre-selected metaphases. 15 The false-positive rate (∼3.8%) falls within ranges reported for CytoVision and MetaSystems platforms in RENEB evaluations.7,26 Throughput (∼20,000 cells in <4 h) surpasses manual methods (<500 cells/h) and matches AI-enhanced efforts like De Amorim et al.14,15,27 However, consistent with Blömeke et al., our system shows reduced sensitivity for complex rearrangements—a known limitation of image-based classifiers. Importantly, our baseline aberration frequencies and low-dose response closely match historical controls from occupationally monitored populations, 28 confirming biological plausibility and assay fidelity—key advantages over systems lacking validation against real-world exposure contexts. This is acceptable in emergency triage, where rapid, reproducible dose estimates over 0–5.00 Gy is prioritized per IAEA guidelines.12,26
Our standardized workflow unifies dicentric and micronucleus assays in one pipeline, enabling complementary dose assessment across the full 0–5.00 Gy range, as recommended by the IAEA.4,12 Validation using blinded ex vivo samples (0.40–4.10 Gy) confirmed that all automated dose estimates fell within the 95% confidence intervals of true doses, meeting IAEA criteria for emergency use. Although automated aberration rates differ from manual scoring—particularly for dicentrics below 1.00Gy—the systematic error is stable, and inter-assay variability is lower than manual preparation. 26 These results demonstrate the feasibility of a high-throughput, fully automated biodosimetry laboratory, laying a practical foundation for future standardization and large-scale deployment.
Limitations
Our study has several limitations. First the automated system, based on commercial rule-based algorithms, shows reduced sensitivity for complex chromosomal aberrations and exhibits slight systematic differences from manual scoring at low doses (<1.00 Gy). Second calibration and validation relied on blood from only four healthy donors and ex vivo γ-ray, limiting generalizability to diverse populations or real-world exposure scenarios. Third, the workflow depends on specific proprietary instrumentation, which may affect accessibility in resource-limited settings. Finally, quality assurance parameters—especially cells scored per dose point—are inadequate for robust low-dose estimation. With ∼1,500 cells analyzed per dose, low doses (<1 Gy) need more cells for statistical reliability (aberration frequencies near background levels), limiting estimate precision and posing a key methodological shortcoming for future protocols.
Conclusions
This study validates a robust quadratic dose-response relationship for the induction of dicentric chromosomes and micronucleus in human peripheral blood lymphocytes following in vitro 137Cs γ-ray irradiation, across a dose range of 0–5.00 Gy. The developed calibration curves not only accurately predict radiation doses in blinded validation samples but also demonstrate high sensitivity for both micronucleus (98.46%) and dicentric chromosome detection (98.34%), despite slightly lower absolute accuracy for complex dicentric chromosomes. By integrating Chromprep, Metafer 4, and LS-CAS platforms, our work pioneers a fully automated workflow from sample preparation to aberration scoring, achieving high-throughput analysis with consistent performance metrics. This represents the first comprehensive validation of an integrated biodosimetry pipeline against ex vivo irradiations within a clinically significant dose range, highlighting its potential for practical applications in radiation dose assessment.
Supplemental Material
Supplemental Material -High-Throughput Automated Construction and Validation of Dicentric Chromosome and Micronucleus Biodosimetry Calibration Curves for Radiation Emergency Response
Supplemental Material for High-Throughput Automated Construction and Validation of Dicentric Chromosome and Micronucleus Biodosimetry Calibration Curves for Radiation Emergency Response by Mengyun Wu, Haojun Li, Huadong Zhang, Wei Li, Yeqing Gu in Dose-Response
Footnotes
Acknowledgement
The authors would like to express their gratitude to the following individuals and institutions for supporting this study. The volunteers who participated in blood sample donation, without whom this research would not have been possible. The Chongqing Center for Disease Control and Prevention and the Institute of Radiation Medicine, Chinese Academy of Medical Sciences, for providing laboratory facilities and technical support for in vitro irradiation and automated detection.
Author Contributions
Mengyun Wu and Haojun Li contributed to study implementation and manuscript drafting; Wei Li: technical guidance; Huadong Zhang contributed to manuscript revision; Wei Li and Yeqing Gu: contributed to the study conception and design, and manuscript revising. All authors approval of the final version of the manuscript.
Funding
The authors disclosed receipt of the following financial support for the research, authorship, and/or publication of this article: This work was supported by the Chongqing Science and Technology Bureau and Health Commission Joint Medical Project (2022ZDXM034) and Tianjin Health Research Project (TJWJ2025MS054).
Declaration of Conflicting Interests
The authors declared no potential conflicts of interest with respect to the research, authorship, and/or publication of this article.
Supplemental Material
Supplemental material for this article is available online.
References
Supplementary Material
Please find the following supplemental material available below.
For Open Access articles published under a Creative Commons License, all supplemental material carries the same license as the article it is associated with.
For non-Open Access articles published, all supplemental material carries a non-exclusive license, and permission requests for re-use of supplemental material or any part of supplemental material shall be sent directly to the copyright owner as specified in the copyright notice associated with the article.