
Abstract
To establish a complete technical solution for the automatic radiation biological dose estimation platform for biological dose estimation and classification of the wounded in large-scale radiation accidents, the “dose–effect curve by dicentric chromosome (DIC) automatic analysis” was established and its accuracy was verified. The effects of analyzed cell number and the special treatment of the culture on dose estimation by DIC automatic analysis were studied. Besides, sample processing capabilities of the special equipments were tested. The fitted “dose–effect curve by DIC automatic analysis” was presented as follows: Y = (0.01806 ± 0.00032) D 2 + (0.01279 ± 0.00084) D + (0.0004891 ± 0.0001358) (R 2 = 0.961). Three-gradient scanning method, culture refrigeration method, and interprofessional collaboration under extreme conditions were proposed to improve the detection speed, prolong the sample processing time window, and reduce the equipment investment. In addition, the optimized device allocation ratio for the automatic biological dose estimation laboratory was proposed to eliminate the efficiency bottleneck. The complete set of technical solutions for the high-throughput automatic biological dose estimation laboratory proposed in this study can meet the requirements of early classification and rapid biological dose assessment of the wounded during the large-scale nuclear radiation events, and it is worthy of further promotion.
Keywords
Introduction
It is urgent to make the dose estimation after the occurrence of large-scale nuclear radiation events. In a short period of time, there will be a large number of suspected victims in need of confirming whether they are exposed to radiation as well as the exposure dose. Therefore, the study of indicators for early and rapid diagnosis of radiation injury is the most important in the medical emergency of nuclear accidents. Chromosome aberration analysis is the internationally recognized gold standard for biological dose estimation for small-scale nuclear radiation incident. However, there are 3 technical barriers for large-scale nuclear radiation event: (1) only 2 samples can be analyzed by each technician in 1 day, and 8 samples can be analyzed even though only 50 cells were analyzed for each sample; (2) it is very time-consuming to collect a large number of high-resolution images by automatic scanning analysis system, which also requires a large amount of equipments; and (3) chromosome aberration analysis technology demands immediate sample processing when cells finish the first mitosis, so a large scale of samples need to be processed in such a narrow time window.
Automation dicentric chromosome (DIC) analysis has been achieved by Vaurijoux and his colleagues through establishing the dose–effect curve for automatic DIC analysis, and the analysis time was greatly reduced. 1 However, how to further save the time of biological dose estimation for large-scale nuclear radiation events, to reduce manpower input, as well as to increase the sample processing efficiency, is still worth further study. This study attempts to solve the technical obstacles of application of biological dose estimation technique in large-scale nuclear radiation incidents from the aspects of distortion analysis, sample processing, equipment configuration, scanning strategy, and so on. It is intended to provide a package of overall solutions by building a rapid high-throughput laboratory for automatic biological dose estimation from both hardware and software, by which 3 objectives are supposed to be achieved: (1) quick response to large-scale nuclear radiation incidents all over the world; (2) establishment of fast classification diagnosis technology module for the dose of suspected victims exposed to radiation; and (3) providing decision support for public health and dosimetric evaluation for irradiated personnel.
Materials and Methods
Blood Sample Collection
Peripheral blood samples were collected from 3 healthy volunteers for automatic analysis of DIC dose–effect curve preparation. Another 20 peripheral blood samples from healthy volunteers were collected for verification of dose–effect curve and study of experimental influencing factors. Heparin lithium was added into all samples as anticoagulant. The study was approved by the Ethics Committee of The Second Affiliated Hospital of Soochow University and the 23 volunteers who donated peripheral blood signed the informed consent.
Irradiation Conditions
The blood samples were irradiated in International Atomic Energy Agency/World Health Organization Network of Secondary Standard Dosimetry Laboratories, Shanghai, China. The irradiation box made of 6-mm-thick Perspex was used to measure the dose rate and for 60Co γ-ray irradiation at 37°C ± 0.5°C water bath. Ten dose points (0, 0.25, 0.5, 0.75, 1, 1.5, 2, 3, 4, and 5 Gy) were set for dose–effect curve preparation. Five dose points (0.25, 0.5, 1, 2, and 4 Gy) were set for dose–effect curve verification and influencing factor study. The absorbed dose rate was 0.39 Gy/min.
Cell Culture and Chromosome Specimen Preparation
The blood samples were placed in water bath of 37°C ± 0.5°C for 2 hours after irradiation, then the lymphocytes were cultured in Roswell Park Memorial Institute 1640 culture medium containing fetal bovine serum, phytoagglutinin, 1% penicillin sodium and 100 μg/mL streptomycin, and 0.04 g/mL colchicine at 37°C in 5% CO2 in a humidified incubator (Thermo Scientific, North Carolina) for 50 hours. 2 Whole blood culture method was adopted, and the proportion of blood and culture medium was 1:10; 0.5 mL heparin lithium was added into 5 mL lymphocyte culture medium as anticoagulant. Cell suspension was prepared using a CP-II-64 automatic cell harvester (Lechen Biotechnology, Shanghai, China). Cells were subjected to hypotonic treatment by 5 mL KCl solution 2 times with 30 minutes each, then fixed 4 times with Carnoy solution for 5 minutes each. Slides were produced using a CP-AS-40 automatic slide-making machine (Lechen Biotechnology) and subjected for Giemsa staining using a CP-G-24 automatic dyeing machine (Lechen Biotechnology). The parameters of the instrument were set according to the results of the preliminary experiments. The 2 Gy group for influencing factors study was put into a refrigerator of 12°C for sample processing 24, 48, and 72 hours later after finishing cell culture.
Dicentric Chromosome Analysis
Metafer 4 (v.3.11.6) chromosome scanning and analyzing system (MetaSystems, Altlussheim, Germany) was used to search for cells in metaphase and acquire high-resolution images. The sensitivity parameter for automatic metaphase cell searching is set to 6, 3 regions were set for the search window, the 15% area proximal to tab, 35% area of the central slide, and 50% area distal to tab (Figure 1). The collected high-resolution images were subjected to DIC analysis using DCScore software (MetaSystems). The detected DIC was further confirmed by technician or Ikaros software (MetaSystems). The numbers of DIC and marked cells were recorded after the elimination of false-positive DIC. By artificial experience or using Ikaros software (MetaSystems), DIC was manually confirmed based on the following principles: (1) No count for those not hinted by software; (2) not considering whether the 46 chromosomes are complete in metaphase cells; (3) only the DICs in the main cell are counted when more than 1 cell in a high-resolution image; and (4) scattered DICs released from the broken cells are not counted. The numbers of DICs manually confirmed and the numbers of marked cells by software are recorded.
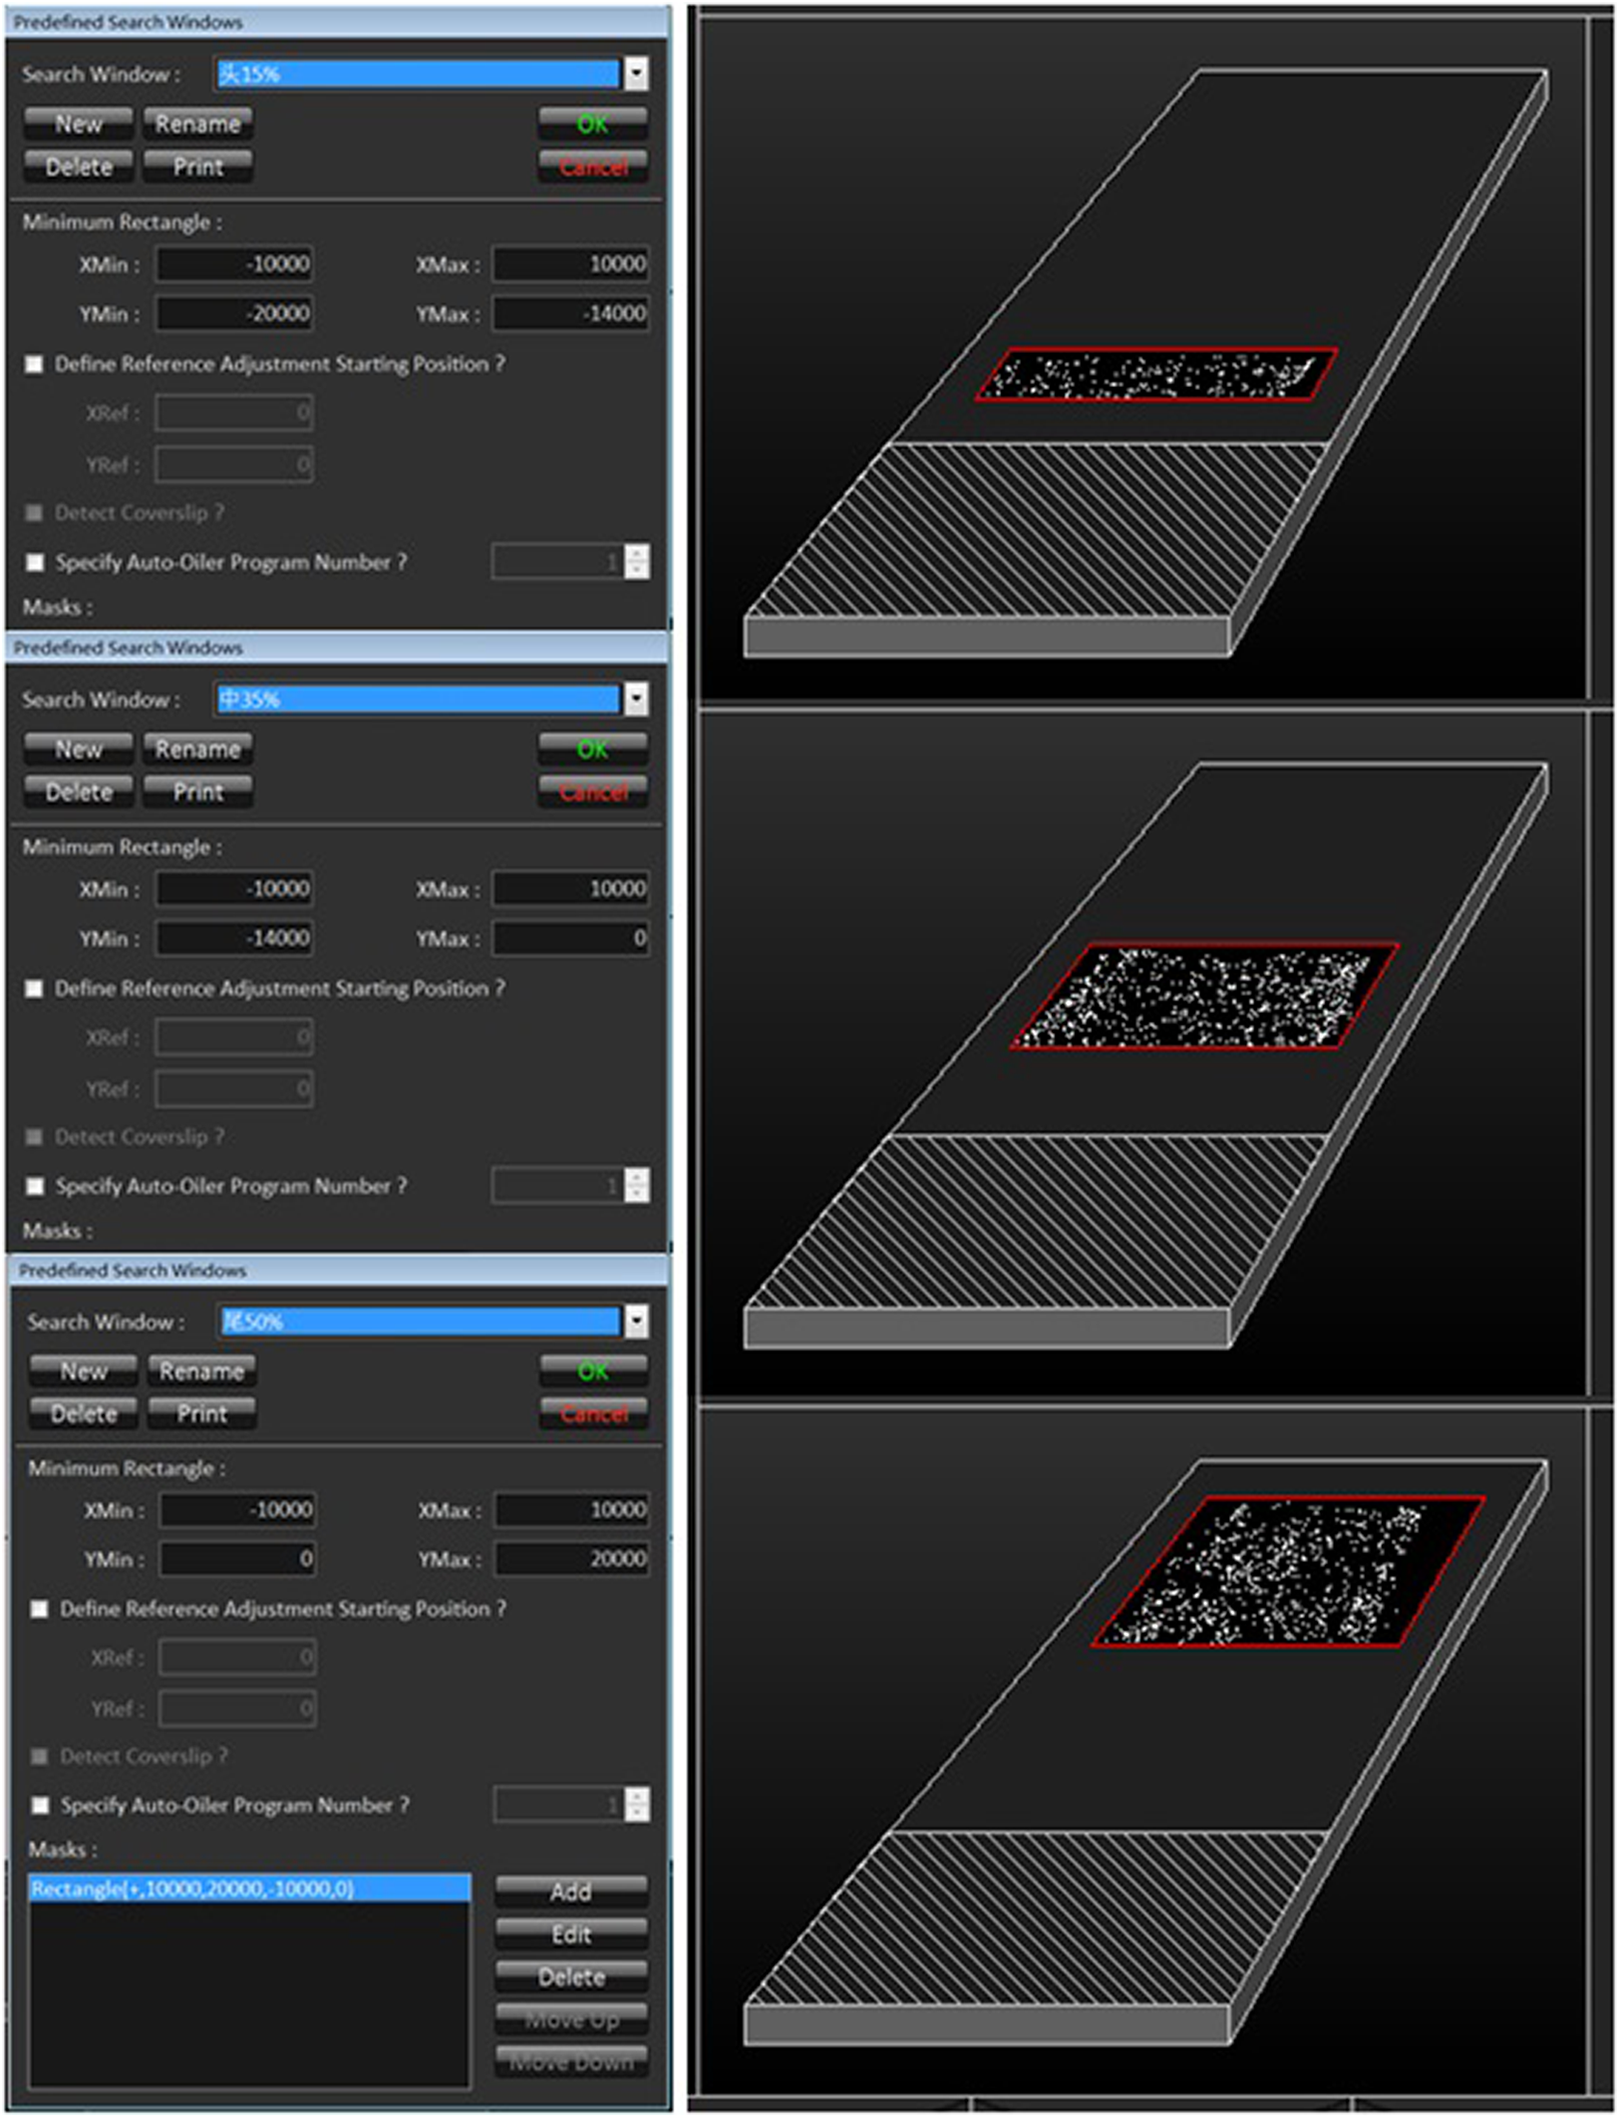
The preseted area for the search window.
Dose Estimation
CABAS 2.0 software and the “dose–effect curve by DIC automatic analysis” fitted in this study were employed to estimate the dose. 3
Statistical Analysis
MS Excel was used for correlation analysis between the estimated dose by “the DIC dose–effect curve” and the actual exposure dose, and for χ2 test to analyze the estimated dose of the cultures after special treatment.
Effective Cell Rate Analysis
The effective cell rate equals to the ratio of the number of cells captured by high-resolution chromosome automatic scanning system to the marked cell number acquired by DCScore analysis. It was calculated according to the following formula:

Results
The Fitting of “Dose–Effect Curve by DIC Automatic Analysis”
According to DIC number acquired by automatic scanning and analyzing system and confirmed by technician, as well as the marked cell number identified by DCScore software (the number of analyzed cells), the “dose–effect curve by DIC automatic analysis” was fitted as follows: Y = (0.01806 ± 0.00032) D 2 + (0.01279 ± 0.00084) D + (0.0004891 ± 0.0001358). Here, Y is the DIC number per cell that is automatically analyzed and artificially confirmed, and D is the absorbed dose (Gy). The number of cells and DICs analyzed at each dose point are shown in Table 1.
The Number of Cells and DICs Analyzed at Each Dose Point in the Fitted “Dose–Effect Curve by DIC Automatic Analysis.”

Abbreviation: DIC, dicentric chromosome.
p ± Sp= aberration rate ± standard error.
Accuracy Verification of “Dose–Effect Curve by DIC Automatic Analysis”
The dose estimation was carried out by “dose–effect curve by DIC automatic analysis” in irradiated peripheral blood samples from 20 healthy volunteers. The results showed that the deviations between estimated dose and actual exposure dose were all less than 20% (except 0.25 Gy group). The correlation coefficient R 2 is 0.961 (except 0.25 Gy group), suggesting the estimated dose was highly correlated with the actual radiation dose. The “dose–effect curve by DIC automatic analysis” can be used to estimate the biological dose accurately, and the results are shown in Tables 2 to 4 and Figure 2. However, the deviation of the 0.25 Gy dose group was 52% (6430 cells analyzed, 15 automatic DICs, and an estimated dose of 0.12 Gy).
Analysis Results of 0.5 Gy Group Were Verified Using “Dose–Effect Curve by DIC Automatic Analysis.”
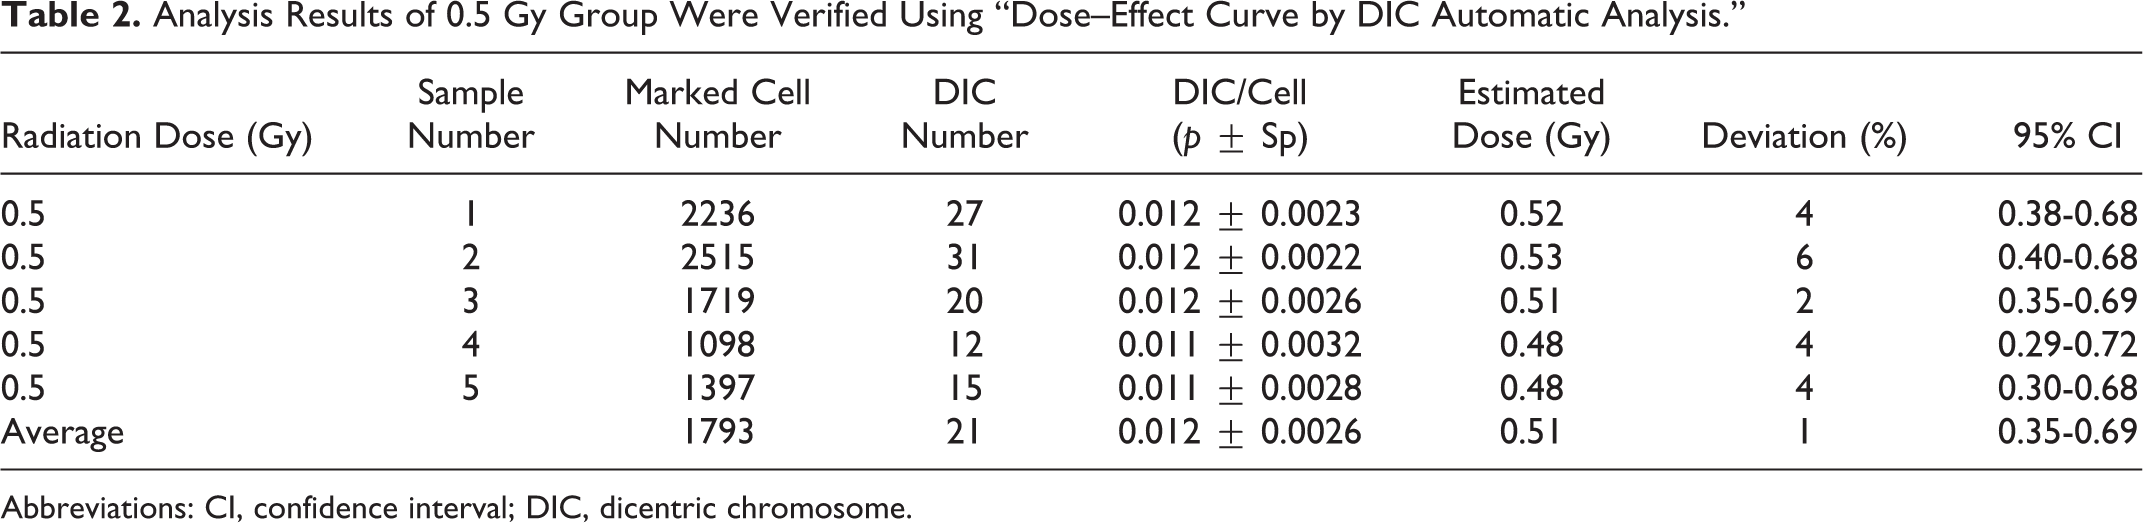
Abbreviations: CI, confidence interval; DIC, dicentric chromosome.
Analysis Results of 2 Gy Group Were Verified Using “Dose–Effect Curve by DIC Automatic Analysis.”
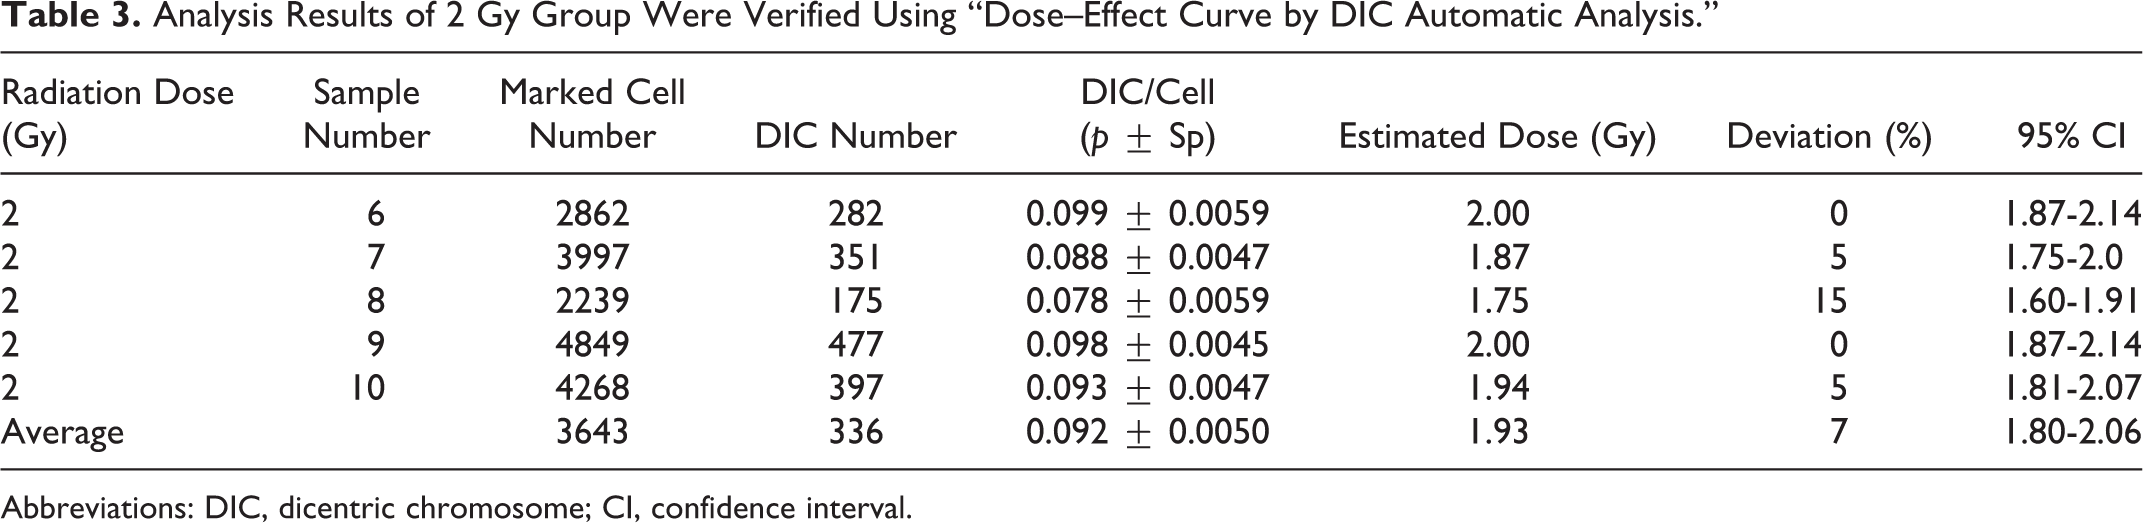
Abbreviations: DIC, dicentric chromosome; CI, confidence interval.
Analysis Results of 4 Gy Group Were Verified Using “Dose–Effect Curve by DIC Automatic Analysis.”
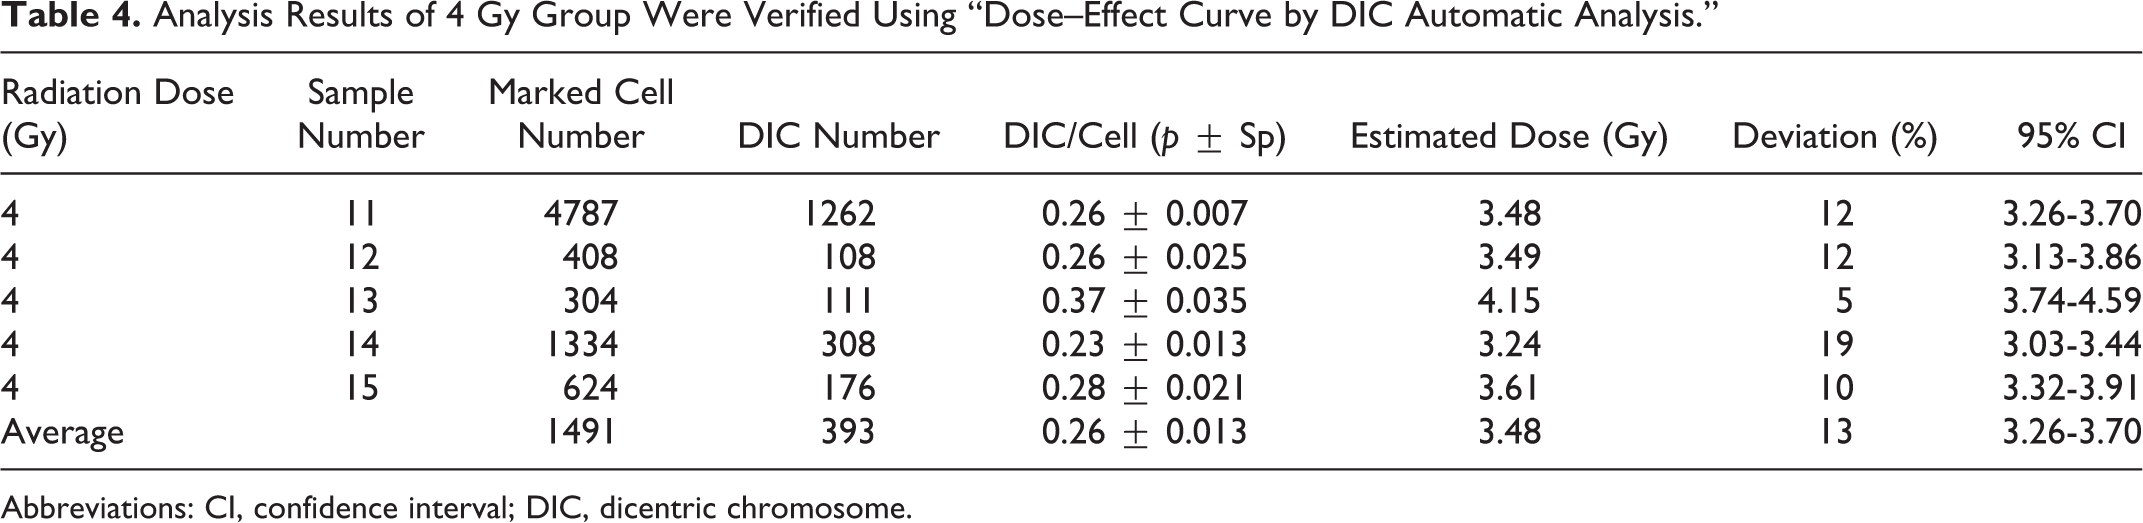
Abbreviations: CI, confidence interval; DIC, dicentric chromosome.
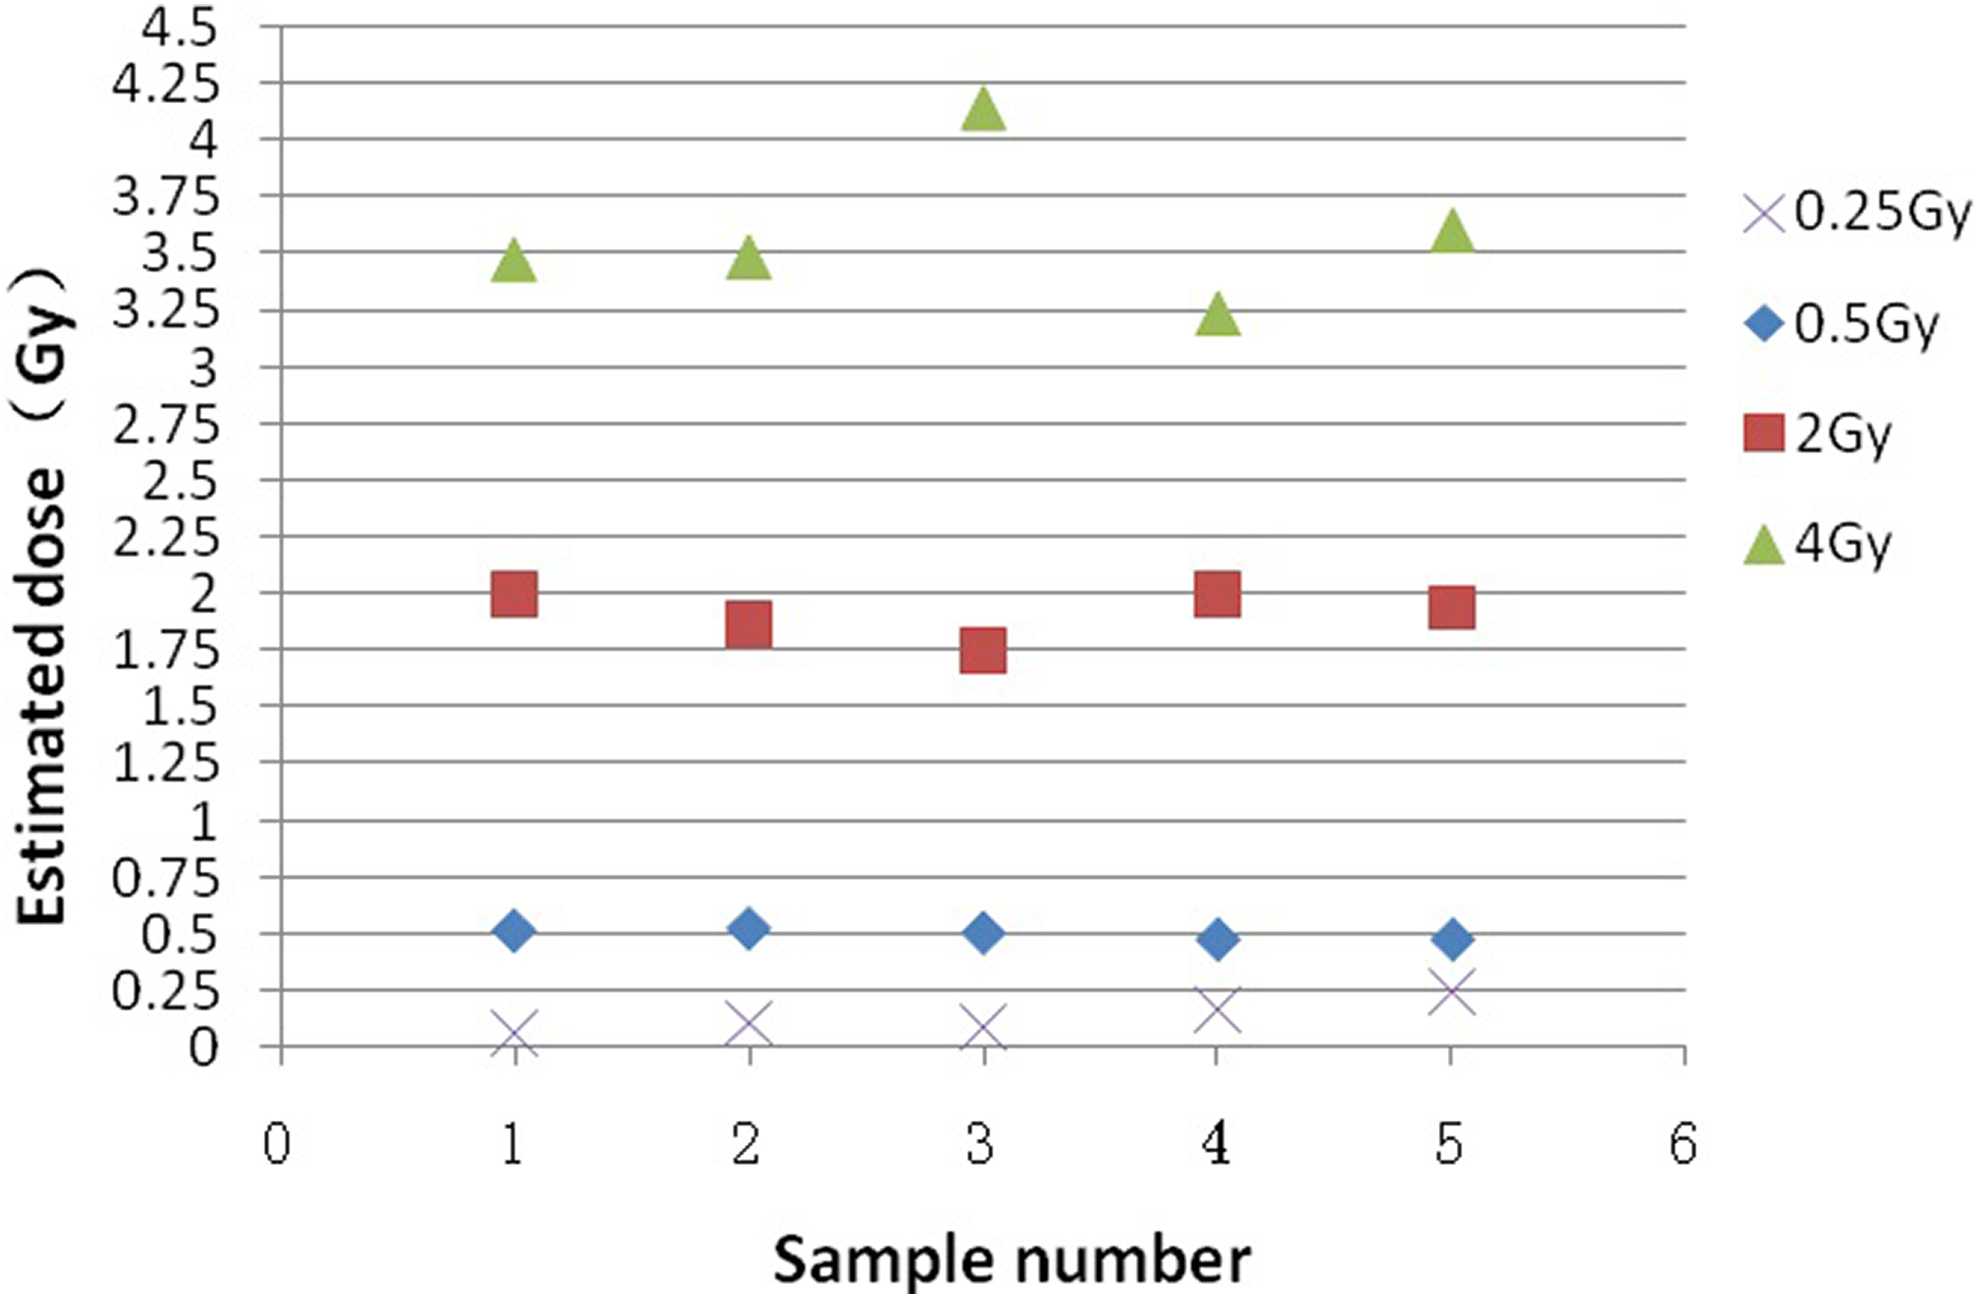
Verification results of dose–effect curve by DIC automatic analysis. DIC indicates dicentric chromosome.
The Effects of Cell Number on Biological Dose Estimation
The effect of cell number on the estimation of biological dose is shown in Table 5. In the 1 Gy group, 262 data points were analyzed for each 120 analyzed cells as 1 data point. The automatic DIC number of each data point (by manual confirmation) varied from 0 to 11. Only 1 data point has 0 DIC (0.38%). Group 1 Gy analysis showed that the qualified rate of 120 cell biological dose estimates was 51%, and the qualified rate of 960 cell biological dose estimates was 85%. In group 2 Gy, 120 cells were analyzed. The qualified rate of biological dose estimate was 61%, 960 cells were analyzed, and the qualified rate of biological dose estimate was 96%. In group 4 Gy, the qualified rate of 120 cells was 73%, and the qualified rate of 480 cells was 97%. The estimated value of 1 data point in 35 data points of 480 cells was less than 3.2 Gy, and the estimation deviation of the other data points was within the range of 480 (3.2-4.8 Gy). Therefore, it was considered that 480 cells were analyzed and the estimated values of 3.2 Gy were not required to follow. To increase the number of cells analyzed, we only need to add the number of cells to the specimens whose estimated dose is less than 3.2 Gy.
The Effects of Cell Number on Biological Dose Estimation.
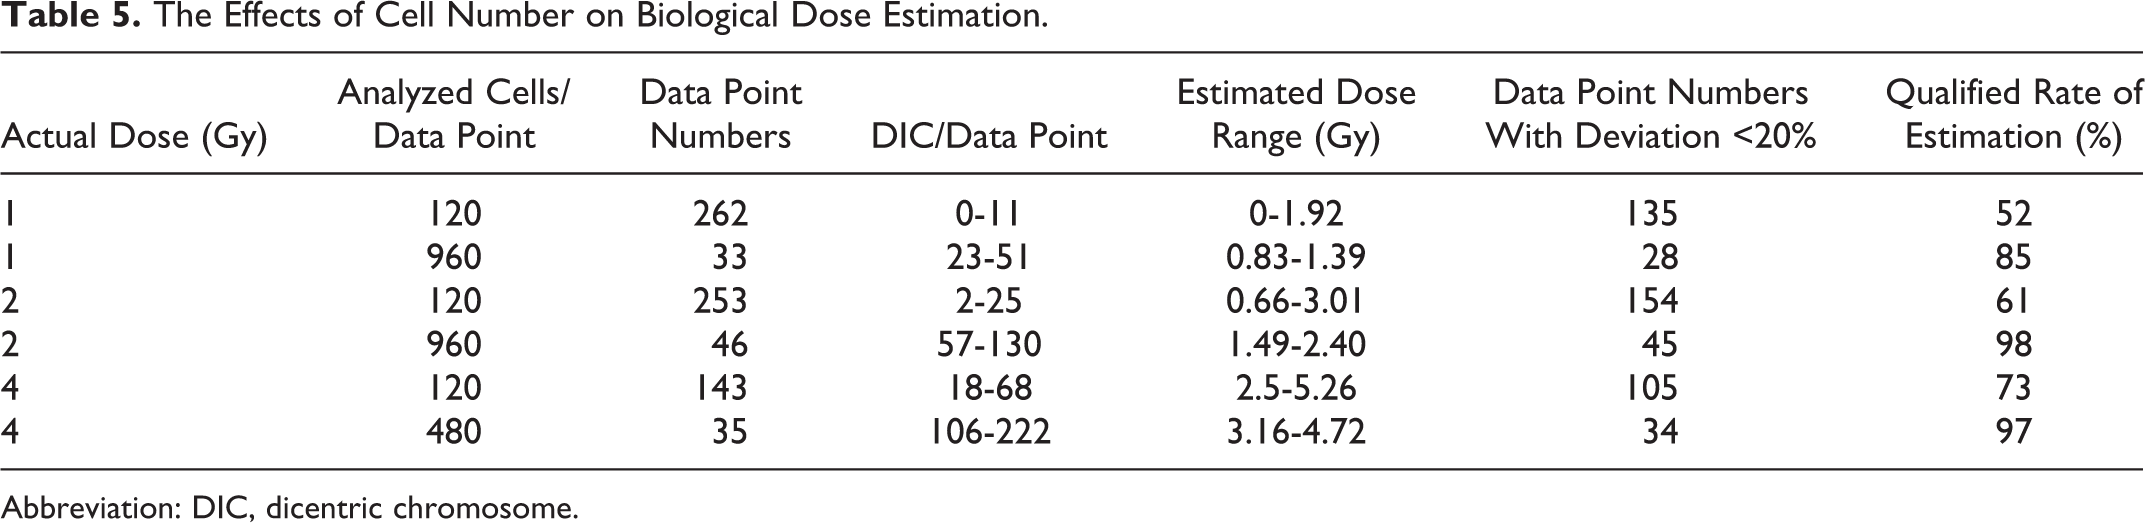
Abbreviation: DIC, dicentric chromosome.
Estimation report indicating radiation dose <1 Gy will be issued for the samples with 0 automatic DIC when 120 cells were analyzed. For the samples with automatic DIC number >1, dose estimation will be conducted when the analyzed cell number reaches 480 based on the original analysis of 120 cells. Estimation report will be issued if the estimated dose is more than or equal to 3.2 Gy. For samples with estimated dose less than 3.2 Gy, estimation report will be issued after dose estimation with additional analysis of cell number to 960 based on the analysis of 480 cells.
During the detection of the specimens for biological dose estimation for nuclear accident, the search window of the first scan for each specimen is uniformly set as the 15% area proximal to the tab, and the metaphase cell number under high-power field was set to 171 (120 metaphase cells to be analyzed). Thirty-five percent area of the central slide was set as the search window for the second scan. The number of metaphase cells was set to 514 (480 metaphase cells to be analyzed); the third scan search window was set as the 50% slide area distal to the tab, and the number of metaphase cells was set to 686 (960 metaphase cells to be analyzed). The numbers of shot cells and analyzed cells are increased step-by-step by 3-gradient scanning method (Figure 3), which can not only meet the accuracy requirements of biological dose estimation but also increase the analyzing speed and reduce the investments of the automatic scanning and analyzing system. The effects of cell number on biological dose estimation are shown in Table 5.

The 3-gradient scanning method.
Effects of Culture Refrigeration on Metaphase Cells and Biological Dose Estimation
After the culture was finished, the samples were refrigerated for 24, 48, and 72 hours, respectively, before sample processing and biological dose estimation. The samples were processed, and the biological dose was estimated respectively. The results are shown in Table 6. Neither estimated dose values (χ2 = .006, P = .99988, P > .05) nor effective cell rates (χ2 = .226, P = .97329, P > .05) showed significant difference between groups. It was implicated that refrigeration of 24 to 72 hours at the end of culture will not affect biological dose estimation.
Effects of Culture Refrigeration on Biological Dose Estimation.

Abbreviation: DIC, dicentric chromosome.
Effective Cell Rate Analysis
Some of cell images acquired by automatic scanning and analyzing system were not suitable for analysis due to poor shape. DCScore software can automatically identify cell images not suitable for analyzing. The number of metaphase cells should be increased based on the number of cells to be analyzed according to the effective cell rate when setting the number of metaphase cells to be shot under the high-power field. DCScore software can automatically identify unqualified cells for analysis. By observing the range of effective cell yield in our laboratory, the number of cells to be shot at high magnifications can be calculated based on the number of cells to be analyzed. The effective cell rate range automatically identified by the software was 72% to 90% through statistics data of 200 samples in our laboratory.
When the software sets the number of cells to be acquired at high magnifications, it is necessary to increase the number of cells based on the number of cells to be analyzed according to the effective cell rate. For example, we want to analyze 120, 480, and 960 cells while the number of cells to be photographed at high magnifications set by software is 171, 686, and 1371, respectively. Then our formula is as follows: number of cells to be photographed at high magnifications = number of cells to be analyzed/70%.
Sample Processing Capacity of Laboratory for Automatic Biological Dose Estimation
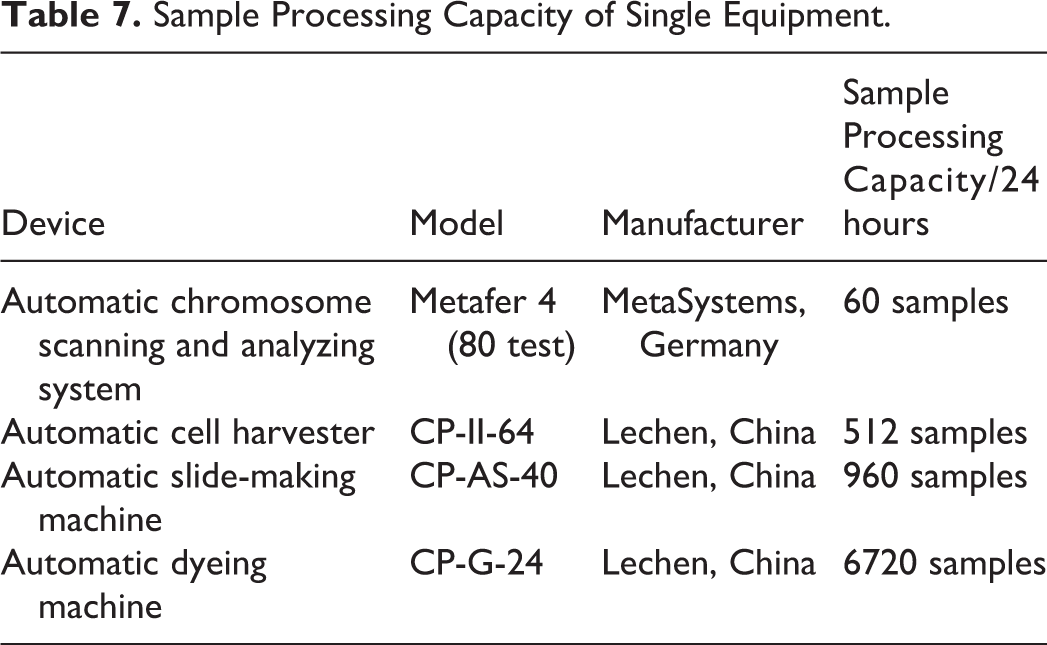
The capability of single equipment for sample processing of automatic biological dose estimation laboratory is shown in Table 7. It can be seen that the major restrictive factor for the sample processing is the automatic chromosome scanning and analyzing system, which should be configured as many as possible. The initial allocation ratio of 4 devices for automatic biological dose estimation laboratory is speculated to be: automatic chromosome scanning and analyzing system:automatic cell harvester:automatic chip making machine:automatic staining machine = 3:2:1:1. Slide Feeder and Bar Code Reader of the automatic chromosome scanning and analyzing system must be configured to realize continuous automatic sampling.
Sample Processing Capacity of Single Equipment.
Discussion
The experiment results showed that the “dose–effect curve by DIC automatic analysis” obtained in this study is ideal for dose estimation, except for 0.25 Gy dose group with a deviation of 52%. It is speculated that the “dose–effect curve by DIC automatic analysis” may not be suitable for estimating the doses ≤0.25 Gy, or more cells are needed for analysis for doses ≤0.25 Gy. Besides, the deviations of 5 samples at 4 Gy dose point were all less than 20%, meeting the accuracy requirement of biological dose estimation, but 95% confidence interval (CI) failed to cover the actual exposure values. This may be caused by the Poisson error of DIC and the error of calibration curve. 4 Romm et al reported that 95% CI became so small that the number of radiation dose values covered by 95% CI decreased when routine methods were used to analyze 1000 metaphase cells. 3 Whether the causes are similar needs further study. 5
Automatic biological dose estimation was realized by the use of “dose–effect curve by DIC automatic analysis.” The step that removal of cells with second division or undesirable morphology artificially was skipped to further improve the degree of automation by both taking use of DCScore software to identify cell morphology and adding colchicine at 0 hour to prevent further cell division. We put the data verified by our dose–effect curve into the dose–effect curves of automatic DIC analysis established by Vaurijoux and Grual for dose estimation, 1,6 the dose estimation deviations for 0.25, 0.5, 2, and 4 Gy groups were 40% and 67%, 14% and 6%, 5%, and 3%, and 17% and 11%, respectively. The results are in accordance with ours. Except for 0.25 Gy group, the deviations of the other groups were within the range of ±20%. It is suggested that the accuracy of the dose–effect curves is comparative although the sample preparation methods and analytical methods are different in 3 laboratories.
The establishment and application of the “dose–effect curve by DIC automatic analysis” solve the problem of analysis speed. However, the automatic chromosome scanning and analyzing system takes a lot of time to scan and shoot high-resolution digital images of chromosome. The proposed 3-gradient scanning method in this study improves detection speed and reduces equipment investment through reducing the number of photographed images when ensuring the detection accuracy. The results showed that when 120, 480, and 960 cells were analyzed, deviations of 85% samples in 1 Gy group and 97% to 98% samples in 2 Gy and 4 Gy groups are less than 20%. The estimations with deviation >20% didn’t affect the clinical grading. In our 3-gradient scanning method, 480 and 960 cells were analyzed on demand, in which accurate dose estimations of irradiations <1 Gy and local exposure were given up, and 3.2 Gy was used as the demarcation point. Romm et al reported that the automatic analysis of 150 cells can provide information similar to that achieved by manual analysis of 50 cells. 7 Gruel et al reported the automatic analysis of 300 to 400 cells had no obvious difference from manual analysis of 50 cells. They suggested at least 1000 cells should be analyzed for the sorting of the wounded and 3000 cells for the patients exposed to low-dose irradiation or suspected local irradiation. They also put forward the concept of gradient scanning. 6 Our results are similar to those from Romm. Victims of large-scale nuclear radiation accidents consist of the nonirradiated, mildly, moderately, and severely irradiated persons. There is no need to analyze 1000 cells for all samples. The analysis can be subjected to gradient scanning starting from 50 cells close to the artificial accuracy according to the result of preliminary analysis of 120 cells. A study of Willems et al showed that it is important to quickly distinguish the seriously exposed victims (≥1 Gy) from the mildly irradiated ones for early medical treatment and follow-up in the large-scale nuclear emergency situations. 8 Another study found that only those who received the equivalent whole-body dose of 1.5 Gy need medical intervention. 9 According to the principle of ISO 19238, it is allowed for biological dose estimation to deviate from the precise value to a certain extent in order to meet the needs of rapid response. 10 Therefore, it is reasonable to issue estimation reports indicating exposure dose <1 Gy for the samples without DIC (only 1 case in 262 cases of 1 Gy group) after analyzing 120 cells in our study. The cases with a dose less than 1 Gy will be screened out in the least time. The priority will be determined according to the initial screening results. The dose estimation reports of the heavily irradiated persons and the ones with no need for medical intervention will be issued firstly according to the doses from largest to smallest. The radiation distribution model after a nuclear explosion indicates that most of the radiation exposures are related to radioactive dust. 5 We believe that the large-scale nuclear radiation accidents, different from the point source accidents, are unlikely to result in a large number of local irradiation cases. Dai et al reported that a whole-body equivalent dose estimated by chromosome aberration analysis is much closer to the actual radiation dose and more instructive for clinical treatment compared with the estimated dose by use of contaminated Poisson method in the case of acute local irradiation. 11 Therefore, the biological dose estimation of large-scale nuclear radiation events may not need to increase the number of analyzed cells for samples <0.5 Gy or local irradiated ones. The metaphase cells and time used for biological dose estimation of nuclear accidents are valuable. Thus, the gradient scanning method put forward by Gruel et al was optimized in our study. The 3-gradient scanning method we designed in this study only needs 1 to 2 high-density cell slides. The workload of slide-making in large-scale nuclear accidents is reduced. Through the presetting of scanning area and the collection number of metaphase cell images, the collection of metaphase cell images on the slide won’t be repeated. The DIC data collected and analyzed separately from the same slide can be combined; thus, the metaphase cells and image acquisition time won’t be wasted. The dose estimation could be completed by multiple partitions scanning in accordance with the needs. Another study in our group found that cell density, scanning location, and repeated scanning did not affect the automatic analysis results of biological dose estimation (P > .05). Preliminary results showed that the 3-gradient scanning method developed in our lab meets the fast requirements and does not deviate from the actual doses, suitable for biological dose estimation of large-scale nuclear radiation events. Of course, if the number of samples is not much, increasing the number of analyzed cells is beneficial to improve the accuracy of dose estimation.
Chromosome biological dose estimation technology needs immediate sample processing at the end of the first mitosis. It is an obstacle for high-throughput biological dose estimation to complete the processing of large quantities of samples in such a narrow time window of cell division cycle. Although adding the colchicine may prevent cells from entering the second cycle, however, some cells will still enter the second division cycle and the chromosomes will be shortened so that the DIC analysis is influenced when the culture time is longer than 54 hours. 1 After trying a variety of methods, we finally found that refrigeration at the end of the culture makes the cells stop dividing and keeps the chromosomes from being shortened, buying sample processing time of 72 hours (or more) and solving the problem of narrow time window in mass biological dose estimations.
Biological dose estimation by automatic scanning and analyzing system and “dose–effect curve by DIC automatic analysis” doesn’t require manual intervention in the whole course except for DIC recognition. A high-throughput automatic biological dose estimation laboratory only needs to be equipped with a few full-time technicians. When the accident occurs, temporary transfer of nonprofessional personnel can complete fast and high-throughput biological dose estimation.
For the chromosome biological dose estimation in the large-scale nuclear radiation accidents, the international general practice is to establish a network of laboratories, and blood samples will be distributed to each laboratory for detection. Chromosomal biological dose estimation technology requires saving the cell viability, thus demanding high levels of blood transport conditions and timeliness. Sample distribution increases the possibility of experiment failure. The establishment of rapid high-throughput biological dose estimation laboratory can reduce the circulation of blood samples. The chromosome sample preparation is a multifactor event, and the quality of the slide-making directly affects the accuracy of DIC automatic analysis. Centralized production of slides in a large high-throughput automatic biological dose estimation laboratory is conducive to ensuring the quality of slide-making. In extreme cases, rapid amplification of cell image acquisition ability of the automatic chromosome scanning and analyzing system could be achieved through collaborations across the country. This is because the automatic chromosome scanning and analyzing system is not only used in radiation biology but also widely used in the fields of clinical cytogenetics and cytogenetics of hematologic tumors. The chromosome automatic image acquisition module in the 3 applications is exactly the same. Sample slides will be sent to relevant laboratories to acquire chromosome images, and the high-magnification images will be sent back to the center lab through the network for DIC automatic analysis and dose calculation. The transport of slides is more convenient and safer than the transport of blood samples.
Acute phase of moderate-to-severe acute radiation sickness occurred in 20 to 35 days after irradiation. It is thought that the biological dose estimation report should be issued before the acute phase, maybe less than 14 days. After the blood samples arrive at the laboratory, it will take 4 days for sample culture and processing. Thus, only 10 days for automatic chromosome scanning and analyzing system to scan the cell images. The initial dose screening of 1800 samples can be completed in 10 days by 3 automatic chromosome scanning and analyzing systems (171 high-magnification images collected in each sample and 120 cells analyzed). The initial allocation ratio of 4 devices for automatic biological dose estimation laboratory is speculated to be: automatic chromosome scanning and analyzing system:automatic cell harvester:automatic chip making machine:automatic staining machine = 3:2:1:1.
Rapid high-throughput automatic biological dose estimation laboratory should be set up in the units with health examination qualification for radiation workers. Large quantities of reagents, personnel, technology, and equipments should be kept in good condition. In case of a large-scale nuclear radiation accident, the laboratory can quickly respond. Only 3 to 4 mL of peripheral blood needed for analysis in 48 hours, rapid dose evaluation can be conducted for the suspected irradiated personnel. Authoritative advice containing biological dose and radiation damage classification will be provided, supporting medical and public health decisions. Three goals are to be realized through the application of the automatic biological dose estimation laboratory: (1) fast response to the radiation events all over the world; (2) establishment of the technology module of radiation dose evaluation and treatment; and (3) supporting medical and public health decision.
There are 2 methods to evaluate the biological dose estimation accuracy, one is whether the 95% CI of estimated doses covers all radiation dose points, and the other is whether the deviation of the estimated dose from radiation dose is less than 20%. 5 According to our observations, the 95% CI will change with the analyzed cell number. A higher qualified rate of dose estimation may associate with fewer analyzed cells. Referring to the second method, estimated dose is independent of analyzed cell number, more suitable to methodology studies.
In this study, we put forward the 3-gradient scanning method, culture refrigeration method, marked cell labeling method, and interprofessional collaboration under extreme conditions. This technical scheme can meet the requirements of fast and accurate biological dose estimation in large-scale nuclear radiation accidents, providing a package solution of practical value for the rapid high-throughput biological dose estimation. In the future, it is necessary to further confirm the feasibility of this technical scheme through increasing the sample size for the 3-gradient scanning method, increasing the dose points for culture refrigeration method, as well as using the large batch specimens to simulate biological dose estimation of large-scale nuclear accidents. An ideal biological dosimeter is characterized by dose–effect relationship, low individual difference, and early availability of results, reflecting local irradiation, long duration of indicators, noninvasiveness, and automation. Rapid high-throughput automatic biological dose estimation laboratory is probably an ideal biological dosimeter and can be used as a high-throughput screening tool for dose evaluation in large nuclear radiation events.
Footnotes
Authors’ Note
Hong Dai and Junchao Feng contributed equally to this work.
Declaration of Conflicting Interests
The author(s) declared no potential conflicts of interest with respect to the research, authorship, and/or publication of this article.
Funding
The author(s) disclosed receipt of the following financial support for the research, authorship, and/or publication of this article: This work was supported by Jiangsu Health and Family Planning Commission Preventive Medicine Research Projects in 2014-2015 (no. Y2015024), the National Natural Science Foundation of China (no. 11405235), and Co-construction State Key Laboratory of Radiation Medicine and Protection (no. BM201727).