
Abstract
Background
Post-traumatic joint contracture (PTJC), characterized by progressive fibrosis, is a frequent complication following joint injury. Nevertheless, the molecular mechanisms driving its progression remain elusive. To address this, our study aims to delineate the dynamic transcriptomic alterations during arthrofibrosis development and to identify potential biomarkers associated with PTJC.
Methods
A rat model of PTJC was established, and RNA sequencing was performed on joint capsules at 0, 3, 7, 14, and 28 days post injury. We then applied Mfuzz time-series clustering, WGCNA, KEGG pathway enrichment analysis, and PPI networks to pinpoint key genes and pathways involved. Cross-species validation was conducted using human transcriptomic data from the GSE135854 dataset.
Results
Progressive joint stiffness and fibrosis were observed, peaking at 28 days post-injury. Transcriptome analysis identified 1385 differentially expressed genes (DEGs). KEGG analysis revealed significant enrichment in processes such as “extracellular matrix (ECM)-receptor interaction,” “focal adhesion,” “cyclic Guanosine Monophosphate - Protein Kinase G (cGMP-PKG) signaling,” and “vascular smooth muscle contraction”. By integrating rat and human data, we identified COL4A3, COL4A6, COL4A5, and ITGA8 as consistently upregulated hub genes. Their elevated expression in fibrotic joint tissues was further validated using RT-qPCR and immunohistochemistry (IHC).
Conclusion
This study provides a comprehensive transcriptomic landscape of PTJC progression and highlights COL4A3/COL4A6/COL4A5 and ITGA8 as promising biomarkers and therapeutic targets for arthrofibrosis.

Keywords
Introduction
Post-traumatic joint contracture (PTJC) is a prevalent and debilitating sequela of joint trauma or orthopedic surgery that poses a major challenge in clinical rehabilitation. This condition is characterized by excessive arthrofibrosis and intra-articular adhesion formation, which lead to persistent joint stiffness, pain, and severe functional impairment, thereby significantly hampering patient recovery and quality of life.1-3 Current management strategies remain largely unsatisfactory. It is estimated that up to 15% of patients eventually require surgical release; however, approximately 20% of these individuals experience recurrence of adhesion and contracture.4,5 This high recurrence rate underscores the limitations of interventions that merely address the mechanical symptoms and highlights the critical need to elucidate the underlying molecular drivers of PTJC progression.
The pathogenesis of PTJC follows a well-defined, time-dependent course. In the initial stages, intra-articular synovial inflammation, congestion, and edema are predominant. These acute changes subsequently evolve into synovial hyperplasia, progressive fibrosis, and the formation of hypertrophic scar tissue.6-8 Ultimately, these processes lead to joint capsule thickening, joint space narrowing, and in some cases, ectopic ossification, resulting in a severe loss of both active and passive range of motion (ROM).9-11 Notably, the posterior joint capsule is particularly susceptible to these adhesive and fibrotic changes, serving as a primary contributor to persistent contracture.10,12,13 Although previous studies, including our own work with a rat PTJC model, have documented histological features such as inflammatory infiltration, collagen fiber disorganization, and upregulation of pro-fibrotic proteins,6,14 the dynamic gene expression programs and global molecular networks that orchestrate this fibrotic cascade over time remain largely unexplored.
Consequently, a critical gap exists in our understanding of the systemic and dynamic molecular landscape of PTJC. Identifying the key regulatory genes and pathways that drive the transition from acute inflammation to irreversible fibrosis is essential for developing targeted diagnostic and therapeutic strategies.
To address this, we employed an unbiased transcriptomic approach to delineate the molecular chronology of arthrofibrosis. A rat PTJC model was established and RNA sequencing (RNA-seq) was performed on joint capsules across a critical time course (0, 3, 7, 14, and 28 days post-injury). This dynamic dataset was subjected to a comprehensive bioinformatic interrogation, including Mfuzz time-series clustering, weighted gene co-expression network analysis (WGCNA), and Kyoto Encyclopedia of Genes and Genomes (KEGG) pathway enrichment analysis, to identify gene expression patterns and modules tightly correlated with disease progression.15-19 The core genes (hub genes) derived from these analyses were further validated using an independent human transcriptome dataset (GSE135854) from patients with knee arthrofibrosis. The overarching goal of this study was to map the molecular signature of PTJC development and to identify robust, cross-species validated biomarkers with potential diagnostic and therapeutic value.
Materials and Methods
Animals
In this study, adult male Sprague–Dawley (SD) rats (180-220 g) were purchased from Shanghai SIPPR-Bk Experimental Animal Co, Ltd, and raised in the specific pathogen-free (SPF) experimental animal facility of Shanghai Jiaotong University. All animal experiments complied with the “Guidelines for the Care and Use of Experimental Animals” (NIH NO. 8023, revised in 1978). The animal experimental protocol was reviewed and approved by the Animal Ethics Committee of Shanghai Jiao Tong University (Study Protocol No: A2024377-002). All methods were carried out in accordance with relevant guidelines and regulations. This study was carried out in compliance with the Animal Research: Reporting of In Vivo Experiments (ARRIVE) guidelines. The entire experimental workflow spanned from June 2024 to May 2025.
We randomly divided the rats into five groups (n = 4 in each group), the preoperative group (JC_0D as the control group) and the postoperative group, namely, the JC_3D, JC_7D, JC_14D and JC_28D groups. All rats were housed in separate cages at room temperature (23 ± 1°C) with a 12-hour light/12-hour dark cycle and free access to food and water.
Inclusion/Exclusion Criteria
Inclusion criteria of the animals include: (1) Weight of animals (rats) was in the range of 180-220 g and the strain was Sprague–Dawley. (2) Animals with normal knee joint mobility before surgery. (3) Animals were healthy and free of any underlying diseases.
Exclusion criteria of the animals include: (4) Animals with pre-existing joint diseases, skeletal deformities, or motor dysfunction. (5) Animals with signs of severe postoperative infection, wound dehiscence, or inflammation unrelated to the experimental design. (6) Animals with tumors or cancer.
Establishment of the Rat PTJC Model
The PTJC model was established as described earlier. Briefly, the animals were anesthetized with a mixture of Zoletil 50/dexmedetomidine hydrochloride (50 mg/kg) for intraperitoneal injection. The right knee joint of each rat was shaved, and the skin was disinfected. Before performing lateral patellofemotomy, a 15 mm midline skin incision was made. The patella was flipped inward to expose the femoral condyle. A 1.5 mm electric drill was used to create two 1.5 mm cortical windows from the nonarticular cartilage areas of the medial and lateral femoral condyles. The anterior/posterior cruciate ligament was cut in sequence, and the knee was extended to −45° to destroy the posterior capsule. The knee was fixed with a 0.5 mm steel wire at a flexion angle of 135°. The muscles and skin were sutured with silk thread after patellofemoral joint reduction. After the surgery, the rats were allowed to engage in daily activities in unrestricted cages. The control group only underwent skin and muscle layer incision sugery without joint treatment. Rats were euthanized at 0, 3, 7, 14, and 28 dpi, and knee joint extension ROM was measured within 15 minutes after euthanasia. We achieved euthanasia by intravenous injection of large amounts of pentobarbital sodium (120-150 mg/kg) into rats.The posterior capsule of the joint was collected for subsequent detection and analysis. 6
Histological Analyses
Ethylenediaminetetraacetic acid (EDTA)-mediated decalcification of the knee joints of the rats was performed, and the tissues were embedded in paraffin.
Hematoxylin and Eosin Staining
A series of slices were stained with hematoxylin for 1 min, double rinsed in distilled water, differentiated in 1% hydrochloric acid alcohol, double rinsed in distilled water, and stained with eosin for 2 min (Sigma Aldrich, United States). The samples were sealed and photographed after dehydration and dewaxing.
Masson Staining
Paraffin sections were dewaxed in water, stained with hematoxylin solution for 8 min, washed, and differentiated in 1% hydrochloric acid and alcohol for 15 s before alkaline water turned blue. The sections were stained with Fuchsin solution for 5 min and washed with weak glacial acetic acid solution for 1 min. The sections were washed with phosphomolybdic acid solution for 2 min and stained with aniline blue staining solution for 2 min (Zhongshan Jinqiao, China). The samples were subjected to gradient dehydration transparently and sealed with neutral gum.
Periodic Acid Silver Metamine Staining
For Periodic acid silver metamine (PASM), the sections were incubated with periodic acid for 15 min at room temperature (25°C) and with hexamine silver working solution for 40 min at 58°C. Following PASM staining, the elastic and reticular fibers were stained black.
Immunohistochemistry
For immunohistochemistry (IHC), 5-μm paraffin sections were dewaxed in water and subjected to sodium citrate buffer (10 mM). Antigen repair was performed in a pressure cooker (pH 6.0; Boster Biological Technology, Ltd, China). Then, the tissue was blocked with 3% H2O2 to inhibit endogenous peroxidase activity. The tissue was soaked in 10% goat serum (Boster Biological Technology, Ltd, China) for 30 min and mixed with rabbit anti-alpha-smooth muscle actin (α-SMA) antibody (1:1000; Bioss Biological Technology, Ltd). Mouse anti-integrin α8 (1:500; Santa Cruz Technology, Ltd sc-365798) was incubated at 37°C for 2 h, washed with PBS, and incubated with a goat anti-rabbit IgG secondary antibody (1:100; Zhongshan Jinqiao, China) for 30 min. After washing, 3,3′-Diaminobenzidine (DAB) (Zhongshan Jinqiao, China) was used for testing. Then, the slices were rinsed with water, the nuclei were stained with hematoxylin, and the slices were placed in a gradient alcohol solution for 2 min and xylene I and II for 5 min. The slides were sealed with neutral resin. Using a light microscope (ECLIPSE 90i, Nikon, Japan), the samples were photographed for subsequent analysis.
RNA Extraction
According to the manufacturer’s instructions (Invitrogen), TRIzol® was used to extract total RNA from posterior capsule tissue, and genomic DNA was removed using DNase I (Takara). Then, RNA quality was measured using a 2100 Bioanalyzer (Invitrogen) and quantified using an ND-2000 (NanoDrop Technologies). Only high-quality RNA samples (OD260/280 = 1.86∼2.05, OD260/230 ≥ 1.71, RIN ≥7.9, 28S: 18S ≥1.0, >10 μg) were used to construct a sequencing library.
Library Preparation and Illumina HiSeq X Ten Sequencing
The RNA-seq transcriptome library was obtained from Illumina (San Diego). The TruSeqTM RNA sample preparation kit was prepared using 1 μg of total RNA. In brief, messenger RNA was isolated using oligomeric (dT) beads based on the polyA selection method and then first fragmented using fragment buffer. Second, the SuperScript Double-Stranded cDNA Synthesis Kit (Invitrogen) with random hexamer primers (Illumina) was used. Then, according to Illumina’s library construction plan, the synthesized cDNA was subjected to end repair, phosphorylation, and “A” base addition. The size of the library was selected for a 300 bp cDNA target fragment on 2% low-range super agar, and then PCR amplification was performed using Phusion DNA polymerase (NEB) for 15 cycles. After quantification with TBS380, the paired-end RNA-seq library was sequenced using an Illumina HiSeq Ex Ten sequencer (2 x 150 bp read length).
Quality Control and Differential Gene Expression Analysis
The default parameters of TopHat were used to compare paired-end clean readings with the reference genome of Rattus norvegicus (Rnor_6.0). The reference genome and gene model annotation files were downloaded from the genome website for quantifying gene abundance. To identify the DEGs between two different samples, the expression level of each transcript was calculated based on the number of transcripts per million (TPM). Then, DESeq2 v.1.24.0 was used to normalize the readings and evaluate the statistical significance of the DEGs. The following standard was used: default parameter: Benjamin and Hochberg (BH) after multiple comparisons, P adjusted<0.05&| log2FC | ≥ 2. In the initial data exploration, we constructed a principal component analysis (PCA) to directly calculate the coefficient of variation between groups in R ‘prcomp'.
Mfuzz Temporal Expression Analysis
Mfuzz is a software that studies the temporal trends of gene expression in transcriptome data with time series characteristics. It can perform soft clustering of genes with similar expression patterns, thereby revealing the dynamic patterns and functional relationships of gene sets in different groups in biology. The Mfuzz package (https://mfuzz.sysbiolab.eu/) was originally developed as a clustering method for processing gene expression or protein expression profile data. The core algorithm is based on fuzzy c-means (FCM) clustering. This algorithm is used to analyze the temporal trends of gene or protein expression in transcriptome data with time series characteristics and to cluster genes with similar expression patterns, helping to understand the dynamic patterns of these biological molecules and their relationships with function.
Weighted Gene Coexpression Network Analysis
A coexpression network was constructed using the WGCNA (version 1.47) package from R. WGCNA is an undirected weighted network. The soft threshold (β power) was determined to ensure the co-expression network approximated a scale-free topology. To determine the correlation between genes, it is necessary to calculate the Pearson coefficient for any two genes, which allows us to determine whether the expression profiles of the two genes are similar. Modular gene expression correlation analysis determines central modules, which refer to modules that are highly correlated with phenotypic data or closely related to research. After obtaining the genes of interest based on gene expression correlation, the Spearman correlation algorithm was used to determine the correlation coefficients between genes. The correlation coefficient threshold is 0.5, and the significance level is the P value (P adjusted) after BH correction ≤0.05; these values are plotted as a visual network graph. In the figure, nodes represent genes, and the connections between nodes represent the correlation between gene expression. The larger the node is, the greater the correlation between gene expression.
KEGG Pathway Enrichment Analysis
KEGG (https://www.genome.jp/kegg/) is a database jointly developed by Kyoto University and the University of Tokyo in Japan. It is a prominent reference knowledge base for the integration and interpretation of large-scale molecular datasets generated by genome sequencing and other high-throughput experimental technologies. It can be used to query metabolic pathways, enzymes (or genes encoding enzymes), products, etc., and can also query metabolic pathway information of unknown sequences through Basic Local Alignment Search Tool (BLAST) comparison. KEGG is mainly accessed through a web interface and can also be accessed through locally running Perl or Java programs, making it very convenient to use. KEGG is a comprehensive database resource that can be further subdivided into 16 major databases. Here, when the corrected P value was <.05, the KEGG pathway function was considered to be significantly enriched.
Protein‒Protein Interaction Analysis and Hub Gene Mining
This study used an online search tool (STRING database, version 10.5; https://string-db.org/) based on the extensive functionalities of whole-genome data to search for interacting genes and construct protein‒protein interaction (PPI) networks. 20 The PPI data were imported into Cytoscape v3.9.1 software, and the subset groups of the PPI network were analyzed based on the molecular complex detection (MCODE) plugin in Cytoscape. This study ranked the top five clusters based on the MCODE enrichment score, displaying the association and distribution of Hub genes in the PPI network. In addition, gene network visualization of the hub genes and important signaling pathways was performed using Cytoscape v3.9.1 software.
Real-Time Quantitative Polymerase Chain Reaction
Total RNA (2 μg/sample) and a PrimeScript RT kit (TaKaRa, Japan) were used to synthesize cDNA, and then SYBR Green PCR Master Mix (Tiagen, Beijing, China) was used for real-time reactions. The expression level of glyceraldehyde 3-phosphate dehydrogenase (GAPDH) was used as an internal control. Three replicate wells were used for all reaction samples, and the experiments were repeated three times. All primers used in this study were provided by Sangon Biotechnology Co, Ltd (Supplemental Table S1 lists the primer sequences). Amplification was performed using QuantStudio design and analysis software (Applied Biosystems), and melting curve analysis confirmed the specificity of the primers. Finally, the cycle threshold (CT) fluorescence value was determined. The researchers were unaware of the grouping of each animal and analyzed the data using the ΔΔ CT method.
Validation Analysis of the Human Knee Arthrofibrosis Transcriptome Dataset
The GSE135854 dataset, 21 which contains paired transcriptome data of human knee arthrofibrosis and nonfibrosis patients, was downloaded from the Gene Expression Omnibus (GEO) database for further validation. Venn analysis, GO-KEGG combined pathway enrichment, and PPI network analysis were used to verify the hub DEGs associated with human knee arthrofibrosis.
Statistical Analysis
The data are averaged ± S D. Represent. Statistical analysis was performed using GraphPad Prism 7.0 (GraphPad Software Inc, San Diego, California). Student’s t test or the Mann‒Whitney test was used to compare two groups. The groups were compared using one-way and two-way analysis of variance (ANOVA) and Tukey’s multiple comparison test. A threshold of P value less than or equal to .05 were considered to indicate statistical significance.
Results
Progressive Arthrofibrosis and Functional Impairment in the Rat PTJC Model
We established a rat model of right knee joint injury and evaluated the degree of arthrofibrosis at different time points. Histological examination revealed time-dependent progression of arthrofibrosis. At 7 days post-injury (dpi), hematoxylin and eosin (HE) staining indicated synovial hyperplasia and initial joint space narrowing. By 28 dpi, we observed substantial tissue filling within the joint cavity and marked thickening of the joint capsule (Figure 1A). Masson staining further demonstrated a progressive disorganization and accumulation of collagen fibers, characteristic of fibrotic tissue deposition (Figure 1A). Functional assessment corroborated the histological findings. Measurements of the passive range of motion (PROM) showed a progressive and significant decline in the total ROM, maximum extension, and maximum flexion angles over the 28-day time course (Figure 1B–D), confirming the development of progressive joint stiffness in our model. α-SMA is a marker of smooth muscle cells and is currently considered a marker of myofibroblasts.
22
Through α-SMA IHC, it was found that there was a significant increase in α-SMA + expression at both 7 and 28 dpi. Compared to a small amount of expression in the joint capsule before surgery, we found that a large amount of α-SMA expression was positive in the joint after surgery (Figure 1E). In summary, we found that the α-SMA+ concentration in the JC_28D group was significantly greater than that in the other groups. Pathological and functional alterations in a rat model of post-traumatic knee arthrofibrosis. (A) Representative images of HE and Masson’s trichrome staining of knee joint sections obtained pre-surgery (baseline) and at postoperative days 7 and 28 (n = 4). Scale bar = 500 µm. (B) PROM of the knee joint was dynamically assessed at five designated time points. Quantification of the maximum extension angle (C) and maximum flexion angle (D) are presented as mean ± SD. *P ≤ .05, **P ≤ .01, ***P ≤ .001, ****P ≤ .0001. (E) Immunohistochemical analysis of α-SMA expression in joint capsule myofibroblasts at the indicated time points (n = 4). The lower panels show magnified views of the boxed regions in the upper panels. Scale bars: 500 µm (upper panels), 200 µm (lower panels)
Transcriptomic Profiling Reveals Dynamic Changes and Identifies Key Differential Expression at Late-Stage Fibrosis
To further understand the critical periods and key genes expressed during traumatic joint contracture, we conducted RNA-seq analysis of the posterior capsule tissue of the knee joint in rats at different time points after trauma. Four biological replicates were established per group, and RNA-seq was performed. Among them, three samples were degraded and eliminated. The Q30 basic mass fraction of the sample assembled from Illumina sequencing exceeded 93.57%, with an error rate (%) of less than 0.026, meeting the requirements for subsequent analysis (Supplemental Table S2). By comparing the transcriptome and reference genome, more than 86% of the reads were uniquely mapped; these results met the subsequent analysis requirements (Supplemental Table S2). In short, sequencing data are suitable for subsequent data analysis.
To gain a global view of the transcriptomic changes, we performed PCA. The samples exhibited a clear temporal trajectory along PC1, with the 28 dpi samples being most distinct from the preoperative (JC_0D) controls, indicating substantial and progressive transcriptome remodeling over time (Figure 2A). PCA was separately calculated for the four time points after injury compared to the time of injury (the maximum variation in PC1 explained 45.32%, 45.92%, 54.83%, and 47.45% of the variation, respectively; Supplemental Figure S1). According to the RNA-seq results, 32 883 genes were detected. Subsequently, four time points after injury (the JC_3D, JC_7D, JC_14D, and JC_28D groups) were compared with those in the preoperative group (the JC_0D group) to perform differential gene expression analysis. Differential gene expression analysis identified a total of 1385 genes (set as Gene Set 1, Supplemental Table S3) that were significantly altered at one or more post-injury time points compared to baseline (JC_0D). The number and magnitude of DEGs were most pronounced at 28 dpi (Figure 2B), underscoring this as a critical time point for established fibrosis. Mfuzz time-series analysis of DEGs. (A) PCA of all samples included PC1 and PC2. (B) Differential expression analysis of genes. The significance levels of the upregulated and downregulated DEGs in each group compared with those in the JC_0D group, P adjusted <.05 and |log2FC|≥2 with the BH multiple comparisons. (C) Mfuzz time-series expression pattern reflecting the change in gene expression over time and gene statistics (c = 5). The vertical axis represents the change in gene expression, and the horizontal axis represents the time series. The color scale on the right represents the degree of participation of the genes in different clusters, with larger values representing greater importance
Temporal Clustering Identifies a Gene Expression Module Associated With Progressive Fibrosis
Mfuzz is a software that studies the temporal trends of gene expression in transcriptome data with time series characteristics. It can perform soft clustering of genes with similar expression patterns, thereby revealing the dynamic patterns and functional relationships of gene sets in different groups. 15 We used Gene Set 1 as the soft clustering target set and Mfuzz analysis to explore the temporal trends in gene expression with time series characteristics at 5 time points from preoperative to postoperative data. We selected a cluster with a c value of 5 to generate 5 representative modules of clusters, with an M value of 2.053, which represents the degree of softness of the Mfuzz c-means cluster. To systematically identify genes with coherent temporal expression patterns, we applied Mfuzz time-series clustering. This analysis revealed a distinct cluster (Cluster 1, Gene Set 2, comprising 370 genes) whose expression exhibited a steady, monotonic increase throughout the post-injury period, peaking sharply at 28 dpi (Figure 2C). This expression pattern strongly suggests that Gene Set 2 is enriched for drivers of the progressive fibrotic process. In addition, Cluster 1 showed a significant increasing trend at 28 dpi, an important arthrofibrosis time point validated in the previous text, indicating that it contains most of the representative genes expressed in arthrofibrosis.
Gene Co-expression Network Analysis Pinpoints the MEturquoise Module as a Hub for Late-Stage Fibrosis
To identify the module most relevant to the arthrofibrosis, we next constructed a weighted gene co-expression network to identify modules of highly interconnected genes and their association with the injury time course. Weighted gene co-expression network analysis was performed on all genes, and 7547 genes were obtained after pretreatment with 32 883 genes. The scale-free adaptation curve has a soft power (β value) of 12 (Figure 3A), and the y-axis represents the degree of fit R2 between the transformed adjacency matrix of the corresponding β value and the assumption of the scale-free network. The larger R2 is, the more the network conforms to a scale-free distribution. Figure 3B shows the scale-free average connectivity curve, with the horizontal axis representing the power-law weighted beta value. The vertical axis represents the average connectivity (k/degree/connectivity) of each node in the network represented by the adjacency matrix after the corresponding β value transformation. According to the expression trends of all genes, genes were divided into modules, with one color representing one module, resulting in 11 expression modules (Figure 3C). Importantly, we will conduct a correlation analysis between the module and the schedule type. WGCNA revealed that the MEturquoise module exhibited a significant positive correlation on day 28 after injury (set as Gene Set 3, Figure 3D). Module identification and analysis via WGCNA. (A) Analysis of network topologies with different soft threshold powers. Effect of soft threshold power on the scale-free topology fitting index. (B) Effect of soft-threshold power on average connectivity. (C) Genes were divided into modules according to their expression trends, and 11 colors representing 11 modules were identified. (D) Correlation analysis between the modules and the injury time phenotype. Red represents a positive correlation between the module and phenotype, while blue represents a negative correlation between the module and phenotype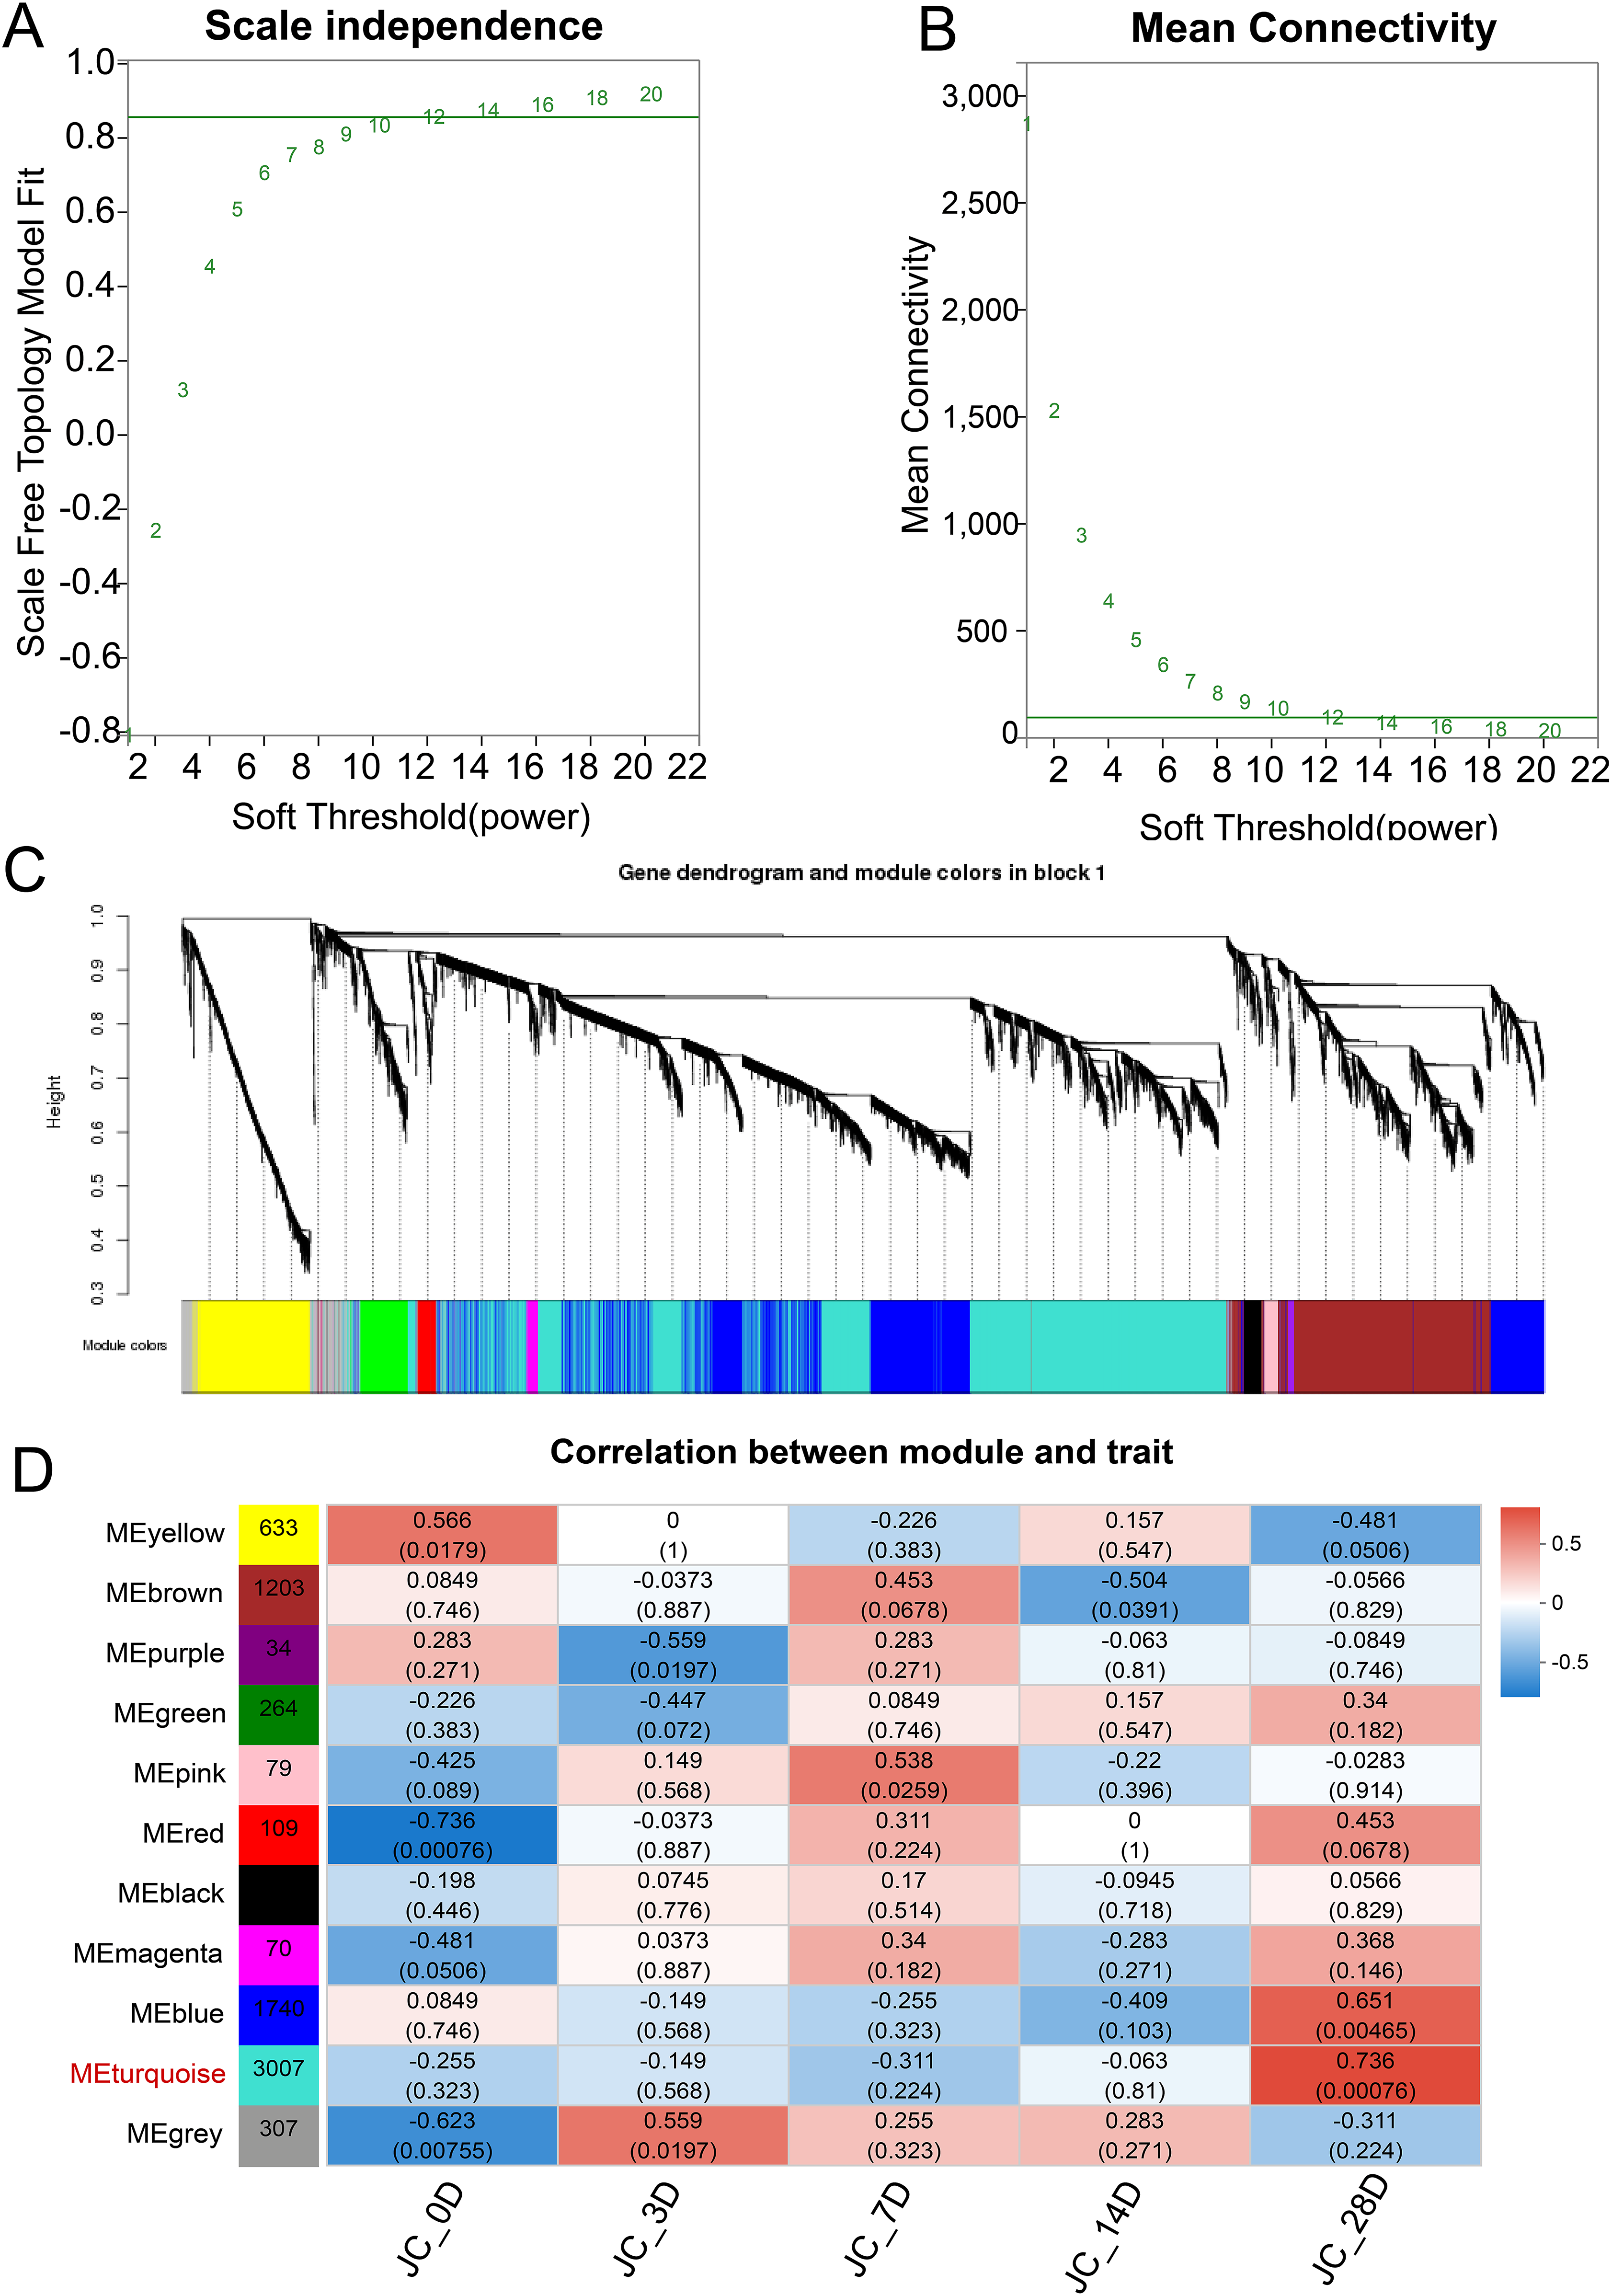
Convergent Pathway Analysis and Hub Gene Identification Implicate ECM and Contractile Signaling
We then conducted KEGG functional enrichment analysis on three gene sets, with gene set 1 representing 1385 DEGs, gene set 2 representing Cluster 1, and the gene set 3 representing MEturquoise module (Figure 4A–C). Strikingly, KEGG pathway enrichment analysis of all three gene sets revealed a convergent pattern, with significant shared enrichment in four key pathways: “ECM-receptor interaction”, “Focal adhesion”, “cGMP-PKG signaling pathway”, and “Vascular smooth muscle contraction” (highlighted in blue, Figure 4). KEGG pathway enrichment analysis of genes in gene sets 1, 2 and 3. (A-C) Enrichment results of the three gene sets. The horizontal axis represents the KEGG pathway, and the vertical axis represents the significance level of enrichment, corresponding to the height of the column. The different colors represent the seven branches of the KEGG signaling pathway, including metabolism (M), environmental information processing (EIP), cellular processes (CP), organismal systems (OS), and human disease (HD)
Furthermore, we conducted Venn analysis on these three gene sets and identified 238 common DEGs (Figure 5A). Further KEGG enrichment analysis revealed that the top 4 pathways were “ECM-receptor interaction”, “cGMP-PKG signaling pathway”, and “Focal adhesion” and “Vascular smooth muscle contraction” (Figure 5B). The convergence on these pathways prompted us to focus on the genes within them. We identified 238 common DEGs across the three gene sets (Figure 5A), which were most significantly enriched in the same four pathways (Figure 5B). Network visualization of genes within these top pathways nominated several high-confidence hub genes, including type IV collagen alpha 3 chain (Col4a3), integrin subunit alpha 8 (Itga8), type IV collagen alpha 6 chain (Col4a6), type IV collagen alpha 5 chain (Col4a5), integrin subunit alpha V (Itgav), myosin light chain 9 (Myl9), and myosin light chain kinase (Mylk) (Figure 5C). Furthermore, we selected the top 10 KEGG enrichment pathways for further chord diagram enrichment analysis between JC_0D and JC_28D. According to the highest Log2FC values, the top genes were Col4a3, Itga8, Col4a6, Col4a5, Col28a1, and Col14a1(Figure 5D). Hub pathway and gene analysis in gene sets 1, 2 and 3. (A) Venn analysis of three gene sets (1, 2, 3). The values represent the number of genes shared and unique among different gene sets. (B) KEGG enrichment analysis of the consensus genes. (C) Cytoscape-based visualization of the coexpression of Hub genes and their pathways. (D) Chord diagram between the two groups of JC_0D and JC_28D showing that the top 10 enriched pathways and genes were arranged in descending order of log2FC to screen the Hub genes
Experimental Validation Confirms the Upregulation of Hub Genes in Fibrotic Joint Tissue
We selected six candidate hub genes (Itga8, Col4a3, Col4a6, Col4a5, Col28a1, and Col14a1) based on their prominence in our bioinformatic analyses for experimental validation. Their expression, as measured by RNA-seq, increased significantly over time, with the most dramatic upregulation observed at 28 dpi (Figure 6A). Subsequently, we performed real-time quantitative polymerase chain reaction (RT‒qPCR) analysis on the posterior joint capsule tissue of the knee joint at 28 dpi (Figure 6B). Correlation analysis was performed based on the log2-fold change values of the DEGs, and the correlation coefficient was 0.912 (P = .011) (Figure 6C). The results showed great correlation and significant P values, indicating the reliability of the transcriptome data. Together, these data robustly validate the transcriptomic findings and confirm the association of these hub genes with the fibrotic phase of PTJC. Hub gene validation. (A) Changes in the expression of Hub genes among the multiple groups, with significant changes at 28 dpi. *P ≤ .05, **P ≤ .01, ***P ≤ .001. (B) A comparison of gene expression in terms of fold changes was validated by RNA-Seq and RT‒qPCR. (C) Correlation analysis of RT‒qPCR and RNA‒seq data
Cross-Species Validation in Human Arthrofibrosis Transcriptome Reinforces the Role of COL4 and ITGA8
We re-analyzed the mRNA microarray chip data of 4 fibrotic and 4 nonfibrotic joint capsule tissues from patients undergoing total knee arthroplasty (GSE135854). According to the differential gene expression analysis, the expression levels of Col4a3/Col4a6/Col4a5 and Itga8 were upregulated among the DEGs. Strikingly, analysis of the human dataset confirmed a significant upregulation of COL4A3, COL4A6, COL4A5, and ITGA8 in fibrotic tissues compared to non-fibrotic controls (Figure 7A), demonstrating remarkable cross-species conservation of these key molecular features. Furthermore, we performed Venn analysis on the intersection of 6045 DEGs from human knee arthrofibrosis in GSE135854 and our 1385 DEGs, resulting in 465 DEGs (Figure 7B). GO-KEGG combined enrichment analysis revealed a significant positive correlation between 465 DEGs and extracellular matrix components, such as “ECM organization”, “extracellular structure organization”, “collagen containing ECM”, and “ECM structural constraint conferring tension strength” (Figure 7C and Supplemental Table S4). To better display the interactions between genes, we conducted PPI network analysis through STRING. Using the CytoMCODE plugin in Cytoscape, we identified the top 5 gene cluster subsets among 465 DEGs, indicating the interaction between type IV collagen (COL IV) and ITGA8/ITGAV in the upregulated genes. All the tested collagens strongly interacted with matrix metalloproteinase 9 (MMP9) (Figure 7D). Validation of the Hub genes by the human knee fibrosis transcriptome. (A) Volcano plot of DEGs showing that the expression of the genes COL4A3, ITGA8, COL4A6, and COL4A5 was upregulated. |LogFC |>1&p. adj<0.05. (B) Venn analysis of 6945 DEGs in human knee arthrofibrosis and 1385 DEGs in gene set 1. (C) GO-KEGG joint analysis of 465 intersecting genes. (D) Based on Cytoscape MCODE, a gene interaction network of the top five subsets of 465 genes was constructed. Red represents upregulated expression, and blue represents downregulated expression. A darker color represents a greater correlation
Enhanced Expression of Type IV Collagen and Itga8 Primarily in the BM after Injury
The expression of type IV collagen, which is a major component of the basement membrane (BM), and Itga8 was further verified. We demonstrated changes in basement membrane expression before surgery and on the 7th and 28th days after surgery using PASM staining. Before surgery, black silver staining only appeared in the skin and dermis of the joint capsule, and no significant expression was detected below the muscle layer (Figure 8A). However, at 7 dpi, the BM or reticular fibers were generated in the joint capsule, exhibiting extensive loose black staining deposition (Figure 8A and B). The main component of the basement membrane is type 4 collagen. Interestingly, at 28 dpi, a large amount of BM or reticular fibers had proliferated in the posterior joint capsule and joint space. Figure 8A, C–E shows the dense deposition of hexamine silver black, indicating that there was proliferation of the BM in the early stages after injury, and in the later stages of injury, the BM was significantly dense. However, in normal tissues, these structures do not express basement membrane components. In addition, further immunohistochemical analysis of Itga8 also demonstrated a significant increase in Itga8+ expression on both day 7 and day 28 after injury (Figure 8B–C). Validation of the expression of Itga8 and Col IV, which are present mainly in the basement membrane. (A) PASM staining on preoperative and postoperative days 7 and 28 (n = 4). Scale bar = 500 µm. a-e are locally magnified images at 10× magnification. Scale bar = 50 µm. (B) Representative maps showing changes in the expression of Itga8+ in the knee joints of rats on preoperative and postoperative days 7 and 28, as determined by immunohistochemistry. Scale bar = 500 µm. a-d are locally enlarged images (n = 4). Scale bar = 50 µm. (C) Quantitative analysis of Itga8 relative expression. The expression levels were quantified as Integrated Optical Density per area and normalized to the control group. Data are presented as mean ± SD. **P < .01, ***P < .001
Discussion
Our study provides the first comprehensive, time-resolved transcriptomic atlas of post-traumatic joint contracture, delineating the dynamic molecular landscape from acute injury to established fibrosis. By integrating multiple bioinformatic approaches with cross-species validation, we have mapped the pathway-level alterations driving arthrofibrosis and, more specifically, identified a molecular module within the basement membrane-comprising type IV collagen α3/α5/α6 chains (Col4a3/5/6) and Itga8, as a central driver and potential therapeutic target (Figure 9). Furthermore, through RT‒qPCR, immunohistochemistry, and PASM staining, we confirmed elevated expression of Itga8 and Col IV- enriched basement membrane in human post-traumatic arthrofibrosis. This work moves beyond descriptive histology to define the precise molecular chronology of PTJC, providing a new framework for understanding and intervening in this debilitating condition. Schematic diagram of the differential expression of genes and pathways affected by PTJC based on unbiased transcriptomic data.This diagram summarizes the pathogenesis process of PTJC and identifies key molecular changes and pathways through transcriptome sequencing. It emphasizes the upregulation of the Col4a3, Col4a5, Col4a6, and Itga8 genes, as well as their crucial roles in ECM remodeling and fibrosis. These genes are associated with the key pathways that are significantly enriched during the progression of PTJC, namely “ECM-receptor interaction”, “Focal adhesion”, “cGMP-PKG signaling pathway”, and “Vascular smooth muscle contraction”
Fibrosis, referred to as extracellular matrix remodeling (ECMR), result from dynamic alterations in the composition, quality and organization of ECM components. Under physiological conditions, ECMR maintains tissue homeostasis23-26; however, persistent or aberrant remodeling disrupts this balance, leading to excessive collagen deposition, tissue fibrosis, and in severe cases, ectopic ossification.27,28 Col IV, a major structural component of the basement membrane, is a polymeric protein composed of triple-helical assemblies of α chains encoded by six distinct genes (α1-α6). 29 Unlike many fibrillar collagens, Col IV is primarily synthesized and assembled by epithelial and endothelial cells, contributing to its unique role in maintaining basement membrane integrity. 30 Here, we demonstrated that the expression of Col IV significantly increased after joint injury, especially at 28 dpi, while it also showed a prominent increase in human knee arthrofibrosis. This aligns with prior reports in other fibrotic contexts. For example, in liver fibrosis, Col IV accumulation is an early event during sinusoidal capillarization. 31 During the process of liver fibrosis, Col IV is one of the earliest indicators of elevation. 32 After tissue injured, the surface of endothelial or epithelial cells is damaged or destroyed, and the basement membrane is exposed. A continuous increase in Col IV leads to angiogenesis, which usually occurs before fibrosis. 33 Similarly, studies have shown that activation of the transforming growth factor beta1 (TGF-β1)/mothers against decapentaplegic homolog 3 (SMAD3) signaling pathway may lead to additional synthesis of Col IV, and Col IV is a major contributor to the accumulation of ECM in diabetic nephropathy. 34 Notably, Col IV chains (α1-α6) is an important substrate for MMP cleavage. 35 Consistent with this, the transcriptome data of human knee arthrofibrosis patients showed coordinated elevation of Col IV and MMP9, supporting a coupled remodeling process. Together, these observations highlight Col IV—particularly the α3, α5, and α6 chains—as potential early regulatory biomarkers in arthrofibrosis.
The concurrent upregulation of Col4a3/5/6 and Itga8 is particularly noteworthy and suggests the existence of a pathogenic feed-forward loop in fibrotic progression. Based on our findings, we propose a model wherein injury-induced deposition of specific Col IV isoforms in the aberrant basement membrane creates a pro-fibrotic niche. Itga8, expressed on activated fibroblasts or other cells, then engages with these Col IV ligands. This engagement is hypothesized to transduce mechanical and chemical signals into the cell, potentially amplifying TGF-β signaling—a master regulator of fibrosis—and further reinforcing the contractile, synthetic myofibroblast phenotype. This Col IV/Itga8 axis may thus serve as a critical linchpin between ECM stiffening and cellular activation, perpetuating the fibrotic cascade.
Reports on the Roles of Integrin α8 and the Subunits of IV Collagen α3, 5, and 6 in Fibrosis

Integrin α regulates the polarity of BM cells, cell differentiation and survival, tissue formation and migration, and resistance to mechanical stress, which are closely related to Col IV. However, the underlying mechanisms remain complex, largely due to the diversity of integrin subunits and the intricacies of their spatial conformations. In this study, we first discovered that integrin α8 and Col IVα3/5/6 collagen mediate post-traumatic arthrofibrosis, highlighting their potential as targets for therapeutic intervention or early diagnosis.
Unlike most prior investigations that provided static snapshots of joint fibrosis, our longitudinal design uniquely captures the transition towards irreversible contracture. We define the 28-dpi time point not just as an endpoint, but as a critical therapeutic window where the Col IV/Itga8 axis is fully established. This temporal resolution is crucial for the timing of future interventions. Although individual members of the Col IV family or integrins have been implicated in fibrosis elsewhere, the specific combination of Col4a3/5/6 with Itga8, and their validation in the context of articular fibrosis is novel. Their conservation in human arthrofibrosis tissue significantly enhances their translational relevance. These molecules present a dual opportunity: as a biomarker panel for early diagnosis and prognosis, and as a targeted therapeutic strategy. For instance, blocking the Col IV-Itga8 interaction could disrupt the proposed feed-forward loop without globally inhibiting ECM deposition.
We acknowledge several limitations of this study. First, our transcriptomic analyses suggest a association between the upregulation of Col4a3/Col4a5/Col4a6/Itga8 and the progression of arthrofibrosis. Future studies employing genetic knockout or antibody-mediated inhibition of Itga8 in our PTJC model are essential to establish causality. Second, although supportive, our human validation relies on a relatively small public dataset; confirmation in a larger, prospective clinical cohort is therefore warranted. Finally, the precise cellular sources of Col4a3/5/6 and Itga8 within the complex joint tissue microenvironment remain to be precisely identified using techniques like spatial transcriptomics or lineage tracing.
Conclusion
In summary, dynamic transcriptomic profiling has enabled us to delineate the molecular progression of arthrofibrosis and to uncover a critical role for the Col IV/Itga8 axis within the basement membrane. This axis represents a previously underappreciated driver of PTJC, bridging ECM pathology with cellular activation. Our findings thus provide a valuable resource for the field and nominate specific, testable targets for diagnostic and therapeutic development, opening new avenues for prevention and treatment of this common cause of joint disability.
Supplemental Material
Suppplemental Material - Temporal Transcriptomics Leads From Discovery to in Vivo Validation: COL4A3/COL4A6/ COL4A5 and ITGA8 as Novel Arthrofibrosis Biomarkers in Post-traumatic Joint Contracture
Suppplemental Material for Temporal Transcriptomics Leads From Discovery to in Vivo Validation: COL4A3/COL4A6/ COL4A5 and ITGA8 as Novel Arthrofibrosis Biomarkers in Post-traumatic Joint Contracture by Yijia Wang, Hong Zeng, Zilin Li, Li Cheng, Xintong Zhu, Mengting Liang, Zhongyi Fang, Shujing Lai and Bin Cai in Dose-Response
Footnotes
Acknowledgements
We would like to extend our gratitude to the staff at the Department of Laboratory Animal Science, Shanghai Jiao Tong University School of Medicine, for their professional assistance in animal care and husbandry. We also acknowledge the contributors of the GSE135854 dataset for making their transcriptomic data publicly available, which facilitated the cross-species validation in this study.
Ethical Considerations
The animal experimental protocol was reviewed and approved by the Animal Ethics Committee of Shanghai Jiao Tong University (Study Protocol No: A2024377-002).
Author Contributions
YW: Study design, biosample collection, analysis design, bioinformatic analyses, validation experiments, and manuscript drafting. HZ: Study design, analysis design, bioinformatic analyses, and manuscript revision. ZL: Project coordination, analysis design, bioinformatic analyses, and manuscript revision. LC: Animal management and biosample collection. XZ: Animal management and biosample collection. ML: Animal management and biosample collection. ZF: Analysis design, bioinformatic analyses and validation experiments. SL: Analysis design, bioinformatic analyses, validation experiments, and supervision and performance of bioinformatic analyses. BC: Study design, analysis design, bioinformatic analyses, supervision and performance of bioinformatic analyses, and manuscript revision. All authors have read and approved the final manuscript.
Funding
The authors disclosed receipt of the following financial support for the research, authorship, and/or publication of this article: This study was funded by the Hainan Provincial Natural Science Foundation of China (Grant Number 824RC558); the Young Scientists Fund of the National Natural Science Foundation of China (Grant Number 32100730); the Shanghai Health Commission Key Supporting Discipline (Grant Number 2023ZDFC0303); the Biomaterials and Regenerative Medicine Institute Cooperative Research Project, the Shanghai Jiao Tong University School of Medicine (Grant Number 2022LHB08); the Startup Fund for Young Faculty at SJTU (Grant Number AF3240014); and the National Natural Science Foundation of China (Grant Number 82372377).
Declaration of Conflicting Interests
The authors declared no potential conflicts of interest with respect to the research, authorship, and/or publication of this article.
Data Availability Statement
The data that support the findings of this study are openly available in NCBI Sequence Read Archive (SRA, SUB9827515), reference number SRR14864274-SRR14864290.
Supplemental Material
Supplemental material for this article is available online.
Appendix
References
Supplementary Material
Please find the following supplemental material available below.
For Open Access articles published under a Creative Commons License, all supplemental material carries the same license as the article it is associated with.
For non-Open Access articles published, all supplemental material carries a non-exclusive license, and permission requests for re-use of supplemental material or any part of supplemental material shall be sent directly to the copyright owner as specified in the copyright notice associated with the article.