
Abstract
Background:
Gliomas are the malignance of a poor prognosis. The current WHO classification remains unable to predict survival outcomes accurately. Novel surrogates are highly required for improved stratification of patients and hence, allowing to delivery of the most appropriate treatment.
Methods:
Transcriptional profiles of 301 glioma cases on the platform of Chinese Glioma Genome Atlas (CGGA) were retrospectively studied.
Results:
Extracellular matrix (ECM) scores were established by integrating a panel of most featured gene-signatures, correlating well with pathological tumor stages. Linear regression analysis revealed that the ECM score corroborated with the infiltration status of monocytes, M0 and M1 macrophages. Furthermore, the WHO stage II-IV dependent abundance of those 3 immune cells was determined. Univariate and multivariate analysis of clinicopathological characteristics in the GBM cohort identified M1 enrichment score as an independent risk factor. A high abundance of M1 macrophages was associated with poor survival outcomes and radiotherapy response in IDH-wildtype GBM.
Conclusions:
Our study demonstrated that M1 macrophages correlated with WHO grades and predicted robustly for the survival performance for GBM patients. Increased infiltration of M1 macrophages was associated with a poor radiation response for IDH-wildtype GBM. Together, it will facilitate more precise stratifications of glioma patients based on molecular and immunological surrogates.
Introduction
Glioma originates from neural stem/progenitor cells, accounting for 80% of adult malignant central nervous system (CNS) tumors. 1 Glioma is particularly heterogeneous and composed by a group of histologic subtypes, which makes the therapeutic interventions more complex. 2 In general, gliomas were classified into 4 grades: WHO grade I-IV according to the latest WHO classification, whereas WHO grade IV glioma (mostly glioblastoma) is highly malignant and thus with an extremely poor prognosis. 3 With the ready availability of genome-wide transcriptional profiling and sequencing technologies, it contributed crucial insights into glioma classification in addition to the histological basis. 4 A number of molecular markers, such as IDH mutation status and 1p/19q co-deletion, etc. providing principle rationales for differential diagnosis and selection of appropriate treatment strategies. 3 The treatment of gliomas is consisting of surgical resection, radiotherapy and chemotherapy or targeted therapy where feasible, etc. 5 Nevertheless, there remains clinical difficulties that the current WHO classification is unable to predict robustly the survivals. Precise molecular surrogates are desperately required for an improved stratification of patients and allowing to delivery of the most appropriate treatment.
The 5-year survival rate of glioblastoma patients is only approximately 5%. 6 The pathogenesis of glioma is yet to be elucidated. It is explained at least partially by intercellular heterogeneity and heterogeneity of the cells surrounding the tumor in the extracellular matrix. 7 Tumor microenvironment (TME), recently found to contribute to tumor development and drug-resistance, especially in the aspect of anti-tumor immunotherapy. 8 As reported in a variety of tumors, immune cells in the TME were found to have important roles in anti-tumor immune responses. 9 -12 Reliable molecular markers remain absent for ensuring the comprehensive treatment of glioma. 13 This could be explained at least by one reason that the antitumor immune response is difficult to play a role in TME. It was believed in the past decades that immune cells were difficult to reach brain tissue due to the protection role of the blood-brain barrier (BBB). 8 However, recent studies confirmed that immune cells clearly played immunomodulatory roles in brain inflammations and tumor development. 14 -16 In particular, the monocytic cells derived immunosuppressive cells, as well as suppressed antigen-specific T-cell immune responses is found to facilitating immune escape of tumor cells. 17 -19 Therefore, it seems that immune cells in glioma tumor microenvironment are appealing surrogates for exploring therapeutic targets of glioma immunotherapy.
The present study aimed to investigate the gene expression profiles of glioma as well as characterized gene-signatures associated with ECM and infiltrated immune cells. The relationship between the identified TME features and survival capacities and radiation response were retrospectively analyzed. This study was with high interests for the discovery of potential biomarkers for stratifying gliomas patients based on novel TME surrogates.
Materials and Methods
Gene expression matrix (microarray data, 2019-10-10) were downloaded from the Chinese Glioma Genome Atlas (CGGA, http://www.cgga.org.cn/) project database along with all the clinical characteristics. The overall design of this study was indicated by the flow-chart (Figure 1). Totally, 301 glioma cases in the CGGA dataset were included and the detailed information of those cases were summarized in Table 1.
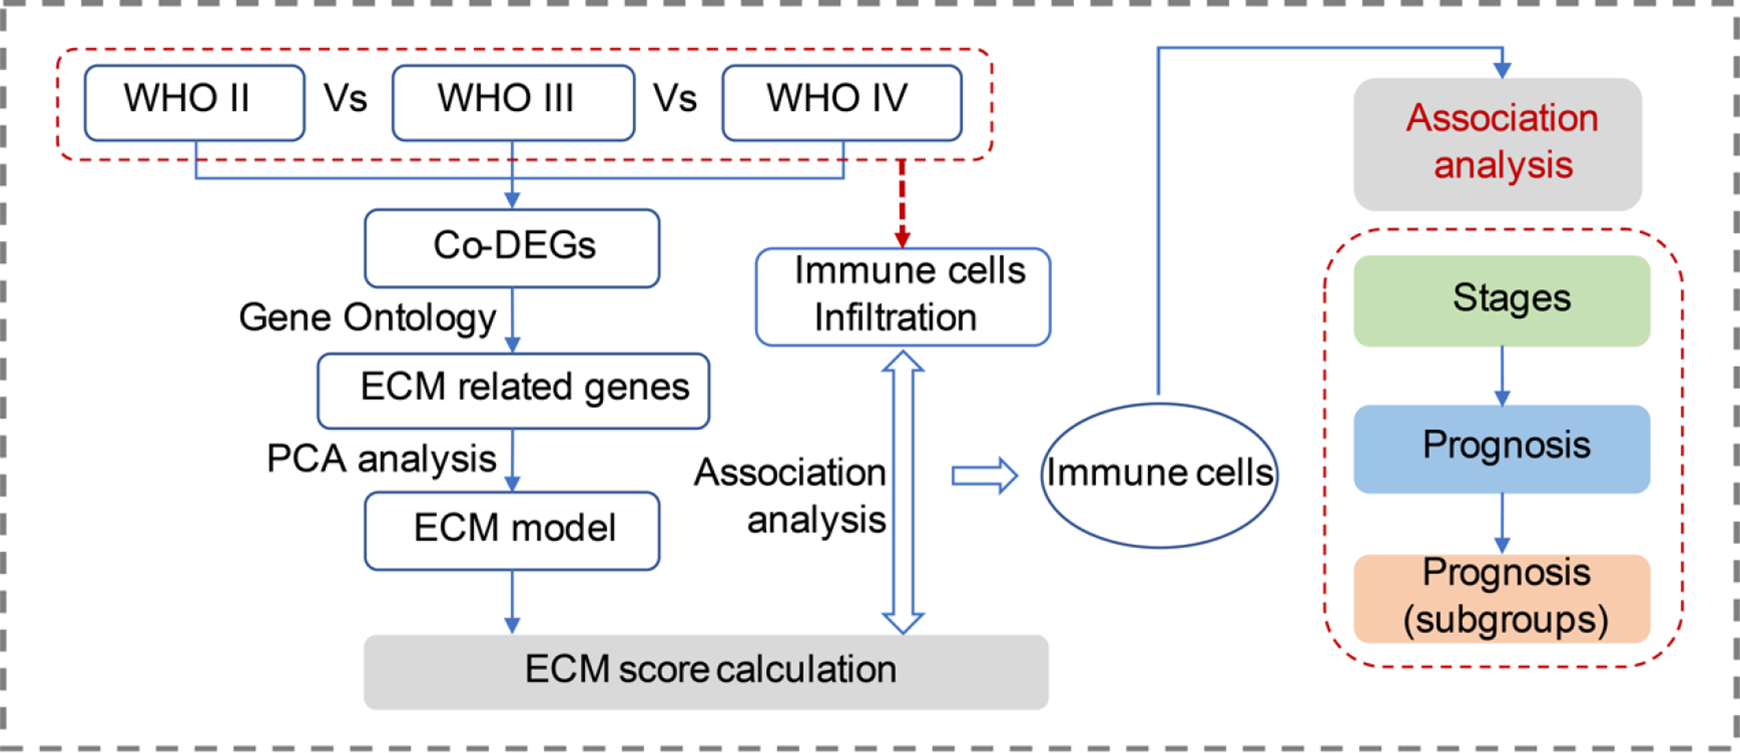
A schematic diagram of the workflow for this study. ECM score model was established based on the DEGs across different grades of gliomas and the ECM score associated immune cells were further analyzed for the prognosis prediction value. (DEGs, differentially expressed genes.).
Clinical Characteristics of the Included Samples in This Study.

Notes: CGGA, the Chinese Glioma Genome Atlas; ys, years; ms, months; A, astrocytoma; AA, anaplastic astrocytoma; AO, anaplastic oligodendroglioma; AOA, anaplastic oligoastrocytoma; GBM, glioblastoma; O, oligodendroglioma; OA, Oligo-astrocytomas; rA, recurrent astrocytoma; rAA, recurrent anaplastic astrocytoma; rAO, recurrent anaplastic oligodendroglioma; rAOA, recurrent anaplastic oligoastrocytoma; rGBM, recurrent glioblastoma; sGBM, secondary glioblastoma; NA, not available.
DEGs Determination and Enrichment Analysis
Differently expressed genes (DEGs) were calculated with the Limma package 20 in R statistics software (version 3.5.1). Expression status of genes were represented by estimated fold-changes (FCs) using the empirical Bayes method, and the standard errors of estimated FCs were calculated by fitting a linear model for each gene. 21 When comparing the gene expression levels between different stages of gliomas, genes with FCs >2 or <–2 while the p-value <0.05 were determined as the DEGs. Venn analysis was applied to determine the intersection DEGs of comparisons between stage III Vs II gliomas and between stage IV Vs III gliomas. Gene Ontology (GO) 22 enrichment analysis, supported by R package clusterProfiler 23 was further performed to the common DEGs.
ECM Estimation Model Establishing
The expression status of top GO results associated DEGs were further analyzed. To explore the expression levels of those DEGs in different stages of gliomas, principle component analysis (PCA)
24
-26
was performed to those DEGs and the PCA scores were marked to each gene, based on which the comprehensive estimation model for ECM was established (ECM score =
Immune Cells Infiltration Analysis
With the microarray expression data, immune cells infiltration status in tumor microenvironment was computed to each sample (supported by website tool xCell, 27 a novel gene signature-based tool). The xCell tool calculates s the abundance of certain cell types with high accuracy and sensitivity, thus, the enrichment of immune cells in TME can be estimated with high confidence. 27 The correlation between infiltration abundance of cells and ECM scores were then calculated with linear regression model. 28,29 Pearson’s correlation R > 0.5 or < −0.5, while p-value <0.05 were considered to be statistically significant. Infiltration abundance of immune cells which were positively or negatively correlated with the ECM scores were further compared across all the gliomas in different stages.
Survival Association Analysis
With the ECM score and immune cells infiltration scores, survival analysis was performed to all glioma patients. This analysis was supported by the R package ‘survival’ 30 and ‘survminer,’ 31 using the log-rank (Mantel-Cox) test. 32 Sub-group survival analysis was performed to different stages of gliomas as well as patients with glioblastoma in different conditions. The mean values of ECM score and mean immune cells infiltration abundance scores were employed as the cut-off values to classify samples into cell infiltration high and low groups.
Results
To study characterized transcriptional profiles with respect to different stages of gliomas, the differentially regulated genes between stage II, stage III and IV were determined including 357 DEGs (278 up- and 79 down-regulated) and 827 DEGs (518 up- and 309 down-regulated), respectively (Figure 2A and B). Venn analysis was used to identify commonly expressed signatures including 41 up- and 6 down-regulated DEGs among stage II, III and IV of gliomas (Figure 2C and D). GO enrichment analysis showed that extracellular matrix (ECM) biological process was revealed to play a critical role in development of glioma (Figure 2E). A total of 8 up-regulated DEGs including FMOD, CTHRC1, ANXA2, EMILIN2, S100A8, COL4A2, CD248 and VASN were enriched in ECM biological process.

Results of DEGs calculation between different stages of glioma. (A) DEGs between WHO III and WHO II gliomas including 278 up- and 79 down-regulated genes; (B) DEGs between WHO IV and WHO III gliomas including 518 up- and 309 down-regulated genes; Genes with FCs >2 or <–2 with P <0.05 were determined as the DEGs. (C) 41 commonly up-regulated genes were identified among the 3 groups. (D) Six commonly down-regulated genes were identified among the 3 groups. (E) GO enrichment analysis of the 41 commonly up-regulated genes. The extracellular matrix was the most significant enriched GO term and while 8 commonly up-regulated genes (FMOD, CTHRC1, ANXA2, EMILIN2, S100A8, COL4A2, CD248 and VASN) were enriched.
The expression profiles of ECM associated gene-signatures with reference to grade II-III of glioma were shown in the heatmap (Figure 3A). Principle component analysis (PCA) indicated that different grades of gliomas were well clustered. However, considerable overlaps were observed among different stages of gliomas (Figure 3B). To remove the overlaps, ECM score was therefore proposed and calculated for each sample. ECM scores were used to compare all gliomas and significantly difference among grade II-IV of gliomas was observed. And the ECM scores correlated well with elevated tumor grades (Figure 3C). In addition, prolonged overall survival was observed in patients with higher ECM scores (Figure S1).

Expression analysis of the 8 featured ECM gene-signatures. (A) Heatmap of the expression levels of 8 characterized genes in WHO II, III and IV gliomas. (B) Principle component analysis of 8 genes in different grades of gliomas. (C) ECM scores were calculated to each sample and compared between different gliomas. Estimation Model Establishing (ECM) score =
Macrophages enriched in TME or namely tumor-associated macrophages (TAMs) plays an important role in tumor growth, invasion and transformation. 33 TAMs are differentiated from circulation monocytes or from the brain localized macrophages. Theoretically, the recruitment procedure is largely affected by ECM components and fragments. 34,35 We next evaluated the immune cells infiltration status in glioma tissues (Figure 4A). The cell enrichment scores of myeloid cells (basophils, cDC, DC, eosinophils, iDC, M0 macrophages, M1 macrophages, M2 macrophages, mast cells, monocytes, neutrophils, and pDC) were analyzed among different grades of gliomas by ternary plot analysis. Monocytes, M0 macrophages, and M1 macrophages were identified to play a dominant role in WHO II-IV gliomas (Figure 4B). Linear regression analysis confirmed that the ECM score correlates well with the abundance of monocytes, M0 macrophages, and M1 macrophages (R = 0.62, 0.51, 0.54, respectively; all P < 0.0001) (Figure 4 C-E, Figure S2). Those findings highlighted the potential role of macrophages in the pathogenesis of gliomas.
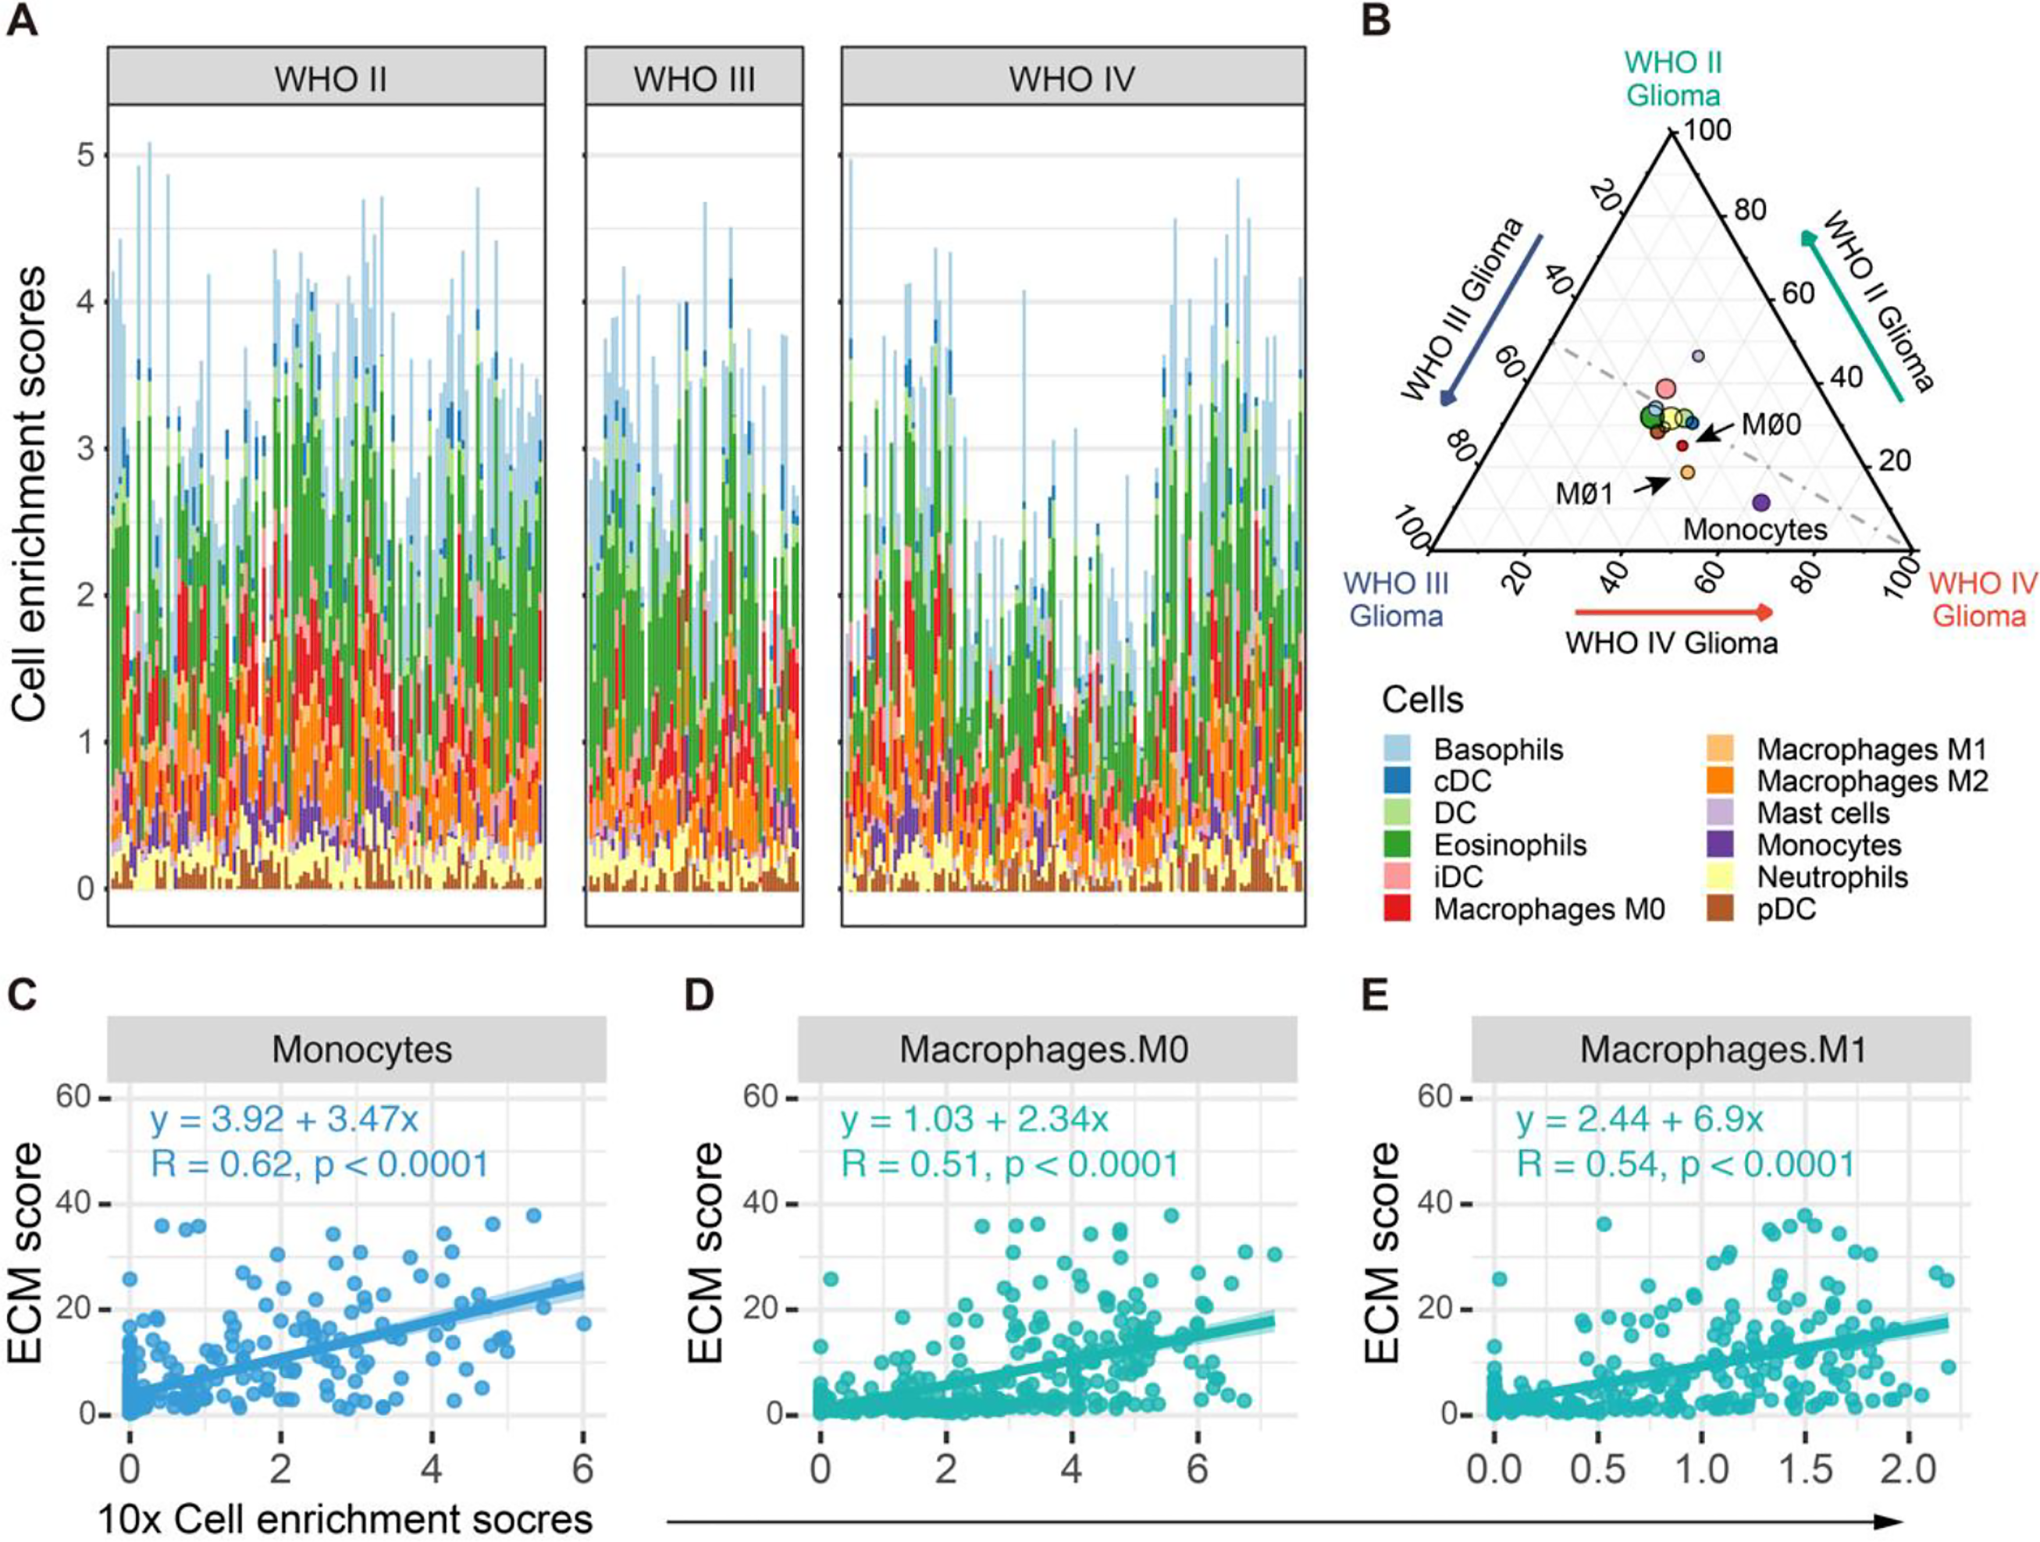
Myeloid cell enrichment analysis and the correlations with ECM scores in gliomas. (A) Enrichment analysis of myeloid cells in WHO II, III and IV gliomas. Each column stands for one sample. Colors of bars indicates the cell types. (B) Ternary plots of variation-partitioning analysis of myeloid cells enrichment scores in WHO II glioma (top, green), WHO III glioma (left, blue), and WHO IV glioma (right, red). The color of each node indicates cell type, while the node size represents their overall enrichment scores in glioma. Monocytes, M0 macrophages, and M1 macrophages may play dominant roles in the variances between WHO II, III and IV gliomas. (C-E) Linear regression analysis of cell enrichment scores and ECM scores. The cell enrichment scores of monocytes, M0 and M1 macrophages are well correlated with ECM scores (R = 0.51, 0.54 and 0.62, respectively, all P < 0.0001).
Infiltrated immune cells are important components of TME, 34,35 we further asked whether the status of monocytes and macrophages was associated with pathological grades and survivals. A pathological stage dependent growing abundance of monocytes, M0 macrophages and M1 macrophages were found (Figure 5 A-C), as derived from immune cell enrichment analysis based on a large spectrum of immune cells (Figure S2). Furthermore, the high infiltration status of monocytes, M0 macrophages, and M1 macrophages were associated with a poor prognosis (all P < 0.0001) (Figure 5 D-F).
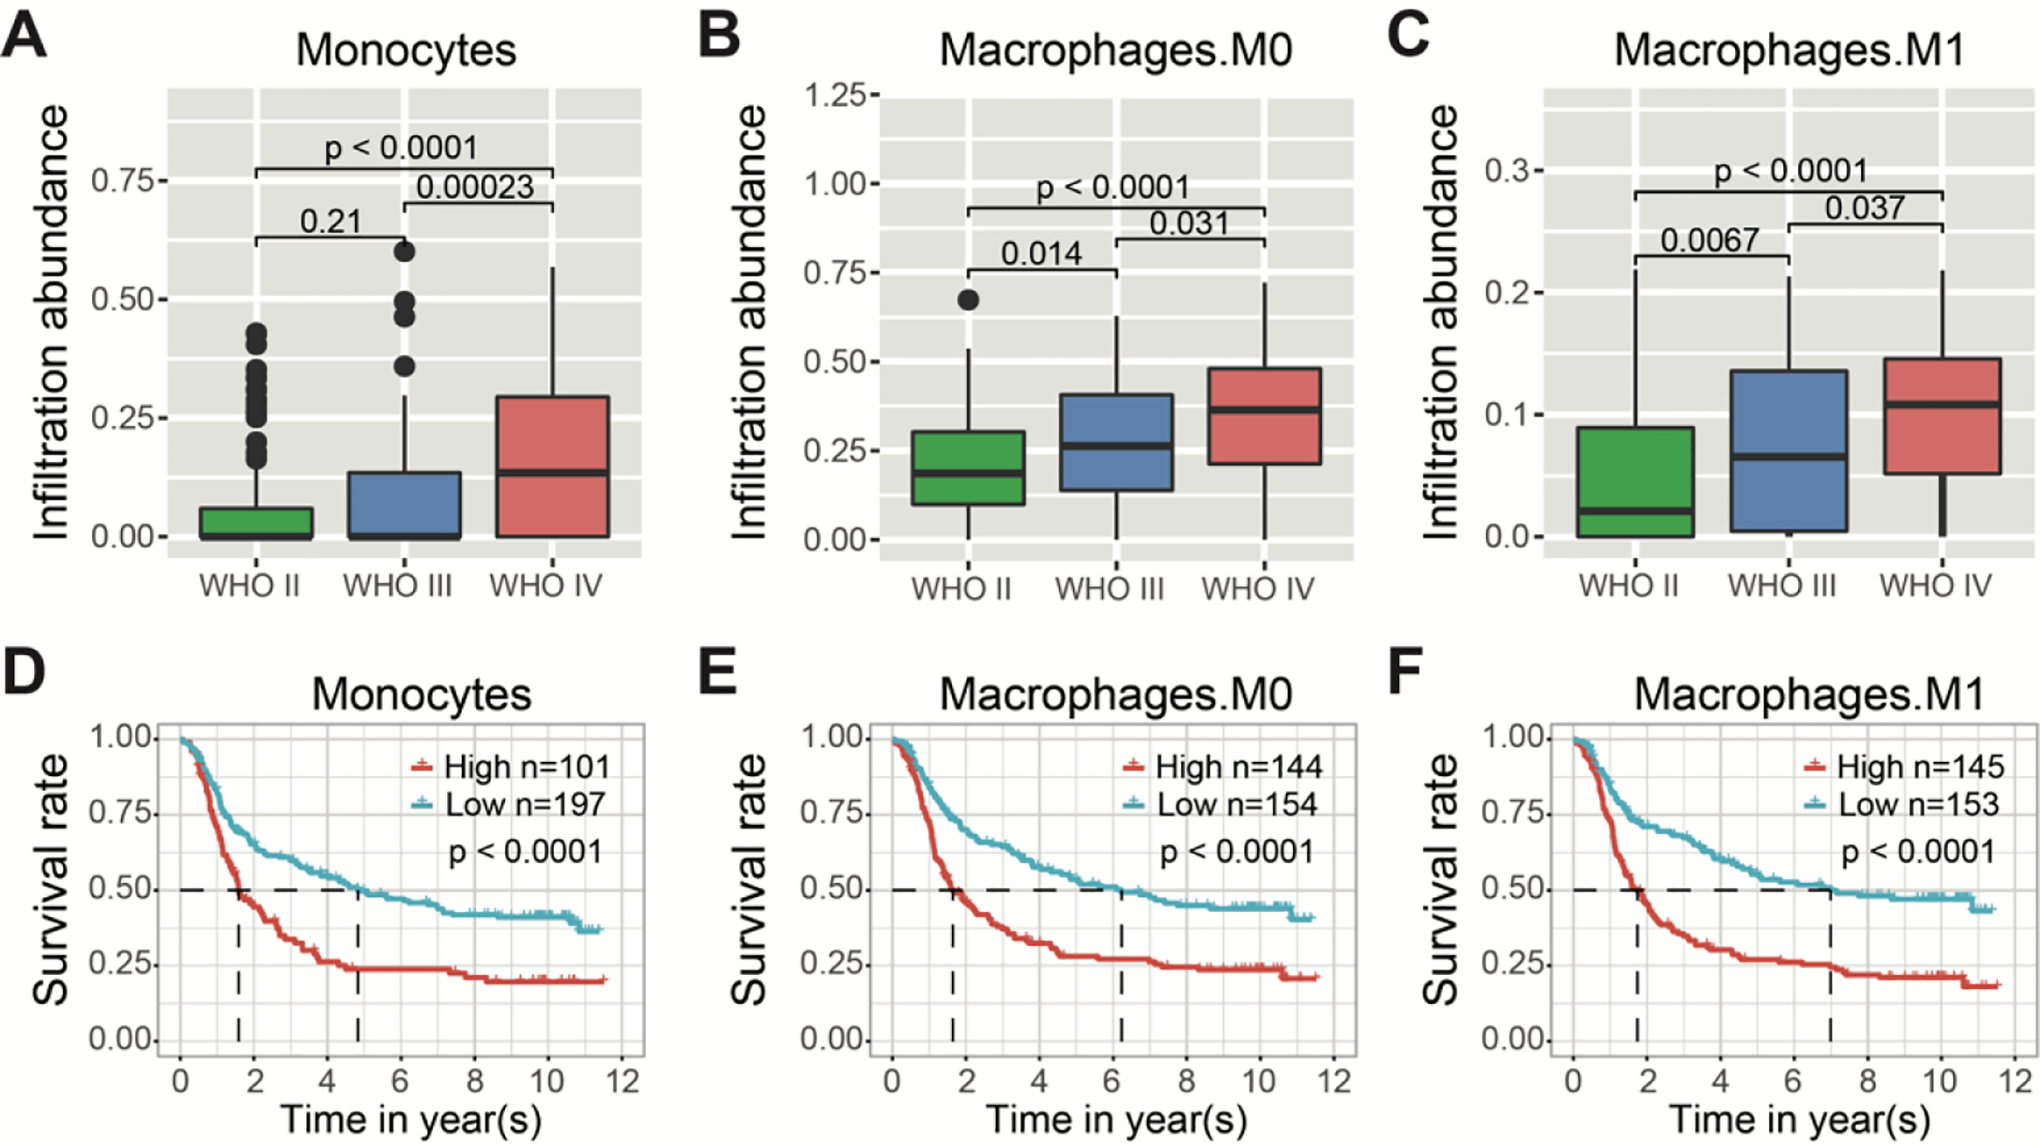
WHO stages and survival outcome analysis with reference to monocytes, M0 macrophages and M1 macrophages infiltration status in gliomas. (A, B, C) The cell enrichment scores of monocytes, M0 macrophages and M1 macrophages with respect to different grades of gliomas. (D, E, F) The Kaplan–Meier overall survival (OS) analysis of monocytes, M0 and M1 macrophages in gliomas with all WHO grades. The mean enrichment scores were used to divide gliomas into high- and low- enrichment groups (all P < 0.0001).
Subgroup analysis was further performed in terms of glioblastoma (GBM), IDH wildtype status as well as response to radiation treatment. Within the GBM subgroup, high infiltration of M1 macrophages was identified with poor survival outcomes as compared to low infiltration (Figure 6A and Figure S3H). Consistently, univariate and multivariate analysis of clinicopathological characteristics in the GBM cohort showed that the M1 enrichment score was an independent risk factor for GBM patients (HR = 1.381, 95% CI [1.022-1.866], P = 0.036) (Table 2). IDH mutation status is an independent prognostic factor among glioma patients. 36 High abundance of M1 macrophages was associated with a poor survival outcome in IDH wildtype GBM patients (P = 0.021) (Figure 6B). In IDH wildtype patients after receiving radiotherapy, a high abundance of M1 macrophages was associated with a poor prognosis compared to low infiltrations (P = 0.011) (Figure 6C).
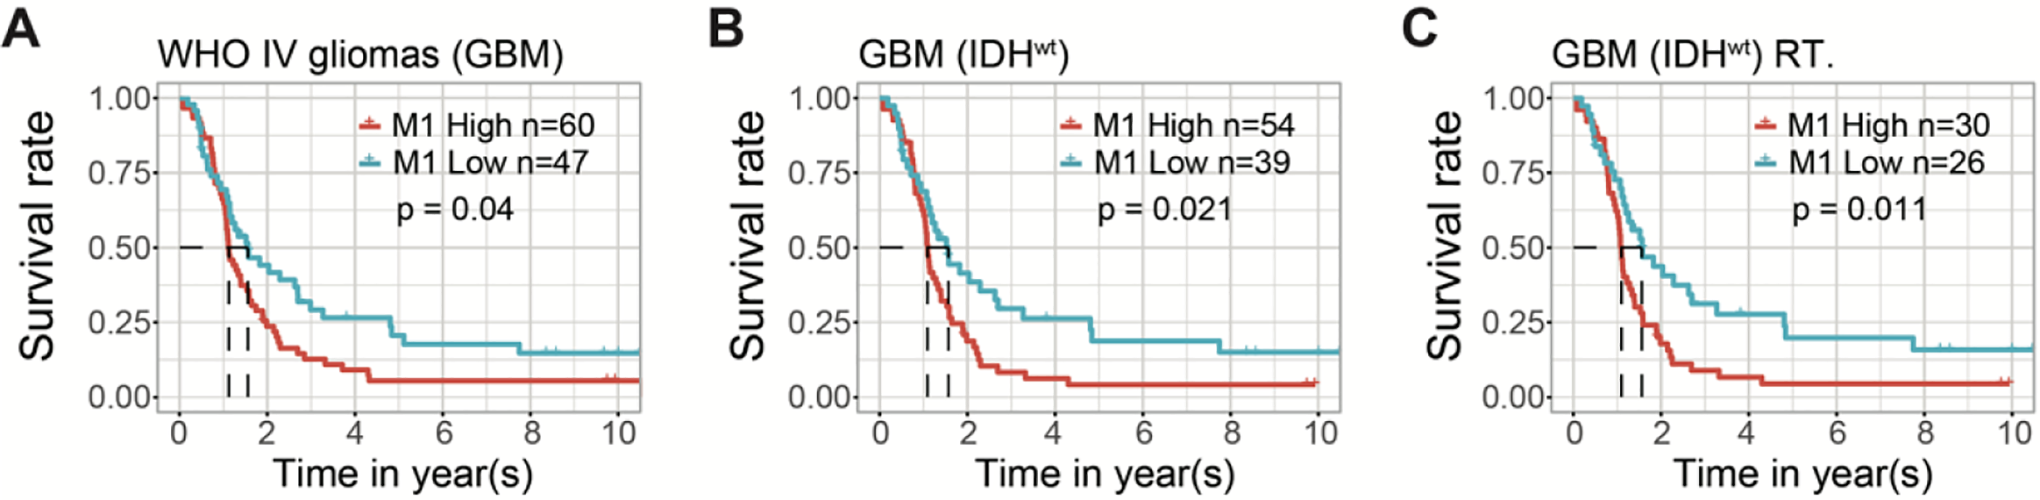
The Kaplan–Meier estimates of survival performance in WHO IV patients with respect to high- versus low- M1 macrophages infiltration status. (A) Superior survival outcomes were observed in low M1 enrichment group compared to high M1 enrichment in overall patients with WHO IV gliomas or GBMs (P < 0.05). (B) Superior survival outcomes were observed in low M1 enrichment group compared to high M1 enrichment in IDH wildtype patients with WHO IV gliomas or GBMs (P < 0.05). (C) Favorable survival outcomes were observed in low M1 enrichment group compared to high M1 enrichment in IDH wildtype WHO IV gliomas received radiotherapy (P < 0.05).
Univariate and Multivariate Analysis of Clinicopathological Characteristics With Overall Survival in GBM Cohort.

Notes: u.p-value, univariate analyses p-value; m.p-value, multivariate analyses p-value.
Discussion
Glioma is one of the most malignant tumor in the central neural system. Despite advances in treatment modalities, most of high grades glioma remains largely incurable. The plausible roles of TME in glioma are recently highlighted, which offers a potential way for molecular evaluation or therapeutic intervention in the future. It was reported that the stroma and infiltrated immune cells are the key components in tumor microenvironment (TME) to resist the checkpoint blockade. 37 However, the situation in brain tumors are complex since the CNS is an immune privilege area. 38 The definitive roles of infiltrated immune cells in glioma TME are yet to be elucidated.
In present study, we performed a comprehensive analysis on transcriptome from CGGA database, with a particular interest in TME and immune cell infiltrations. Based on that, the ECM scores as well as cell abundance enrichment scores was therefore established, and further validated with survival outcomes of glioma patients. By exploring the differentially expressed genes (DEGs) between gliomas in WHO grade II, III and IV, we found that the commonly up-regulated DEGs were enriched in GO-BP term ECM and the expression levels of enriched genes were integrated into the ECM score. The ECM score correlated well with the stages of glioma, suggesting that extracellular matrix may play a close role in development of glioma. Consistently, Ferrer et al. reported that ECM-glioma cells interactions and chemotactic guidance could probably promote glioma progression. 39
Regression analysis between cell infiltration enrichment scores and the ECM scores was also performed in the present study. The enrichment scores of several cells were identified to correlate well with the ECM score. Among those cells, monocytes, M0 macrophages and M1 macrophages were found to be associated with the glioma grades, which were increasingly infiltrated in WHO IV gliomas. Our findings are in an agreement with the recent study that the differentiations of monocyte-derived macrophages are affected by the glioma grade. 40 Survival analysis showed that patients with higher M0 macrophages, M1 macrophages and monocytes enrichment scores associated with worse survivals.
Subgroup analysis suggested that increased M1 macrophages enrichment score was correlated with a poor prognosis in WHO IV gliomas or GBM patients. Recent study showed that the failure of anti-PD-1 treatment in GBM was probably owing to the CD68+ macrophages. 41 This could also be at least one of the reasons that GBM patients with high M1 infiltration levels had a lower survival rate. Glioma patients with IDH mutation are usually with a better survival. 42 Macrophages were reported to be enriched in IDH-mutant patients, 43 but the same result has not been reported in IDH-wildtype patients. In our study, for IDH-wildtype GBM patients, M1 macrophages was identified as an unfavorable factor for the prognosis. Likewise, the same trend was also observed in IDH-wildtype GBM patients who received radiotherapy. Together, our findings may shed the light on M1 macrophages targeted therapy as a potential sensitization for radiotherapy, as evidenced also by in vitro experiments 44 and in vivo mouse models. 45
In conclusion, our study demonstrated that the infiltration status of M1 macrophages correlated well with pathological stages of glioma. The relative abundance of M1 macrophages predicted robustly for the survival performance of GBM patients, and particularly for IDH wildtype patients with or without radiotherapy. Our study will facilitate more precise molecular and immunological surrogating based stratifications and optimization of treatment strategies for glioma patients. However, further validations in different populations as well as mechanistic studies are highly warranted.
Supplemental Material
Supplemental Material, Glioma_M1_Suppl_V8_upload - Increased M1 Macrophages Infiltration Correlated With Poor Survival Outcomes and Radiation Response in Gliomas
Supplemental Material, Glioma_M1_Suppl_V8_upload for Increased M1 Macrophages Infiltration Correlated With Poor Survival Outcomes and Radiation Response in Gliomas by Zhaoming Zhou, Lei Wen, Mingyao Lai, Changguo Shan, Jian Wang, Rong Wang, Hainan Li, Longhua Chen, Linbo Cai, Meijuan Zhou and Cheng Zhou in Dose-Response
Footnotes
Authors’ Note
Zhaoming Zhou and Lei Wen contributed equally to this article.
Declaration of Conflicting Interests
The author(s) declared no potential conflicts of interest with respect to the research, authorship, and/or publication of this article.
Funding
The author(s) disclosed receipt of the following financial support for the research, authorship, and/or publication of this article: This work was supported by the National Natural Science Foundation of China (NSFC) (No. 81703166), Natural Science Foundation of Guangdong Province (No. 2019A1515011943), China Postdoctoral Science Foundation (No. 2019M662974) and Medical Scientific Research Foundation of Guangdong Province of China (No. A2020499 and No. A2020505). The funders had no role in study design, data collection and analysis, decision to publish or preparation of the manuscript.
Supplemental Material
Supplemental material for this article is available online.
References
Supplementary Material
Please find the following supplemental material available below.
For Open Access articles published under a Creative Commons License, all supplemental material carries the same license as the article it is associated with.
For non-Open Access articles published, all supplemental material carries a non-exclusive license, and permission requests for re-use of supplemental material or any part of supplemental material shall be sent directly to the copyright owner as specified in the copyright notice associated with the article.