
Abstract
Background
Phenotypic age acceleration (PhenoAgeAccel) reflects biological aging, with higher values indicating faster aging. While linked to adverse outcomes in the general population, its relation to mortality in asthma remains unclear.
Methods
We analyzed 3817 adults with physician-diagnosed asthma from NHANES (1999-2010, 2015-2018) with mortality follow-up through 2019. PhenoAgeAccel was calculated from clinical biomarkers, and associations with all-cause and cardiovascular mortality were assessed using weighted Cox models, restricted cubic splines, and subgroup/sensitivity analyses.
Results
During a median follow-up of 13.2 years, higher PhenoAgeAccel was independently associated with greater risks of all-cause mortality (HR = 1.03, 95% CI: 1.03-1.04) and cardiovascular mortality (HR = 1.02, 95% CI: 1.01-1.04). Compared with the lowest quartile, participants in the highest had a 3.42-fold higher all-cause and 2.72-fold higher cardiovascular mortality risk. Associations were nonlinear for all-cause but roughly linear for cardiovascular mortality, and consistent across subgroups and sensitivity tests.
Conclusions
Higher PhenoAgeAccel was independently associated with increased risks of all-cause and cardiovascular mortality among adults with asthma, indicating that biological aging markers may serve as useful tools for risk assessment and individualized care.

Introduction
Asthma is a prevalent chronic respiratory disorder, currently affecting nearly 300 million people worldwide and approximately 8% of adults in the United States.1,2 Despite advances in therapeutic strategies, individuals with asthma remain at substantially elevated risk of comorbidities such as obesity, cardiovascular disease, and diabetes, which markedly increase the probability of premature mortality.3-5 Conventional methods of risk stratification remain inadequate, emphasizing the need for novel prognostic biomarkers.
Unlike chronological age, biological aging captures the cumulative decline in physiological integrity and is increasingly recognized as a major determinant of chronic disease burden and mortality risk. 6 Phenotypic age, derived from routine clinical biomarkers, has been validated as a reliable indicator of biological aging. 7 The residual difference between phenotypic age and chronological age, termed phenotypic age acceleration (PhenoAgeAccel), reflects whether an individual’s biological aging rate is faster or slower than expected. Previous research has demonstrated that higher PhenoAgeAccel values are associated with increased all-cause and cause-specific mortality,8,9 as well as cardiometabolic dysfunction and functional decline. 10
Asthma exhibits several overlapping pathophysiological processes with accelerated aging, including persistent inflammation, oxidative stress, and immune dysregulation.11-13 Moreover, evidence indicates that individuals with asthma present with shorter telomere length and accelerated epigenetic aging.14,15 Nevertheless, the prognostic significance of PhenoAgeAccel within asthma populations has not yet been clarified.
In this study, we employed data from the nationally representative U.S. National Health and Nutrition Examination Survey (NHANES) to investigate the association between PhenoAgeAccel and the risks of all-cause and cardiovascular mortality in individuals with asthma. We hypothesized that PhenoAgeAccel would be significantly correlated with these mortality outcomes in a dose–response manner. Our findings are expected to enhance understanding of biological aging in asthma and contribute to the development of novel prognostic tools for clinical practice, ultimately improving long-term disease management.
Method
Study Population
NHANES is a continuous, nationwide survey assessing the health and nutritional status of the civilian, non-institutionalized U.S. population. It combines standardized interviews, thorough physical examinations, and laboratory testing. To ensure national representativeness, NHANES utilizes a complex, multistage, stratified probability sampling design. 16 The study protocol was approved by the Research Ethics Review Board of the National Center for Health Statistics (NCHS), and all participants provided written informed consent. NHANES datasets are publicly accessible (accessed July 12, 2025; URL: https://www.cdc.gov/nchs/nhanes/). The present study adheres to the Strengthening the Reporting of Observational Studies in Epidemiology (STROBE) reporting guidelines.
For this analysis, we included data from 8 survey cycles conducted between 1999-2010 and 2015-2018, focusing on adults aged 20 years or older. These cycles were selected based on the availability of biomarkers required to calculate phenotypic age. We included participants aged ≥20 years who reported a physician diagnosis of asthma. Exclusion criteria were missing parameters for phenotypic age calculation, incomplete mortality follow-up, or missing key covariates.
Assessment of PhenoAgeAccel
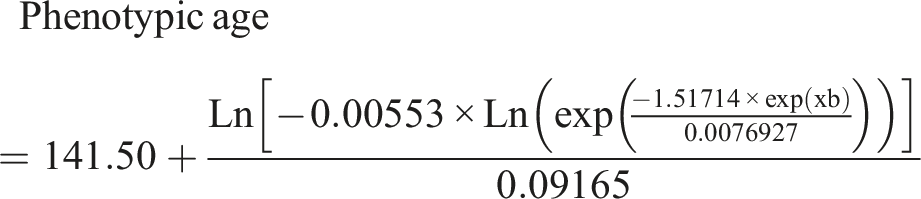
Phenotypic Age is derived by combining an individual’s chronological age with a panel of specific biomarkers associated with aging. These biomarkers include serum albumin, creatinine, glucose, C-reactive protein, lymphocyte percentage, mean corpuscular volume, red cell distribution width, alkaline phosphatase, and white blood cell count.17,18 PhenoAgeAccel is defined as the residual obtained from regressing phenotypic age on chronological age, expressed in years. This residual reflects the discrepancy between biological and chronological age, with positive values indicating accelerated biological aging and negative values suggesting a slower aging process.
The formula used to calculate phenotypic age is presented as follows:
Definition of Asthma
In NHANES, participants were defined as having asthma if they reported a physician-diagnosed condition and answered “yes” to the question, “Have you ever been told by a doctor that you have asthma?”. 19
Assessment of Mortality
Mortality status was determined by linking NHANES records to the National Death Index (NDI) through December 31, 2019. Causes of death were coded according to the International Classification of Diseases, Tenth Revision (ICD-10). All-cause mortality encompassed deaths from any cause, whereas cardiovascular mortality was limited to deaths from heart disease (I00–I09, I11, I13, I20–I51) or cerebrovascular disease (I60–I69). Follow-up duration was measured from the baseline examination date to the date of death or the end of follow-up.
Covariates Definitions
Covariates were selected according to previous literature and clinical relevance,19,20 including age, sex, race/ethnicity (non-Hispanic White, non-Hispanic Black, Mexican American, or other), education level (<9 years, 9-12 years, or >12 years), household income, smoking, alcohol consumption, body mass index (BMI), cardiovascular disease (CVD), hypertension, and diabetes. Income was stratified by poverty income ratio (PIR) as low (≤1.3), middle (>1.3-3.5), or high (>3.5). 21 Smoking and drinking were categorized as never, former, or current.22,23 BMI was calculated from standardized height and weight. CVD was defined as a history of coronary heart disease, angina, stroke, myocardial infarction, or heart failure. 19 Hypertension was identified by self-report, antihypertensive medication use, or an average blood pressure ≥140/90 mmHg across 3 standardized readings. 24 Diabetes was determined from self-report, antidiabetic medication use, or laboratory evidence (random plasma glucose ≥11.1 mmol/L, fasting plasma glucose ≥7.0 mmol/L, or glycated hemoglobin >6.5%). 25
Statistical Analysis
Sampling weights provided by NCHS were applied to account for the complex multistage probability sampling design. 16 For the 1999-2002 cycle, the weight was calculated as two-eighths of the 4-year Mobile Examination Center (MEC) sample weight; for the 2003-2010 and 2015-2018 cycles, it was one-eighth of the 2-year MEC weight. Baseline characteristics were summarized overall and by quartiles of PhenoAgeAccel (Q1 < −6.78; Q2: −6.78 to < −1.99; Q3: −1.99 to <4.29; Q4 ≥ 4.29). Continuous variables were expressed as weighted means with standard errors (SE), whereas categorical variables were presented as unweighted counts and weighted proportions. Differences across quartiles were evaluated using adjusted linear regression models for continuous variables and chi-square tests for categorical variables.
Associations between PhenoAgeAccel and mortality outcomes were examined using Cox proportional hazards models. The unadjusted model included no covariates. Model 1 adjusted for age, sex, race/ethnicity, education, and poverty income ratio, while Model 2 further incorporated smoking, alcohol consumption, BMI, CVD, diabetes, and hypertension. PhenoAgeAccel was analyzed both as a continuous variable (per 1-unit increase) and as categorical quartiles. Outcomes included all-cause mortality and cardiovascular mortality. Potential nonlinear associations were explored with restricted cubic spline (RCS) regression, and threshold effect analysis was performed to identify inflection points. Kaplan–Meier curves were constructed to illustrate cumulative mortality across quartiles, and differences were assessed by stratified log-rank tests. Numbers at risk were reported at 0, 40, 80, 120, 160, 200, and 240 months.
Subgroup analyses were conducted to evaluate the associations across different populations, and results were visually summarized in forest plots. Sensitivity analyses included (1) excluding participants with extreme PhenoAgeAccel values (upper and lower 1%), (2) repeating the models without applying survey weights, and (3) handling missing data using multiple imputation by chained equations (MICE). All analyses were performed using R software (version 4.2.2) and Free Statistics software (version 2.2). A two-sided P-value <0.05 was considered statistically significant.
Results
Study Population
Among 43 752 NHANES participants aged ≥20 years (1999-2010, 2015-2018), 38 147 without asthma were excluded, leaving 5605 participants. After further excluding 874 with missing phenotypic age data, 8 with incomplete mortality information, and 906 with missing covariates, the final analytic sample comprised 3817 participants (Figure 1). Flowchart of Participant Selection From the US NHANES
Baseline Characteristics
Baseline Characteristics of Study Individuals According to Quartiles of the PhenoAgeAccel Index. Categorical Variables Were Presented as Unweighted Frequencies With Weighted Percentages, While Continuous Variables Were Expressed as Means With Standard Errors (SE). Group Comparisons Were Performed Using Linear Regression Models for Continuous Variables and Chi-Square Tests for Categorical Variables

Association Between PhenoAgeAccel and All-Cause Mortality in Asthma
Multivariable Cox Regression Analyses of the Association Between PhenoAgeAccel and All-Cause and CVD Mortality in Patients With Asthma. Crude Model: Unadjusted Model; Model 1: Adjusted for Age, Sex, Race/Ethnicity, Education Level, and Household Income; Model 2: Adjusted for Covariates in Model 1 Plus Smoking Status, Alcohol Consumption, BMI, CVD, Diabetes, and Hypertension

Abbreviations: HR, Hazard Ratio; CI, Confidence Interval; Q, Quartile.
Threshold Effect Analysis of the Association Between PhenoAgeAccel and the Risk of All-Cause Mortality in Patients With Asthma

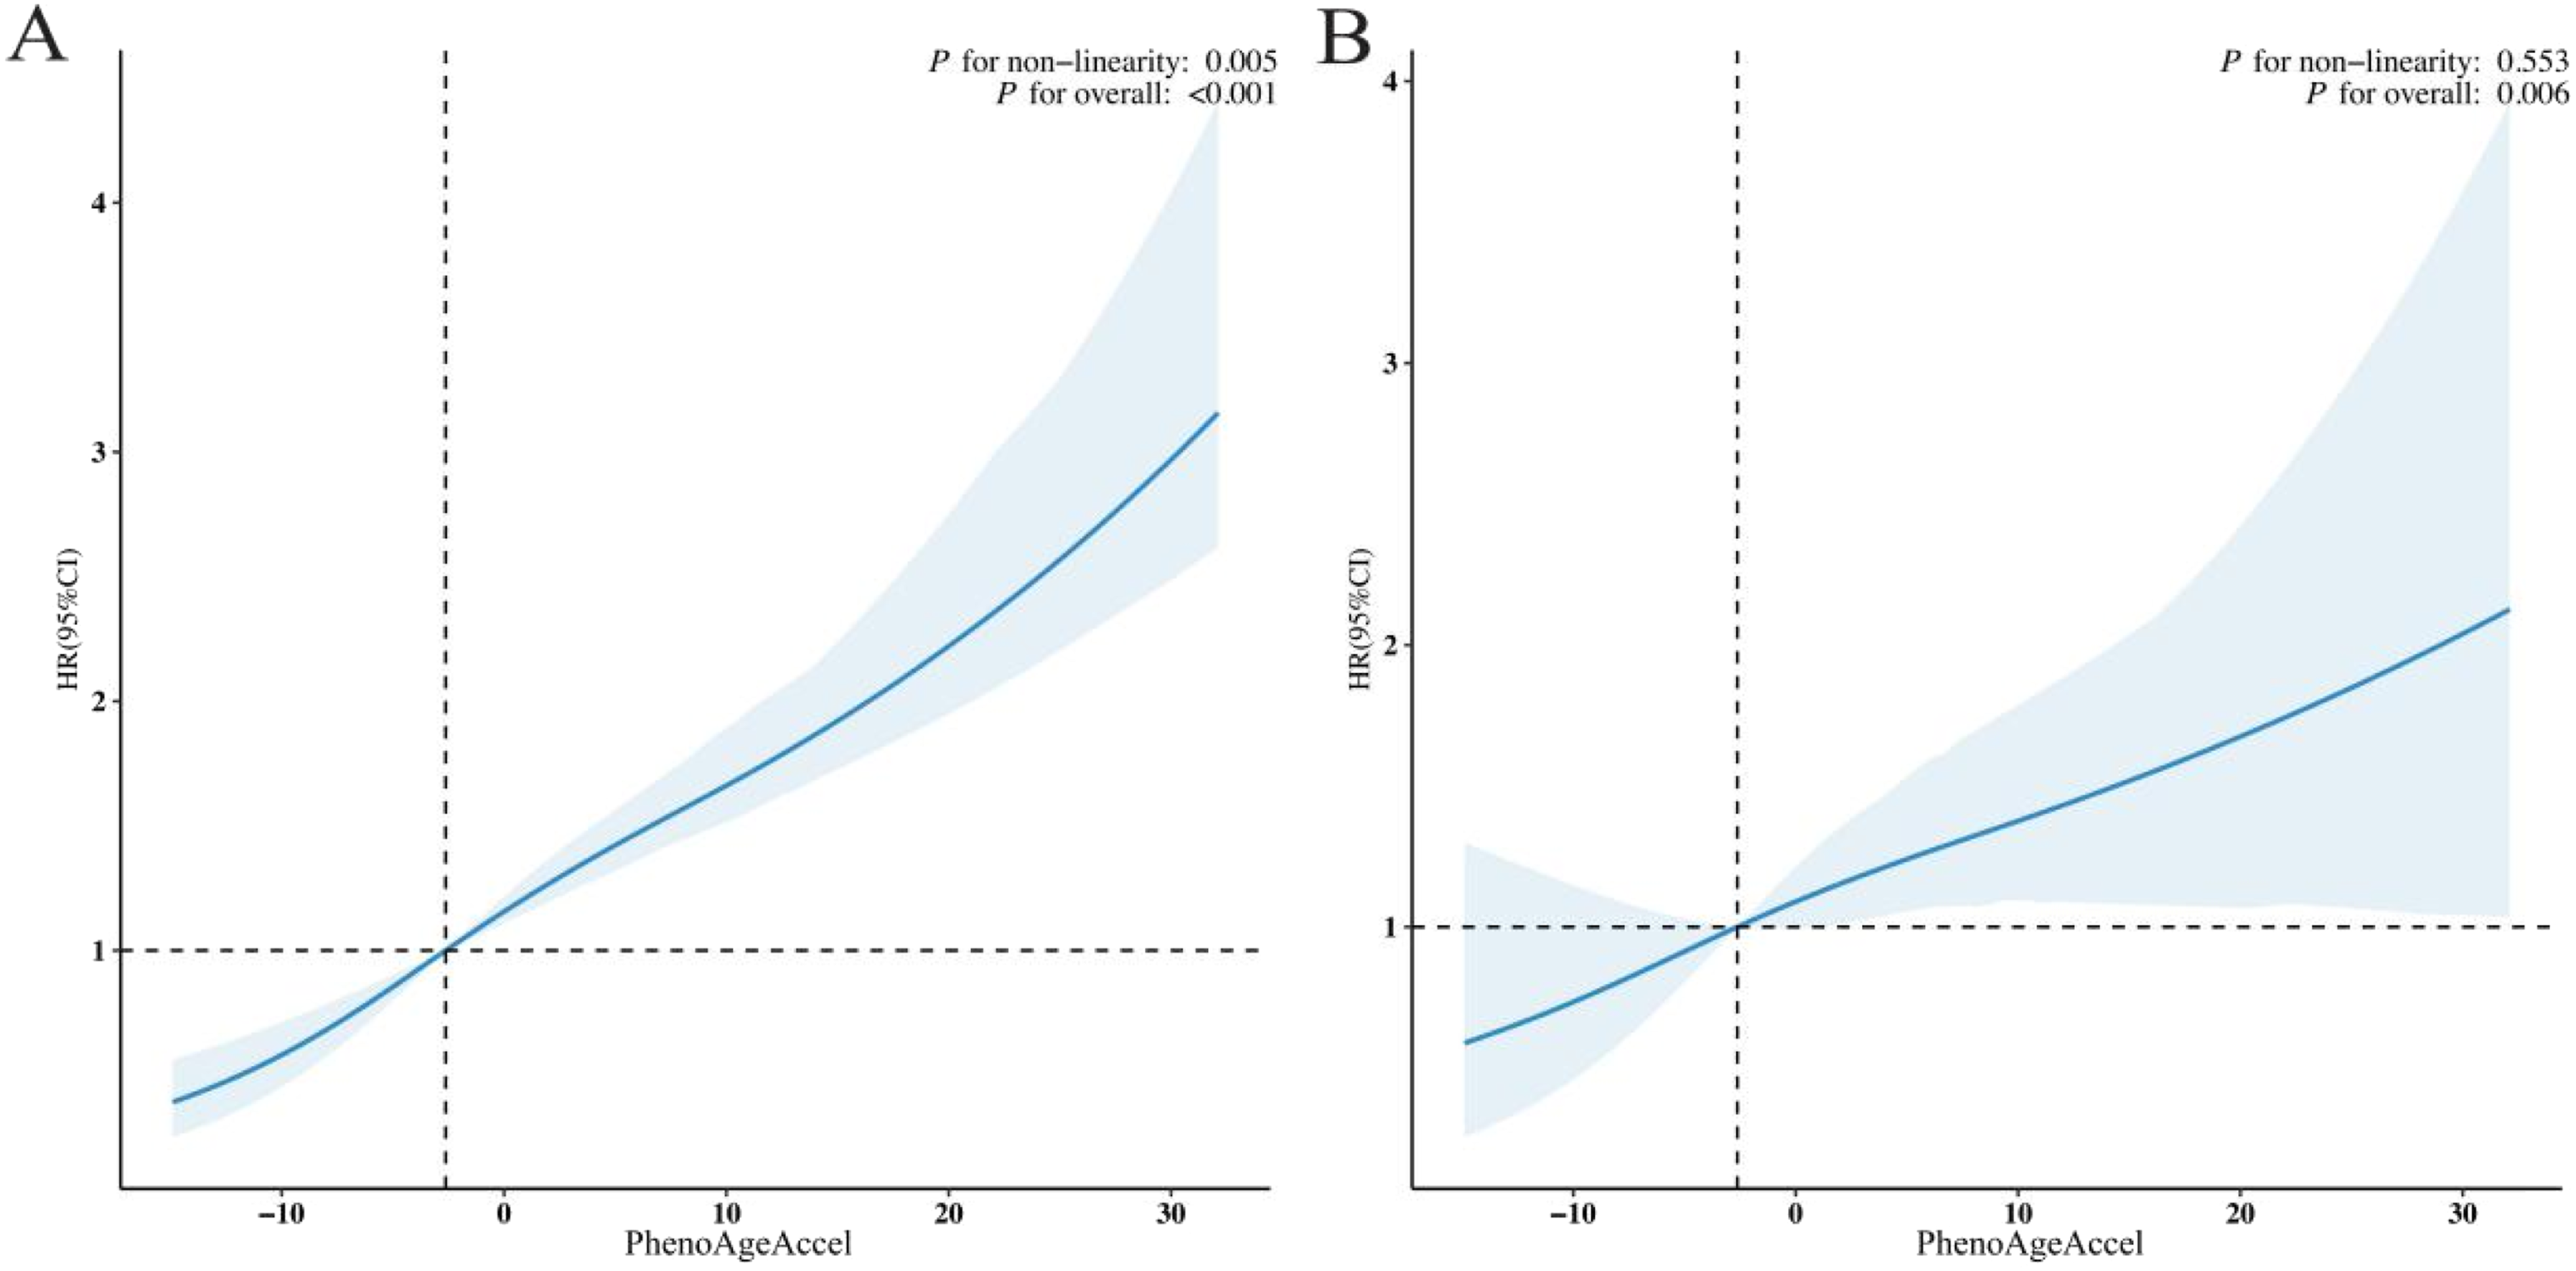
Restricted Cubic Spline Regression Analysis Depicting the Dose–Response Associations of PhenoAgeAccel With (A) All-Cause Mortality and (B) Cardiovascular Mortality Among Patients With Asthma
Association Between PhenoAgeAccel and Cardiovascular Mortality in Asthma
In the fully adjusted Cox regression model (Table 2), elevated PhenoAgeAccel was independently linked to a higher risk of cardiovascular mortality (HR = 1.02; 95% CI: 1.01-1.04; P < 0.001). Relative to Q1, individuals in Q4 exhibited more than twice the risk (HR = 2.72; 95% CI: 1.34-5.52). Although the risk estimate for Q3 was not statistically significant (HR = 1.24; 95% CI: 0.56-2.74), the overall dose–response trend across quartiles remained significant (P for trend = 0.017). Restricted cubic spline modelling (Figure 2B) indicated a significant overall association (P overall = 0.006) and no evidence of non-linearity (P for non-linearity = 0.553), supporting an approximately linear relationship between PhenoAgeAccel and cardiovascular mortality.
Survival Analysis
Kaplan–Meier analysis (Figure 3) showed progressively lower survival across increasing PhenoAgeAccel quartiles. Participants in the highest quartile (Q4) had the lowest survival for both all-cause (Figure 3A) and cardiovascular mortality (Figure 3B), with significant differences among quartiles (log-rank P < 0.001), indicating a graded increase in mortality risk with higher PhenoAgeAccel. Kaplan–Meier Survival Curves Illustrating Time-Dependent Differences in (A) All-Cause Mortality and (B) Cardiovascular Mortality Across Groups Stratified by PhenoAgeAccel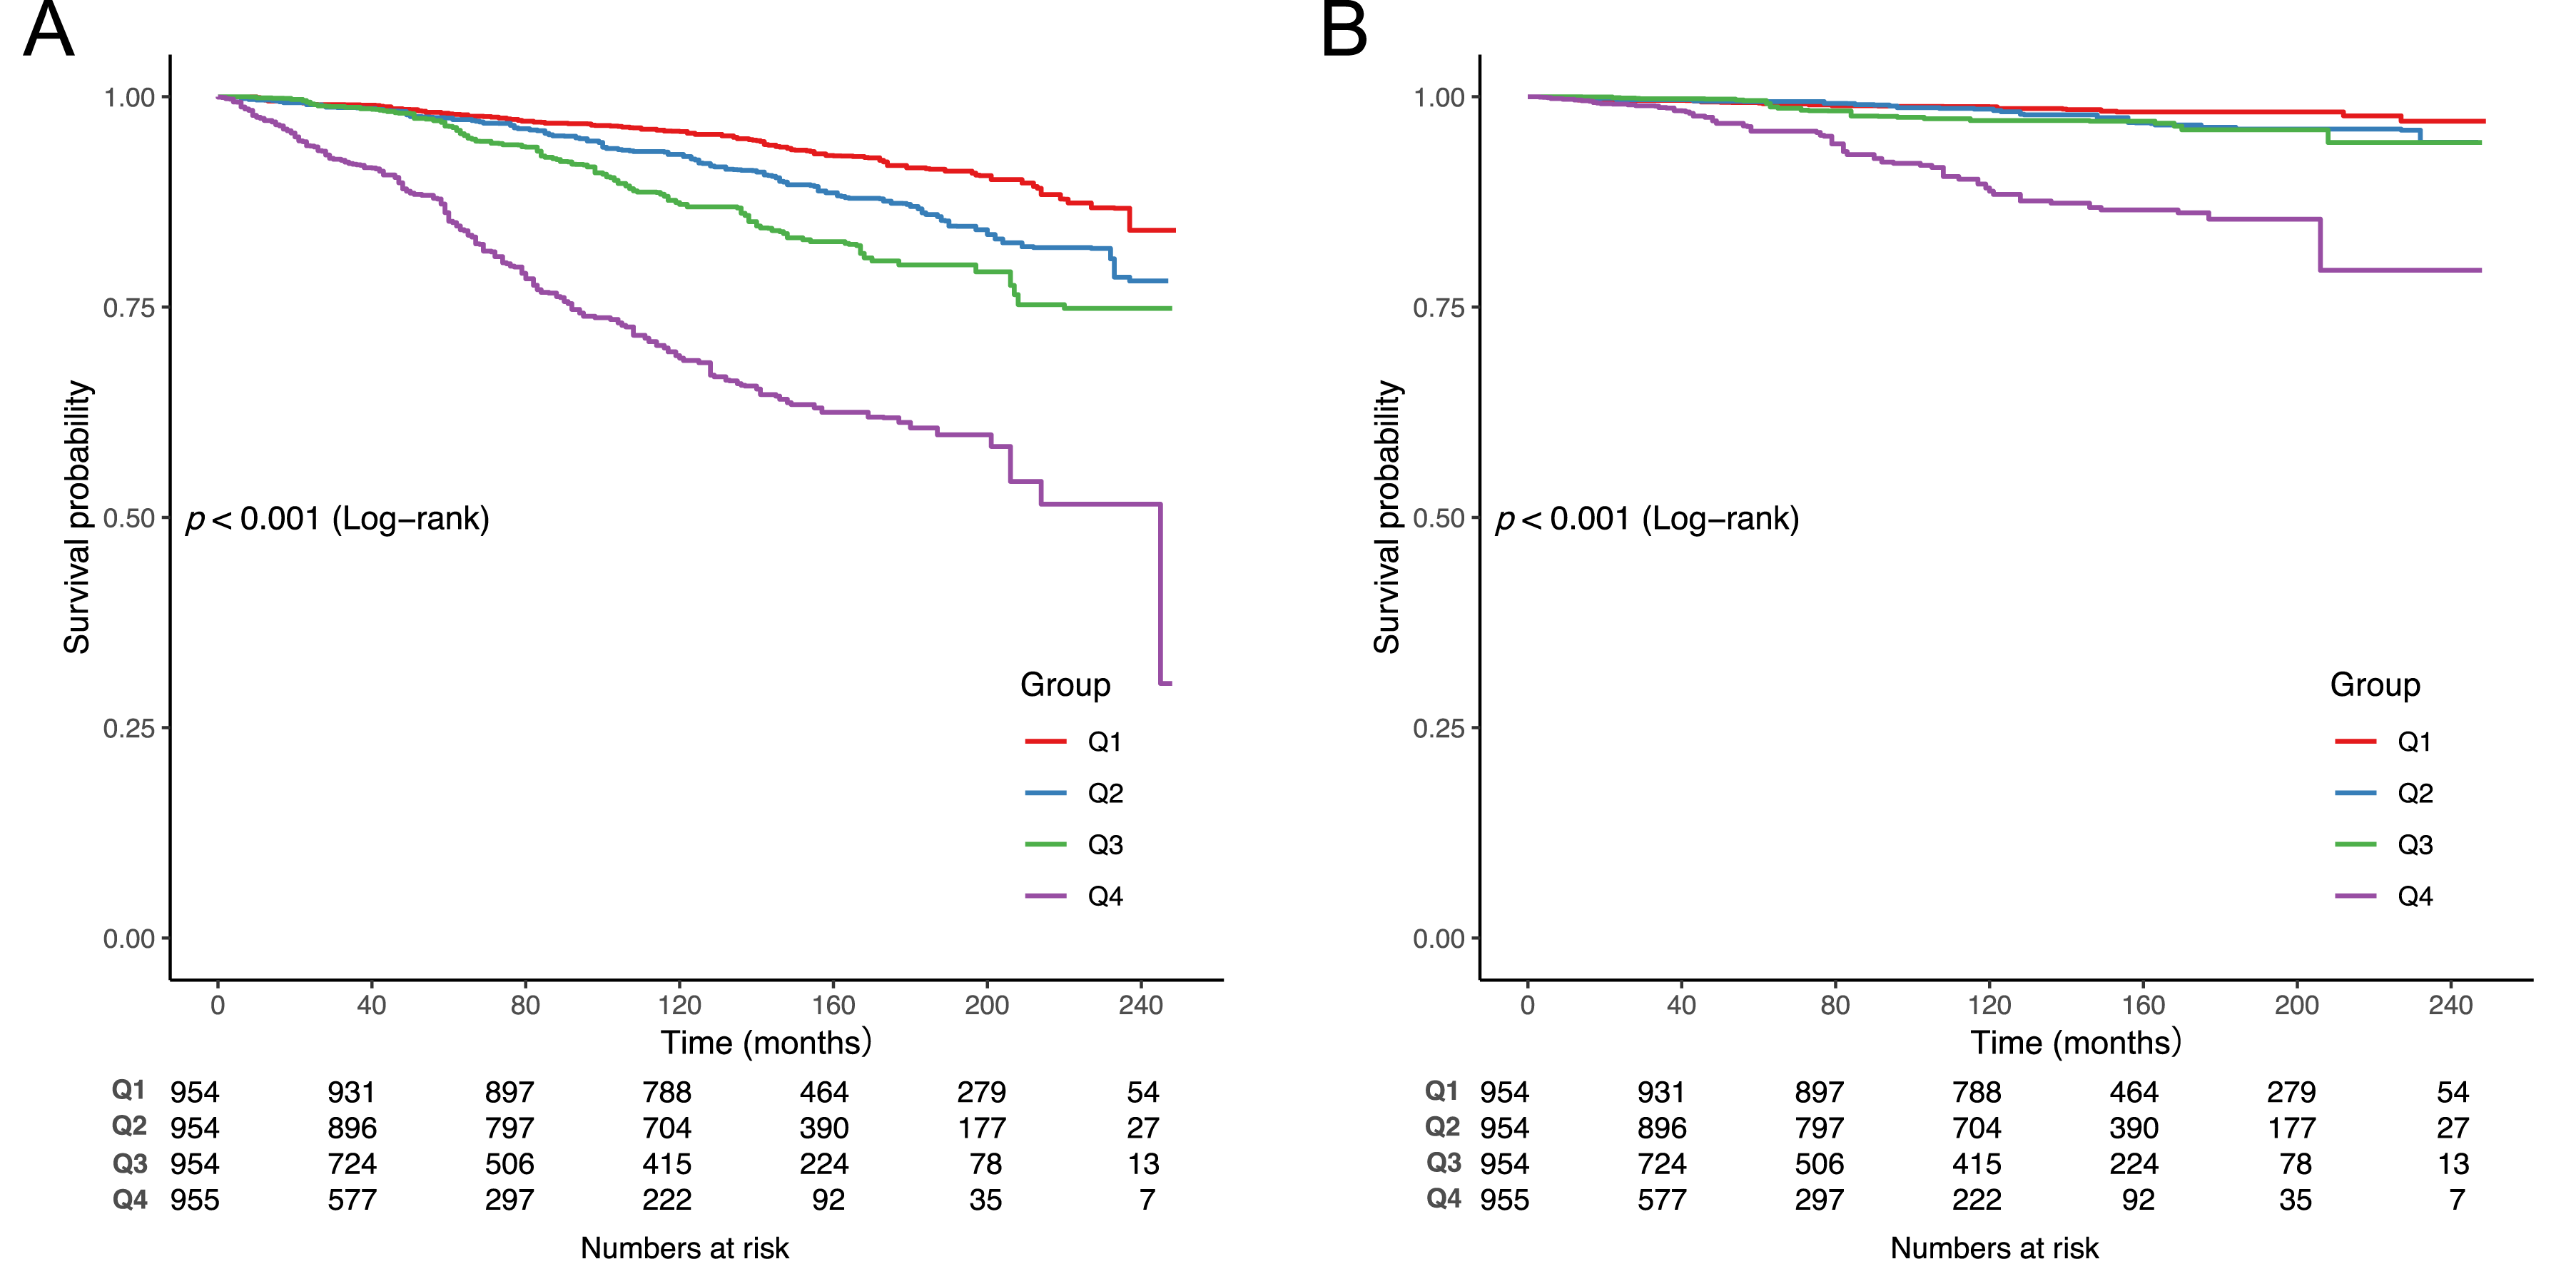
Subgroup Analyses
Subgroup analyses demonstrated that elevated PhenoAgeAccel was consistently linked to higher all-cause (Figure 4A) and cardiovascular mortality (Figure 4B) across categories of age, sex, race/ethnicity, BMI, smoking, and alcohol consumption. While modest variations in hazard ratios were observed among subgroups, the overall direction of association was uniform. Importantly, no significant effect modification was detected (all P for interaction >0.05), indicating that the relationship between PhenoAgeAccel and mortality risk was broadly stable across demographic and lifestyle characteristics. Stratified Analyses Showing the Associations of PhenoAgeAccel With (A) All-Cause Mortality Risk and (B) Cardiovascular Mortality Risk Among Patients With Asthma
Sensitivity Analysis
Sensitivity Analysis of the Association Between PhenoAgeAccel and All-Cause Mortality in Patients With Asthma. Crude Model: Unadjusted Model; Model 1: Adjusted for Age, Sex, Race/Ethnicity, Education Level, and Household Income; Model 2: Adjusted for Covariates in Model 1 Plus Smoking Status, Alcohol Consumption, BMI, CVD, Diabetes, and Hypertension

Abbreviations: HR, Hazard Ratio; CI, Confidence Interval; Q, Quartile.
Sensitivity Analysis of the Association Between PhenoAgeAccel and CVD Mortality in Patients With Asthma. Crude Model: Unadjusted Model; Model 1: Adjusted for Age, Sex, Race/Ethnicity, Education Level, and Household Income; Model 2: Adjusted for Covariates in Model 1 Plus Smoking Status, Alcohol Consumption, BMI, CVD, Diabetes, and Hypertension

Abbreviations: HR, Hazard Ratio; CI, Confidence Interval; Q, Quartile.
Discussion
In this nationally representative cohort of U.S. adults with asthma, elevated PhenoAgeAccel was consistently linked to higher risks of all-cause and cardiovascular mortality after full adjustment for demographic, socioeconomic, lifestyle, and clinical variables. These findings underscore the potential utility of PhenoAgeAccel as a prognostic biomarker for mortality among individuals with asthma. The threshold analysis further indicated that intervention benefits may be maximized when PhenoAgeAccel is below 10.83.
Our findings extend prior work linking biological age acceleration to adverse health outcomes. Previous studies in the general population have demonstrated that PhenoAgeAccel predicts all-cause mortality, cardiovascular disease, and multimorbidity.7,26,27 However, evidence in asthma populations has been limited. Li et al reported that each unit increase in intrinsic epigenetic age acceleration (IEAA) was associated with a 5.1% higher risk of allergic asthma (inverse-variance weighted [IVW] odds ratio [OR] = 1.051, P = 0.025). 28 Similarly, Belsky et al. observed that leukocyte telomere length was significantly shorter in individuals with asthma compared with non-asthmatic controls (β = −0.31, P < 0.001). 14 Both findings suggest premature aging phenotypes among asthma patients. Yet, the direct relationship between PhenoAgeAccel and mortality in asthma had not been clearly established. Our study fills this gap, demonstrating that PhenoAgeAccel provides valuable prognostic information for survival in asthma.
The biological pathways linking PhenoAgeAccel to mortality risk in asthma are likely multifactorial. Asthma is characterized by chronic systemic inflammation, which may induce oxidative stress, mitochondrial dysfunction, and cellular senescence, thereby accelerating biological aging.29-31 Oxidative stress enhances inflammatory signaling through activation of nuclear factor erythroid 2–related factor 2 (Nrf2), nuclear factor kappa B (NF-κB), and mitogen-activated protein kinase (MAPK) pathways. 32 Mitochondrial dysfunction leads to excessive reactive oxygen species (ROS) generation, aggravating local tissue damage. 33 In addition, persistent low-grade inflammation may disrupt metabolic and immune homeostasis, further promoting systemic aging. 34 Elevated C-reactive protein and leukocyte counts—key components of PhenoAge—reflect this inflammatory burden. 35 Asthma has also been linked to endothelial dysfunction, arterial stiffness, and elevated cardiovascular risk,36,37 which may explain the strong association with cardiovascular mortality. Furthermore, long-term glucocorticoid exposure, frequently used in asthma management, may exacerbate metabolic disturbances and accelerate aging-related processes. 38 Together, these mechanisms provide a biologically plausible explanation for the observed associations between phenotypic aging and poor outcomes in asthma.
This study also has important strengths. First, the large sample size increased statistical power and enhanced the generalizability of our findings to a broader asthma population. Second, the use of a composite biomarker to capture biological aging allowed for a more comprehensive assessment than reliance on single markers. Third, the application of advanced statistical approaches, including spline modeling and threshold analyses, enabled detailed evaluation of dose–response patterns. Nonetheless, several limitations must be acknowledged. Asthma diagnosis was based on self-report, raising the possibility of misclassification. The absence of information on asthma severity and exacerbation history may have introduced unmeasured confounding, although subgroup and sensitivity analyses supported the robustness of our results. Additionally, PhenoAgeAccel was calculated only at baseline, limiting our ability to assess longitudinal changes. Finally, as PhenoAgeAccel is phenotype-based and does not incorporate genomic or multi-omics data, causal inferences require further validation in experimental models.
Conclusion
In summary, this study provides novel evidence that elevated PhenoAgeAccel is strongly associated with increased risks of all-cause and cardiovascular mortality in individuals with asthma. These findings suggest that PhenoAgeAccel may serve as an important independent prognostic biomarker in this population. Future research should aim to elucidate the underlying mechanisms and determine whether interventions targeting biological aging can improve survival outcomes in asthma.
Footnotes
Acknowledgement
We would like to express our sincere appreciation to the participants and staff of the National Health and Nutrition Examination Survey for their valuable contributions.
Ethical Considerations
The Ethics Review Board of the National Center for Health Statistics approved the human studies. The studies adhered to local legislation and institutional requirements. Participants gave written informed consent for study involvement.
Consent to Participate
All individuals provided written consent.
Author Contributions
Cuili Lin collected the relevant data; Yanyan Ye performed the statistical analysis and data visualization; Huijuan Cheng drafted the initial manuscript, and Feng Lu subsequently revised it. All authors contributed to the discussion and approved the final version of the manuscript.
Funding
The authors received no financial support for the research, authorship, and/or publication of this article.
Declaration of Conflicting Interests
The authors declared no potential conflicts of interest with respect to the research, authorship, and/or publication of this article.