
Abstract
Objective
High-throughput gene expression analysis represents a promising approach for evaluating irradiation doses in vitro. This study aimed to identify preferred reference genes for normalizing RT-qPCR data in human peripheral blood following X-ray irradiation.
Methods
We assessed the stability of GAPDH, 18S rRNA, UBC, HPRT, DPM1, ITFG1, MRPS5, and ACTB, which are commonly utilized in radiation biodosimetry studies. Three whole blood samples from healthy donors were divided into three culture time groups (2, 12, and 24 hours) and subjected to X-ray doses of 0, 0.5, 1.2, and 3.5 Gy, resulting in a total of 12 subgroups. NormFinder, geNorm, BestKeeper, and ΔCt were employed to evaluate the stability of the candidate genes. RefFinder was utilized to comprehensively rank the candidates and identify suitable reference genes.
Results
The preferred reference genes identified were UBC, HPRT, and GAPDH for 2-hour culture time; for 12 hours, UBC, HPRT, and 18S rRNA were preferred; and for 24 hours, 18S rRNA, MRPS5, and GAPDH were preferred.
Conclusion
This study presents novel findings of reference genes suitable for normalizing RT-qPCR data following X-ray irradiation in human peripheral blood across three distinct culture periods. It offers valuable insights for the selection of reference genes in radiation biodosimetry research.

Introduction
With the development and application of the nuclear energy industry and radiation technology, the number of people involved in radiation exposure has increased rapidly. Currently, the increasing possibility of nuclear war and the contamination of the environment with nuclear wastewater pose a serious threat to the public. When an acute nuclear accident occurs, radiation biodosimetry is used to estimate the irradiation dose of the people with exposure, so the rapid and high-throughput method of dose estimates can quickly detect the exposure dose of the mass crowd to achieve rapid triage and medical treatment in time. Currently, the traditional techniques of dose estimates for radiation include chromosome aberration analysis (DCA), cytokinesis-block micronucleus assay (CBMN), fluorescence in situ hybridization (FISH) and premature chromosome condensation analysis (PCC). 1 However, these dose estimate methods are challenging to meet the requirements of fast and high throughput except for gene expression analysis. It is a key direction in establishing a gene combination expression model for estimating exposure dose based on relative expression level in human peripheral blood in the study of radiation biodosimetry.1-5
When the model was selected, reverse transcription quantitative real-time PCR (RT-qPCR) was a common method for verifying and estimating the dose. 6 The Minimum Information for Publication of Quantitative Real-Time PCR Experiments (MIQE) guidelines state that the optimal number and choice of reference genes must be experimentally decided. It is not acceptable to normalize against a single reference gene unless researchers present evidence that verifies its invariance. 7 Generally, the use of less than three reference genes is inadvisable, and any rationale for selecting a reduced number must be explicitly articulated. 6 The reliability and credibility of RT-qPCR data depend on effective normalization, of which reference gene selection is the core link. Stable reference genes need to keep low variability expression in all experimental samples, and inappropriate reference genes will directly lead to data bias. Unfortunately, commonly used reference genes often have variability under specific experimental conditions. The critical screening process is easily overlooked by researchers, which seriously affects the credibility.7-9 In recent studies, different research teams have used 18S rRNA, ACTB, HPRT, GAPDH, and B2M for data normalization for radiosensitivity gene expression analysis of whole blood samples.1,2,10-13 In addition, a review by the Running the European Network of Biological and Retrospective Physical Dosimetry (RENEB) mentioned reference genes such as UBC, ITFG1, DPM1, MRPS5, 18S rRNA, GAPDH, and HPRT and compared the stability of different combinations of candidate reference genes on different platforms. 14 In conclusion, the choice of reference genes varied among the research groups without any explanation, leading to confusion as to how to correctly select the reference genes.
Stability analysis validates the expression of reference genes in human peripheral blood samples to identify preferred reference genes under irradiation conditions. This study aimed to compare the stabilities of candidates on peripheral blood samples in three culture times (2 hours, 12 hours, 24 hours) under different X-ray radiation exposure and select the preferred genes from eight common independence reference genes (GAPDH, 18S rRNA, UBC, HPRT, DPM1, ITFG1, MRPS5, ACTB). No interaction between the eight candidate genes. 2 hours, 12 hours, and 24 hours are commonly used as culture time windows in radiation biodosimetry studies to assess short, medium and long term expression of radiosensitivity genes. X-Ray doses of 0 Gy, 0.5 Gy, 1.2 Gy and 3.5 Gy correspond to clinically relevant dose categories of unexposed, extra low exposed, low exposed (minor acute health effects expected) and high exposed (needing early intensive medical healthcare). 14 Four methods (NormFinder, geNorm, BestKeeper and ΔCt) were adopted to estimate the expression stability of each reference gene, and RefFinder was used to identify preferred genes for normalization.
Materials and Methods
Collection, Irradiation and Culture of Peripheral Blood Samples
The study was conducted from June 2024 to December 2024. Peripheral blood samples (6 mL each) were collected from three randomly selected healthy donors (2 males and 1 female, aged 29-39 years) who underwent physical examinations at the Shenzhen Prevention and Treatment Center for Occupational Disease. Donors who were minors (under 18 years), elderly (60 years or older), had infectious diseases, or lacked cognitive ability were excluded from the study. Each individual contributed 6 mL of whole blood using a vacuum collection tube (containing sodium heparin). Three whole blood samples from healthy donors were divided into three culture time groups (2 hours, 12 hours, 24 hours) exposed to X-ray doses of 0, 0.5, 1.2, and 3.5 Gy, respectively, for a total of 12 subgroups with three replicates each. Fresh whole blood samples were placed at room temperature (26°C) for three hours and pre-treated, which were divided into 1.5 mL RNase-free EP tubes with 500 μL whole blood samples per tube according to exposure dose (0, 0.5, 1.2, and 3.5 Gy) and culture time after irradiation (2 hours, 12 hours, and 24 hours). The study was conducted at the Pathology and Toxicology Institute of the Shenzhen Prevention and Treatment Center for Occupational Diseases, Shenzhen, China. The study was approved by the institute’s ethics committee.
Samples were irradiated to 0, 0.5, 1.2, and 3.5 Gy X-ray doses (225.0 kVp, 1.6 Gy/min) with an X-ray irradiator at room temperature at the Southern University of Science and Technology. After exposure, the samples were added to a centrifuge tube with 1.0 mL RPMI1640,1X medium (with L-glutamine, 10% FBS, 1% HEPES, 100 IU/ml penicillin and streptomycin) and cultured in a constant temperature incubator at 37°C and 5% CO2 for 2 hours, 12 hours, and 24 hours at an inclined tilt. RNA extraction of whole blood samples was performed after culture. The irradiation parameters of the X-ray irradiator are shown in Table S1.
Primer Efficiency
The efficiency of each pair of primers of the reference gene was tested. We performed serial gradient dilution on the cDNA samples. Six samples that generated by 10-fold serial dilution starting from an initial concentration of 100 ng were used as templates for qPCR analysis. We established standard curves by plotting the logarithm of the cDNA starting quantity against the Cq values, using the linear regression method. For genes with a relatively high initial Cq value before dilution, we only diluted them 4 to 5 times (Cq > 40 after six dilutions), when making the standard curve. The primer efficiency was calculated using the formula: E = 10 (-1/K) - 1, where “E” represents reaction efficiency and “K” signifies the slope of the standard curve.
RNA Extraction and Reverse Transcription
Total RNA was extracted from whole blood samples using Bioer automatic nucleic acid extraction and purification instrument (NPA-32E) according to the instructions in its user manual. The pre-packaged MagaBio plus Whole Blood RNA Extraction Kit (BSC113S1E) was used to automate nucleic acid extraction experiments, according to the setup program (Tables S2, S3). Before reverse transcription, we initially assess RNA integrity (RIN ≥7.3).
Then, cDNA was synthesized from 8 μL of RNA per sample using a reverse transcription kit (BioRT Master HiSensi cDNA First Strand Synthesis kit) and a thermal cycler (T100TM Thermal Cycler, BIO-RAD, USA). In order to avoid high concentrations of RNA inhibiting reverse transcription, we added RNase-free ddH2O to dilute the RNA to a concentration of 1:5 (Table S4). Reaction conditions for reverse transcription: 42°C, 20 minutes; 70°C, 15 minutes; 4°C, ∞.
qPCR Analysis
cDNA was thawed on ice, and 2 μL of cDNA was used as a template for RT-qPCR. The qPCR analysis was performed using the RT-qPCR kit (A0061 GoTaq® qPCR Master Mix, Promega, USA) and the RT-qPCR System (CFX ConnectTM Real-Time System, BIO-RAD, USA). cDNA was extracted from peripheral whole blood and used as a template for RT-qPCR. Each component in the Promega kit was taken, and the PCR reaction mixture was configured on ice: 7.2 μL RNase-free ddH2O, 0.4 μL forward primer, 0.4 μL reverse primer, 10.0 μL 2×GoTaq qPCR Master Mix, with a total volume of 18.0 μL. The prepared PCR reaction mixture was evenly divided into each reaction tube, in which cDNA was added. PCR reaction conditions: (1) Pre-denaturation: 95°C for 10 min; (2) Denaturation: 40 cycles of 95°C for 15s; (3) Annealing: 60°C for 1min. Tm, concentrations, and annealing temperatures of primers are shown in Table S5.
The terms used to describe quantitative real-time PCR cycles are different. The current terms used in the literature include threshold cycle (Ct), crossing point (Cp), and takeoff point (TOP). These values are not different scientific quantitative terms and actually denote the same value for an RT-qPCR apparatus. For convenience and rigor of the complete text, we only use the term Cq value in this paper. 7
Stability Analysis of Reference Genes
The stability of reference genes is mainly evaluated by focusing on four different methods: (1) geNorm calculates the stability value (M value) for each one to select the suitable reference genes. The smaller M value means better stability. Meanwhile, this program can pick out the preferred combination of two or more reference genes. 15 (2) NormFinder also obtains the stability value of the reference genes, with the criterion that the smallest stability value is the appropriate reference gene. 16 (3) BestKeeper can calculate the pairwise correlation coefficient (r), standard deviation (SD), and coefficient of variation (CV) between reference genes. We finally determined the stability of the reference genes by comparing the standard deviation (SD) and selected genes with the smallest SD. Suppose SD > 1, the expression of the reference gene is unstable. 17 (4) The ΔCt method is used to evaluate the fluctuation of ΔCt by comparing two or more reference genes. A more minor standard deviation (SD) of ΔCt means the more stable reference gene. 18 (5) RefFinder assigns an appropriate weight to an individual gene based on the rankings from each program and calculates the geometric mean of their weights for the final comprehensive ranking.19,20
Statistical Analysis
All statistical analyses were performed using GraphPad Prism 8.0.2 and IBM SPSS Statistics 26. All data passed Grubb’s test, excluding the presence of outliers. One-way analysis of variance ANOVA was used for statistical analysis, followed by Bonferroni or Dunnett’s multiple comparisons post-hoc test for statistical evaluation.
Result
Expression of Candidate Reference Genes
To identify preferred and stable reference genes at 2 hours, 12 hours, and 24 hours under 0 Gy, 0.5 Gy, 1.2 Gy, and 3.5 Gy exposure doses, we selected eight commonly used reference genes (GAPDH, 18S rRNA, UBC, HPRT, DPM1, ITFG1, MRPS5, ACTB) for experiments. The primer sequences, amplicon lengths, and primer efficiencies for involved genes are shown in Table S6.
The melting curve after amplification of primers displays individual melting peaks at temperatures above 78.0°C (Figure 1). In addition, we performed serial gradient dilutions on cDNA samples, and standard curves for primers of the involved gene were generated after four to six serial ten-fold dilutions. The curve showed that the RT-qPCR efficiency of primers was between 90% and 110% (Table S6). According to the MIQE guidelines,
7
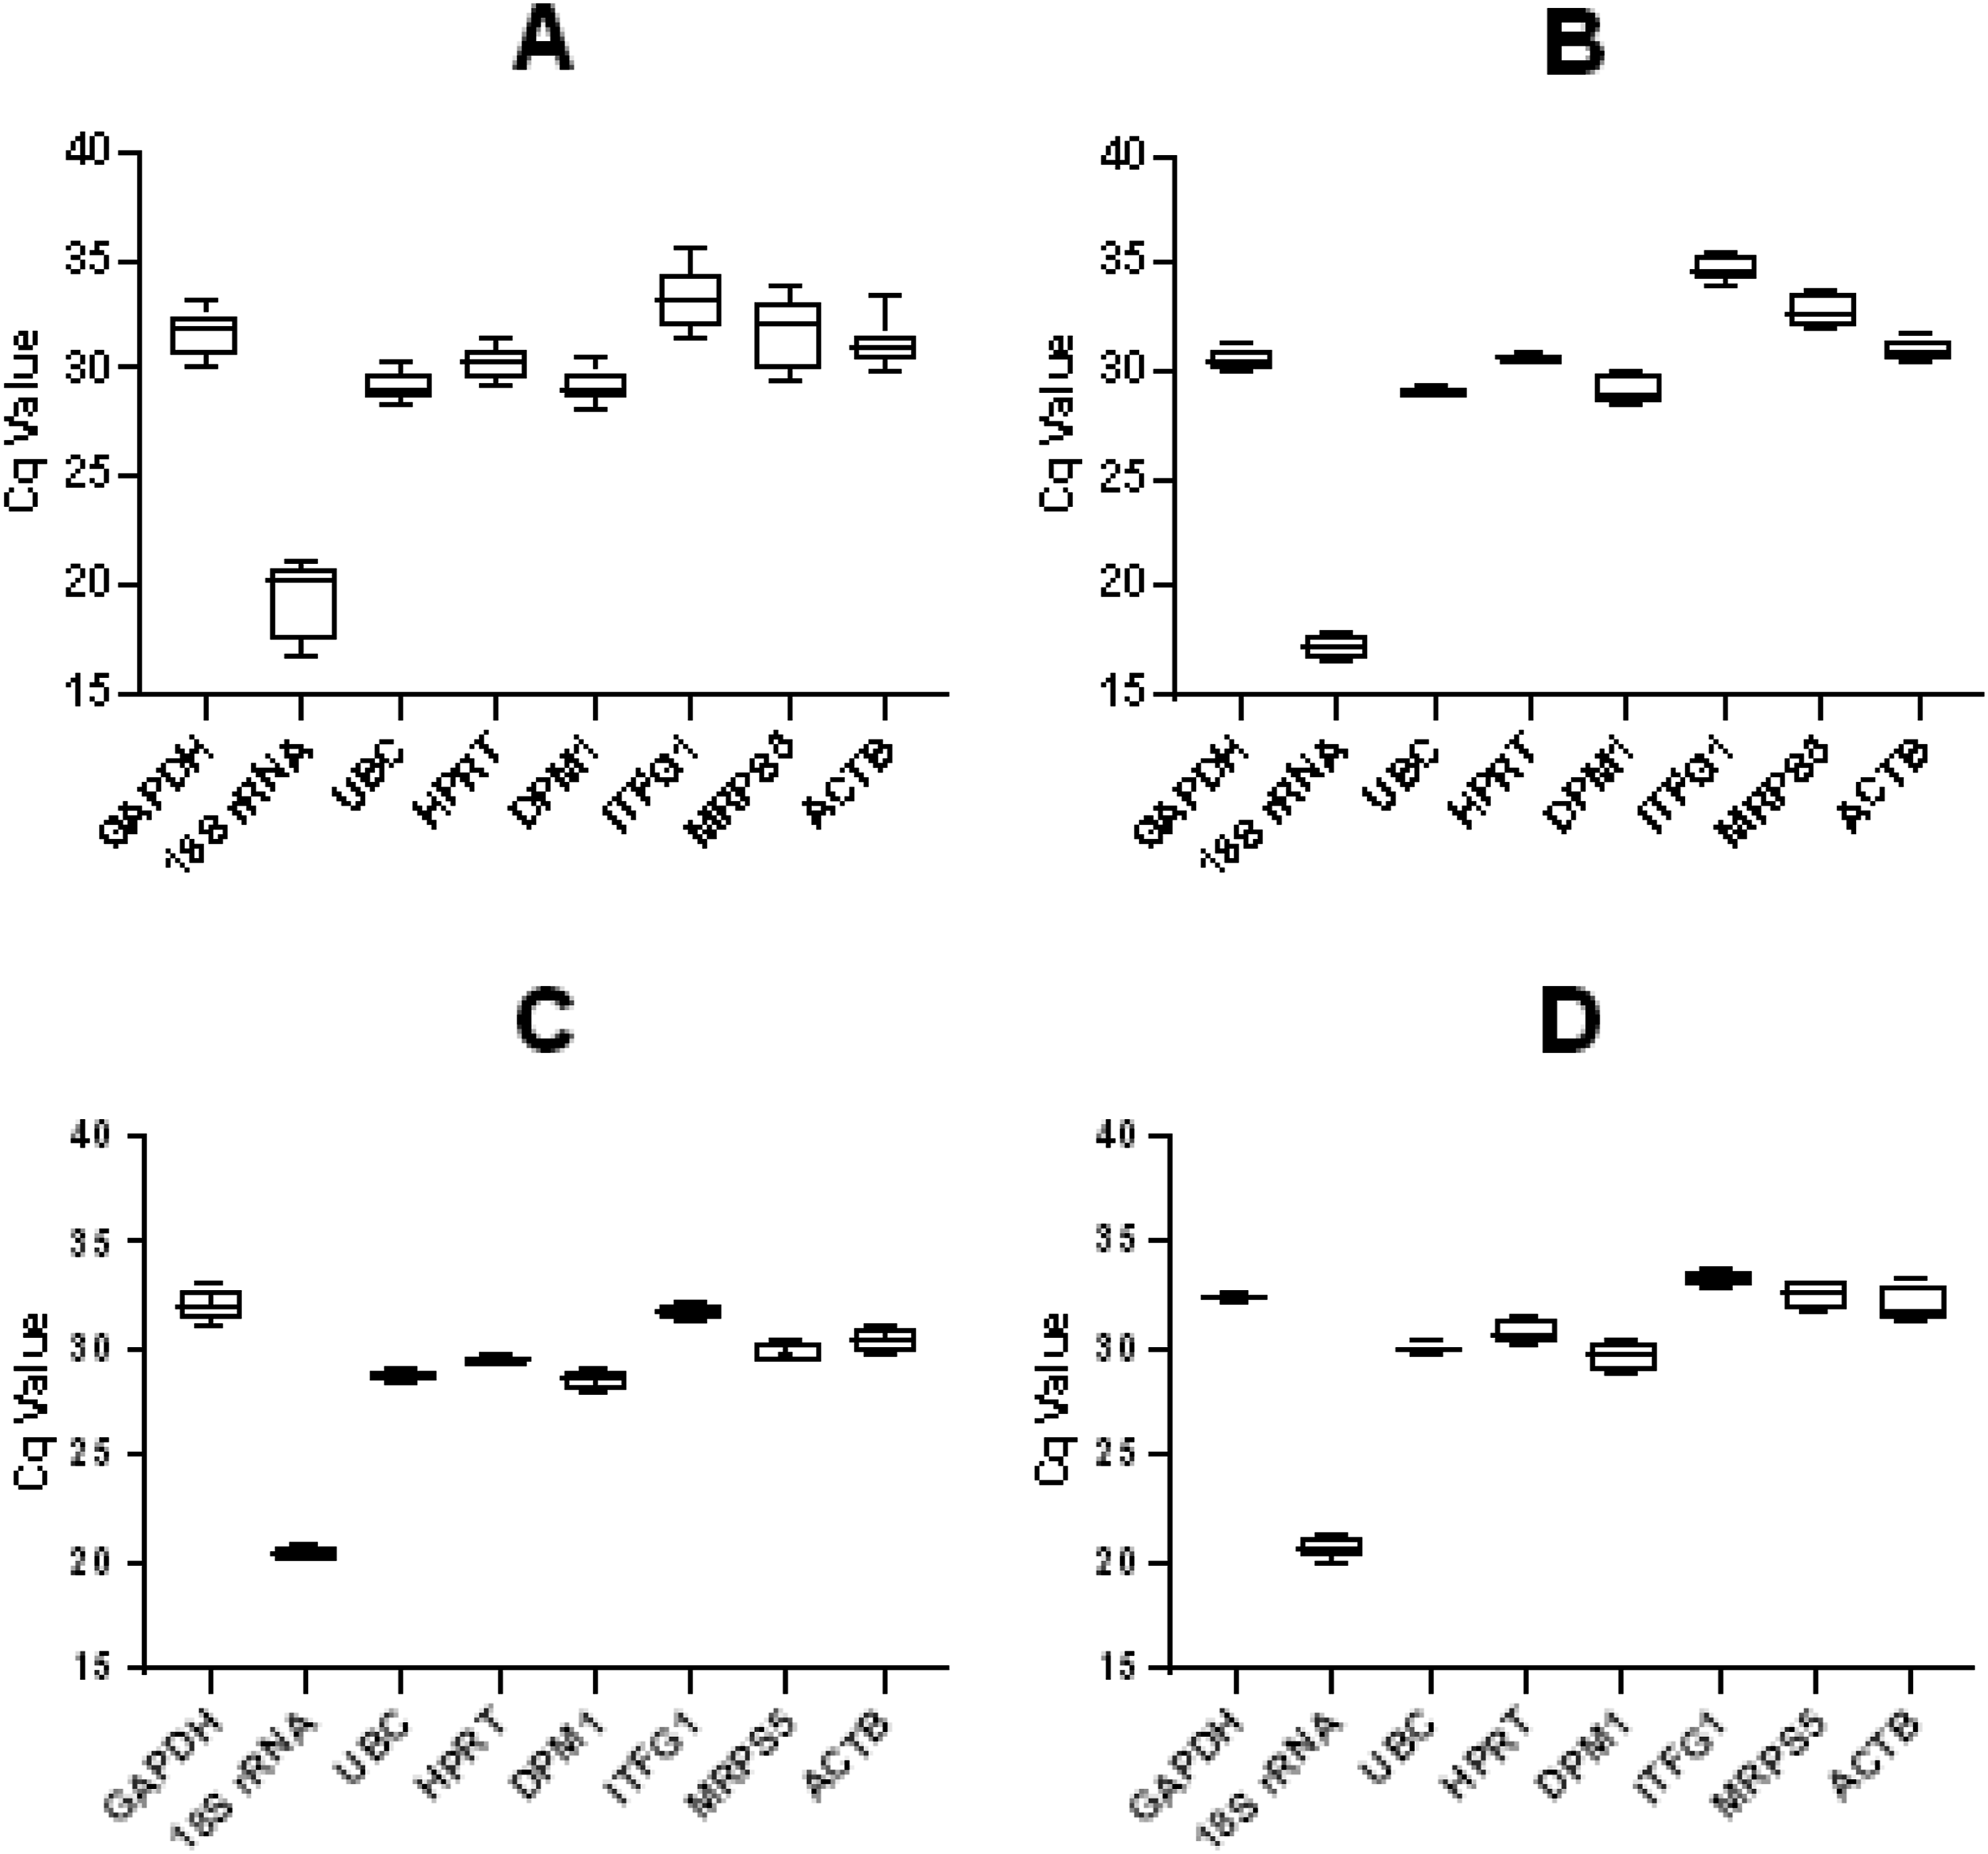
the acceptable RT-qPCR efficiency calculated from the slope of this curve is 90% ∼110%. We set the cut-off Cq value >40 for weak expression, and the results showed that the Cq values of all candidate gene expression levels were within this range. 18S rRNA exhibited the highest expression (Cq = 19.42 ± 1.772). In contrast, ITFG1 (Cq = 33.26 ± 1.510) exhibited the lowest expression (Figure 2A). Considering each culture period, 18S rRNA remained the highest while ITFG1 remained the lowest (Figure 2B–D). Melting Curves of Primers Amplification. Melting Curves of Each Pair of Primers Displayed Individual Dissociation at Temperatures >75°C for all Products The Expression Levels of 8 Candidate Reference Genes. Expression Levels for Reference Genes in all Samples are Displayed as Cq Values. (A) Showed the Overall Expression Levels of Each Candidate Gene at Four Exposure Doses and Three Culture Times. (B), (C), and (D) Showed the Expression Levels of Each Candidate Gene when the Culture Time is Respectively 2h, 12h, and 24h. The Line Across the Box Depicts the Median. The Box Indicates the 25th and 75th Percentiles. Bars Represented the Maximum and Minimum Values
Comparison of Reference Gene Expression Stability
Coefficient of Variation (CV) of Candidate Reference Genes


The Scatter Plot of Candidate Reference Gene Expression. (A), (B), and (C) Showed the Expression Levels of Each Candidate Gene when the Culture Time is Respectively 2h, 12h, and 24h. Expression Data are Displayed as Cq Values in Each Sample Considered. The Line Across the Data Scatter Depicts the Geometric Mean
Pairwise Comparison of Cq Values of Eight Candidate Genes in Four Dose Groups at 2h, 12h, and 24h. The Resulting P-Value is Shown in the Table

Stability Values by Four Methods (ΔCt Methods, BestKeeper, NormFinder, and geNorm) and Comprehensive Rank by RefFinder at Culture Time of 2h

Stability Values by Four Methods (ΔCt Methods, BestKeeper, NormFinder, and geNorm) and Comprehensive Rank by RefFinder at Culture Time of 12h

Stability Values by Four Methods (ΔCt Methods, BestKeeper, NormFinder, and geNorm) and Comprehensive Rank by RefFinder at Culture Time of 24h

Based on the geometric mean of candidate reference gene weights from the stability rankings of four methods, the final comprehensive ranking was obtained using the RefFinder program (Figure 4). In our study of radiation biodosimetry using human peripheral blood (PB), we evaluated reference genes for normalizing RT-qPCR data based on different culture times. For a culture time of 2 hours, the preferred reference genes were UBC (value = 1.414), HPRT (value = 1.861), GAPDH (value = 2.340). In contrast, the least reliable reference genes were DPM1 (value = 7.737), 18S rRNA (value = 6.735), and ITFG1 (value = 5.826) (Figure 4A). When the culture time was extended to 12 hours, the suitable reference genes shifted to UBC (value = 1.189), HPRT (value = 1.414), and 18S rRNA (value = 3.000). The unstable reference genes during this time were ACTB (value = 8.000), GAPDH (value = 7.000) and DMP1 (value = 6.000) (Figure 4B). For 24 hours of culture, the appropriate reference genes were 18S rRNA (value = 1.000), MRPS5 (value = 2.000), and GAPDH (value = 2.913), and the inappropriate reference genes for this period included ACTB (value = 7.238), ITFG1 (value = 7.113), UBC (value = 6.236) (Figure 4C). Final Stability Ranking and Comprehensive Stability Value of the Eight Reference Genes by RefFinder in Three Different Culture Times. (A), (B), and (C) Showed the Comprehensive Ranking of Stable Values of Candidate Genes when the Culture Time was 2h, 12h and 24h, Respectively. The Lower the Comprehensive Stability Value, the Higher the Stability Ranking
Discussion
A nuclear accident will result in a large number of casualties. Rapid and accurate assessment of the biological dose of the injured is the key link to correct treatment after an accident. 1 Biodosimetry can be used to estimate the radiation exposure dose of exposed individuals quantitatively. 21 However, the main problem in application focuses on the non-specificity of gene expression caused by exposure, while biodosimetry requires specificity. The solution to this contradiction lies in selecting candidate genes for gene cluster detection. An important direction in the study of biodosimetry is currently establishing the expression model of radiosensitivity gene clusters for estimating exposure dose. One of the primary factors influencing the relative expression level of genes is the use of reference gene. According to the MIQE guidelines, researchers are required to justify the selection of reference genes. The utilization of reference genes as internal controls is the most prevalent approach for normalizing mRNA data. Still, their effectiveness is supposed to be validated for specific tissues or cells under particular experiments. In theory, the expression of reference genes used for normalization should remain stable and hold constant under specified experimental conditions. 7 To date, numerous studies in the literature have focused on estimating radiation biological dose using human peripheral blood.1-5,10-14,22-28 However, few researchers have been able to explain the selection of reference genes in detail and verify the stability of gene expression levels. Therefore, this study verified the expression stability of common reference genes (GAPDH, 18S rRNA, UBC, HPRT, DPM1, ITFG1, MRPS5, ACTB) in human peripheral blood under three culture times and four exposure doses.
To determine the preferred reference genes, we analyzed the reference gene expression data using four statistical programs: Delta Ct, BestKeeper, NormFinder, and geNorm. When the culture time was 2 hours, the stability ranking results obtained by each algorithm were inconsistent. All four algorithms identified UBC as one of the three preferred reference genes. When the culture time was 12 hours, all these algorithms yielded consistent results for the three preferred reference genes: UBC, HPRT, and 18S rRNA. However, GeNorm (Rank: UBC/HPRT, 18S rRNA) and BestKeeper (Rank: HPRT, UBC, 18S rRNA) show differences in stability ranking compared to the other two programs (Rank: 18S rRNA, MRPS5, GAPDH). Similarly, when the culture time was 24 hours, the stability ranking results obtained by GeNorm (Rank: 18S rRNA/MRPS5, DPM1) and BestKeeper (Rank: 18S rRNA, GAPDH, MRPS5) were inconsistent with those obtained by the other two programs (Rank: 18S rRNA, MRPS5, GAPDH). We use RefFinder to combine all the data obtained with the four algorithms to comprehensively rank the reference genes. This method integrates all the features of the above methods to get accurate results. 9
We performed preliminary validation of each primer pair to evaluate the PCR efficiency of the candidate reference genes. The melting curve obtained from the amplification of primers displays individual melting peaks, indicating that no dimer formation occurred. In addition, the reaction efficiency of each pair of primers and the expression level (Cq < 40) of eight candidate genes were normal and acceptable.
Based on the analysis of gene expression data, specific genes were identified as preferred. It can be used alone or in combination for normalization of RT-qPCR analysis of radiosensitivity genes in human peripheral blood. The expressions of UBC and HPRT remained stable at 2 hours and 12 hours. Interestingly, 18S rRNA and ACTB are often used as reference genes to normalize expression data in radiation biodosimetry studies of human peripheral blood; however, the statistical results show that ACTB had the lowest comprehensive stability ranking when the culture time was 12 hours and 24 hours. Despite the culture time not being long (2 hours), the stability of ACTB was still not high, meaning that it was not the preferred reference gene. It is not surprising, as there is literature indicating that the expression levels of ACTB and even 18S rRNA fluctuate.9,29 This conclusion does not prevent many researchers from using them to normalize experimental data. Moreover, in recent radiosensitivity gene studies, the selection of some reference genes conflicts with our results. We discovered that the final comprehensive stability ranking of 18S rRNA was higher when the culture time of PB increased (at least for 2 hours, 12 hours, and 24 hours), indicating that for 2 hours, 12 hours and 24 hours, the expression of 18S rRNA was more stable when was 24 hours. Furthermore, in RENEB Inter-Laboratory experiment, a 12-hour culture period was used; however, the reference genes employed by different platforms and teams varied. Our results revealed that neither GADPH nor ACTB was suitable as the preferred gene; however, two teams of RENEB included GAPDH as the reference gene, which may pose a threat to the reliability of the results. 14 Similarly, in Li’s experiment, both the blood samples cultured for 12 hours and 24 hours were normalized using ACTB, whose stability was poor at 12 hours and 24 hours in our results. 1 Bhagi’s experiment set the culture periods at 2 hours, 4 hours, and 24 hours, using GAPDH and ACTB as reference genes. Although the stability of GAPDH is not too bad at 2 hours and 24 hours, in fact, there are better candidate genes (for 2 hours: UBC, HPRT; for 24 hours: 18S rRNA, MRPS5) that can be selected instead of ACTB. 2 When Li’s team established the dose-response and time-response relationships of radiosensitivity genes at 6, 12, 24, and 48 hours, they normalized the data using ACTB as one of the reference gene combinations. Based on our findings, ACTB demonstrated low stability at 12 and 24 hours, making it less suitable as a reference gene. We recommend caution in its use, as it could potentially affect the credibility and reliability of the conclusions drawn. 10 Ostheim’s team performs RT-qPCR for the 4 target genes (FDXR, DBB2, POU2AF1, and WNT3) against a reference control 18S rRNA. They studied blood samples with culture periods of 1, 2, 4, 8, 12, 24, 48, and 72 hours, but used only a single reference gene, 18S rRNA, for normalization. Our results reveal that 18S rRNA exhibits better stability at 12 hours and 24 hours, but we do not consider it the only option. UBC and HPRT can all be used as preferred reference genes, or gene combinations can be used to reduce the instability caused by the variable of culture time. 3 In Li’s study on P53-related genes, using ACTB for normalization is inconsistent with our findings. It may be unsuitable as a reference gene due to its low stability when the culture time ranges from 2 to 24 hours. 12
The analysis revealed that the expression stability of the reference genes varies in each culture period. We did not find any candidate genes with high stability in all three culture periods. Therefore, to ensure the accuracy and repeatability of the experiment, it is crucial to select appropriate and stable reference genes with low variation based on the different culture periods of blood samples.
Despite the random sampling process employed, we note that a formal power analysis was not conducted a priori to determine the optimal sample size. Consequently, while our findings provide valuable insights, the sample size (n = 3) may be insufficient to detect smaller effect sizes, which could affect the generalizability of the results. This limitation underscores the importance of the appropriate sample size and comprehensive pre-study power analysis for future research to enhance the statistical robustness. Subsequent studies with larger samples or sample size/power analysis would be well-positioned to enhance the reliability and extrapolation of the findings.
This study selected X-ray radiation, which may affect the extrapolation of the results to other similar studies. Then, the mode of irradiation involved in this study was ex vivo, which may weaken the organism’s compensatory feedback at the holistic level, despite the controllability of ex vivo irradiation in radiosensitivity gene expression studies. Besides, some studies have demonstrated that dose rates can lead to variations in the number of expressed genes; however, their impact on the expression stability of reference genes remains unclear. Further studies could systematically evaluate the impact of other ionizing radiations (γ-rays, proton beams, etc.) and dose rates (both high or low) on the stability of gene expression, providing experimental support for the proper selection of preferred reference genes in the field of radiation.
Conclusion
This study presents novel findings on the preferred reference genes for normalizing RT-qPCR data in human peripheral blood samples subjected to different doses of X-ray exposure over three culture periods. The results indicate the following preferred reference genes: for 2 hours, UBC, HPRT, and GAPDH were preferred; for 12 hours, UBC, HPRT, and 18S rRNA were preferred; and for 24 hours, 18S rRNA, MRPS5, and GAPDH were preferred. The expression stability of reference genes was assessed and ranked under various experimental conditions. It provides theoretical support for gene expression analysis in radiation biodosimetry research, serves as a reference and guidance for future studies on radiosensitivity genes, and lays a solid foundation for the application of radiation dose estimation in transcriptomics.
Supplemental Material
Supplemental Material - Verification of Preferred Reference Genes for RT-qPCR Analysis of Radiosensitivity Gene in Human Peripheral Blood
Supplemental Material for Verification of Preferred Reference Genes for RT-qPCR Analysis of Radiosensitivity Gene in Human Peripheral Blood by Mingquan He, Xueqin Yang, Yuting Chen, Chaoxian Gao in Dose-Response.
Footnotes
Acknowledgement
The authors are grateful to all the study participants.
Ethical Approval
The current study was approved by the Ethics Committee of Shenzhen Prevention and Treatment Hospital Center for Occupational Diseases (LL-202151).
Author Contribution
Mingquan He: Methodology, Investigation, Data curation, Writing-original draft & editing. Xueqin Yang: Conceptualization, Investigation, Writing-review & editing. Yuting Chen: Investigation. Chaoxian Gao: Investigation.
Funding
The author(s) disclosed receipt of the following financial support for the research, authorship, and/or publication of this article: This work was supported by the Medical Scientific Research Foundation of Guangdong Province of China (A2022230) and Natural Science Foundation of Shenzhen Municipality (Shenzhen Natural Science Foundation) (JCYJ20220531091212029).
Declaration of Conflicting Interests
The authors declared no potential conflicts of interest with respect to the research, authorship, and/or publication of this article.
Supplemental Material
Supplemental material for this article is available online.
Appendix
References
Supplementary Material
Please find the following supplemental material available below.
For Open Access articles published under a Creative Commons License, all supplemental material carries the same license as the article it is associated with.
For non-Open Access articles published, all supplemental material carries a non-exclusive license, and permission requests for re-use of supplemental material or any part of supplemental material shall be sent directly to the copyright owner as specified in the copyright notice associated with the article.