
Abstract
Introduction
Insulin resistance is a pathological condition in which target cells are unable to uptake & metabolize glucose in response to insulin leading to elevated insulin, and glucose levels and the development of type 2 diabetes mellitus (T2DM), which subsequently causes oxidative stress in brain tissues. Long-term brain oxidative stress can eventually result in central nervous system (CNS) inflammation and neuronal cell death. 1
The discovery of microRNAs (miRs) revealed new insights into the molecular mechanisms underlying insulin resistance and T2DM. 2 MiRs are small (18-22) nucleotides non-coding RNA molecules that are powerful regulators of gene-expression and are implicated in playing critical roles in physiological and pathological processes. 3 MiR-107, specifically, has been proven to be a crucial regulator in neurodegenerative diseases and metabolic diseases. This microRNA directly binds to the 3′UTR sequences of target genes, thereby controlling their levels of expression. Notably, miR-107 is elevated in obese mice and directly targets insulin receptor substrate 1 (IRS1) mRNA, leading to reduced expression of IRS1 protein and consequent insulin resistance. In addition, miR-107 suppressed the expression of SIRT1, a key deacetylase involved in neuroprotection and metabolic homeostasis, and lowered the levels of brain-derived neurotrophic factor (BDNF) levels, which are essential for neuronal survival and synaptic plasticity. Silencing miR-107 improved glucose homeostasis and insulin sensitivity radically. 2
From such mechanistic insight, therapeutic strategies of miR-107 and its downstream targets (IRS1/SIRT1/BDNF pathway) are promising therapeutic options for diabetic brain complications. Anti-diabetic drugs that enhance insulin sensitivity, for example, metformin (MET), have promise to treat neurodegenerative disease.4,5 MET reduces hyperglycemia through 3 mechanisms: inhibition of hepatic glucose production, inhibition of gastrointestinal absorption of glucose, and peripheral insulin sensitization.6,7 However, MET monotherapy is hampered by side effects like lactic acidosis, liver toxicity, and diarrhea.8,9
Studies indicate that the combination of metformin with adjuvant agents enhances therapeutic effectiveness in diabetic cerebral injury compared to monotherapy.10,11 Natural polyphenolic compounds are particularly promising as combination drugs, as they can modulate T2DM-associated biomarkers and affect cellular and molecular mechanisms involved in insulin resistance and hyperglycemia. 12 Quercetin (Q) (3,3,4′,5,7-pentahydroxyflavone) is a polyphenolic flavonoid with immunoprotective, anti-inflammatory, and anti-apoptotic effects. 13 Importantly, quercetin enhances islet function by increasing insulin secretion by 44-70% in isolated rat islets. 14 In addition, quercetin can modulate miR-107 expression and potentially rehabilitate IRS1/SIRT1/BDNF signaling. 15
Low-dose gamma irradiation (LDR) is another new therapeutic treatment that exhibits hormetic activity by enhancing metabolic function, DNA repair, and protein synthesis.16,17 LDR has been found to exhibit anti-oxidative, antidiabetic, anti-apoptotic, anti-inflammatory, and anti-carcinogenic effects in various disease models. 18 Irradiation exposure at appropriate doses triggers adaptive protective mechanisms including activation of protective genes and pathways, potentially reversing neurodegenerative processes.19,20 Fractionated radiotherapy (1 Gy/week for 4 weeks) allows for the repair of sublethal damage to normal nervous tissue, achieving optimal therapeutic benefits with minimal toxicity. 21
Therefore, in this study, we investigated the synergistic neuroprotective effects of metformin, in combination with gamma irradiation and/or quercetin, against miR-107-mediated signaling pathways (ie, IRS1/SIRT1/BDNF and NF-κB) in HFD/STZ-induced diabetic brain damage in rats. We assumed that combination therapy would more effectively downregulate miR-107 expression and restore downstream neuroprotective signaling than monotherapies.
Material and Methods
Drugs and Chemicals
A chemical powder termed streptozotocin (stz), weighing 1 gram, was purchased from Sigma Aldrich (St. Louis, Mo, USA). Animals were intra-peritoneally injected by 35 mg/ kg body weight STZ (dissolved in 0.1 M citrate buffer, pH 4.5).
Metformin (200 mg/kg body weight) 22 and Quercetin (30 mg/kg body weight) 23 were purchased as a chemical powder from (Sigma-Aldrich, USA) Company, where they were liquefy in 0.1 mL distilled water and applied orally daily for 4 weeks -All other chemicals used in the present study were purchased from the respective vendor of local commercial stores.
Radiation Facility
Rats whole body were exposed to fractionated doses of gamma irradiation, which was achieved at National center for Radiation Research and Technology NCRRT (Cairo, Egypt) using a Canadian Gamma cell-40 (Cs137), a biological irradiator manufactured by Canada Ltd Ottawa, Ontario, Canada. Animals were placed in a plastic sample tray with lid and supports provided for use in the sample cavity. The unit has ventilation holes which align with ventilation parts through the main shield to provide a means for uniform irradiation for small animals at a dose rate of 0.621 Gy/min at the time of experiment according to the guidelines of the Protection and Dosimetry Department. In rats, irradiation of whole body was delivered in a separate fractions up to a cumulative dose of 4 Gy (1 Gy/fraction for 4 consecutive weeks). 24
Experimental Animals
Ninety male Wistar rats (weighting 160-180 g and ranging in age from 6 to 7 weeks) were bought from the Animal Research Institute (Cairo, Egypt). Throughout the experimental period, rats were obtained ad libitum of food and water, as well as housed under the same laboratory conditions with a light/dark cycle of 12h, humidity of 50 ± 15%, and temperature of 25 ± 3°C. All experimental principles were executed in compliance with the standards and instruction of the Faculty of veterinary medicine local Institutional Animal Ethics Committee, Benha University, Egypt, supplied instruction and methods that were employed whilst the experiment was being conducted in Egyptian Atomic Energy Authority. The protocol number for approval is BUFVTM 04/01-/22. With approval from Egyptian Atomic Energy Authority’s Central Scientific Publishing Committee (Ref No: 235/7/2024).
Induction of Diabetes Mellitus Type 2
To establish a non-genetic rat pattern of T2DM, 80 rats were fed a high fat diet (HFD) with a total energy of 25.07 kJ/g containing 60% fat, 20% carbohydrate, and 20% protein for consecutive 4 weeks. 25 After fasting overnight, HFD-fed rats obtained a single intraperitoneal streptozotocin (STZ), 35 mg/kg body weight, freshly prepared in citrate buffer (0.05 M, pH 4.5). 26 The level of the blood glucose was tracked 3 days later using a glucometer (Accu-Chek ® Aviva, Roche Diagnostics, India). Rats that showed levels of blood glucose of >200 mg/dl were labelled as the group with diabetes and were chosen to examine the antidiabetic effect of metformin, gamma radiation, and quercetin each alone or in combination. 25
Experimental Design
Ninety rats were used and separated randomly into 2 groups.
Group1 (Normal control): 10 rats received a standard diet (3% fat, 54% carbohydrate, 26% protein, 17% vitamins, and minerals with a total energy of 14.43 kJ/g) and water.
Group 2 (Diabetic control, HFD/STZ) 80 rats fed with high fat diet (HFD) and injected with streptozotocin (STZ) and received saline orally for 4 weeks. After induction diabetes about 38 rats died from STZ dose.
Randomly, the rats with diabetes were firstally distributed into 7 sets, with 6 rats within each group. In Group 3 (HFD/STZ + IR), the diabetic rats whole body were exposed to fractionated gamma radiation dose(1 Gray/week) for 4 weeks up to a total dose of 4 Gray at a certain period of time each week (beginning of the week), In Group 4 (HFD/STZ + Q), the diabetic rats received 30 mg/kg body weight of Quercetin orally daily for 4 weeks, In Group 5 (HFD/STZ + IR + Q), the whole body of rats with diabetes were exposed to 1 Gray and after 1 hour received 30 mg/kg body weight of Quercetin orally for 4 weeks, In Group 6 (HFD/STZ + Met), the diabetic rats received metformin at a dose (200 mg/kg body weight /rat) once daily via oral gavage for 4 weeks, 27 In Group 7 (HFD/STZ + MET + IR), the diabetic whole body rats exposed to 1 Gray and after 1 hour received metformin orally via oral gavage, In Group 8 (HFD/STZ + MET + Q), the diabetic rats were received both metformin and Quercetin orally by oral gavage, Finally, Group 9 (HFD/STZ + MET + IR + Q), the diabetic whole body rats exposed to 1 Gray gamma radiation and received both metformin and Quercetin orally via oral gavage orally for 4 weeks.
Biological Sampling
Upon completion of the experiment, animals were sacrificed under urethane anaesthesia (1.5 g/kg b.wt, ip). Samples of blood were obtained by heart puncture and allowed to coagulate at room temperature, and then centrifuged at 4000 r/min for 15 min using a centrifuge (Hettich Universal 32A, Germany). After collection, the sera were further separated and stored at 80°C until needed. 28 Following an incision made on the dorsal side of the skull, the brains were taken out, cleaned, and homogenized in ice-cold phosphate buffer saline (pH 7.4) at a ratio of 1:10 (w/v). Homogenization was performed in physiological saline using Teflon homogenizer (Glass-Col, Terre Haute, Ind., USA) and after centrifugation at 10,000×g for 15 min at 4°C using refrigerated centrifuge (K3 Centurion Scientific, Ltd, London, UK), then the supernatant was collected and preserved frozen at −20°C until used for the biochemical analyses. Some brain tissues were rinsed in 10% neutralized formalin for histopathological examination and the other part of brain were preserved frozen at −80°C until used for molecular analysis study.
Body Weight, Fasting Blood Glucose, Insulin, and HOMA-IR Estimation
The body weight changes in the experimental groups were measured and compared with the control group. Also, Blood glucose levels during fasting (FBG) were measured through a tail vein blood sample, using portable Accu-Chek Active glucometer (Roche Diagnostic, Manheim, Germany). Additionally, the rat-specific insulin enzyme linked immunoassay Elisa kit from Mercodia AB, Uppsala, Sweden, was used to quantify the fasting blood insulin level (FBI). The insulin resistance (IRI) index was calculated by the homeostasis model of assessment (HOMA-IR) as follows 29 : HOMA-IR = FBG x FBI /22.5.
Biochemical Estimation of Oxidative Stress Markers in the Brain Tissue
Tissue malondialdehyde (MDA) levels and glutathione peroxidase (GP-x) activity, were measured calorimetrically using a commercial kit (Bio-diagnostic, Cairo, Egypt), for each, based on the manufacturer’s instructions. The levels of MDA and activity of GPx were stated as µmol/g, U/g tissue, respectively.
Enzyme-Linked Immunosorbent Assay (ELISA)
Serum levels of Acetylcholineestrase concentrations were determined using commercially available fast detect kit acetylcholineestrase (AchE) (rat) from (BioVision, Inc. San Francisco, Milpitas, USA) in compliance with the manufacturer’s instructions. Furthermore, levels of serum matrix metalloproteinase-2 (MMP-2) was determined using rat MMP-2 ELISA Kit (MyBioSource cat. no: MBS2515523) based on the protocols provided by the manufacturers.
Western Immunoblotting
Frozen brain tissue was crushed in an ice-cold RIPA buffer (0.1% SDS, 1% Triton, 0.5% deoxycholate, 1 mM EDTA, 20 mM Tris [pH 7.4], 10 mM NaF, 150 mM NaCl, and 0.1 mM phenyl-methyl sulfonyl fluoride).The brain homogenate samples were centrifuged at 12 000×g for 15 min at 4°C to remove debris. The protein content was quantified by the procedure of Oosta et al. 30 Sample of brain tissues having 20 μg of total cellular protein were laden and detached on SDS–PAGE (10%) gel electrophoresis, then moved onto the nitrocellulose membrane. Consequently, the membranes were preserved for 120 min with a blocking buffer containing 5% bovine serum albumin (BSA) to reduce nonspecific binding sites, and then each membrane was incubated overnight at 4°C with rat monoclonal anti-IRIS1 (1:750) in BSA (5%) in Tris-buffered saline and 0.05% Tween-20 (TBST). After that, the membrane was rinsed twice with TBST for 30 min. Consequently, the blots were held with the secondary antibody following washing for 120 min at room temperature. 31 The protein bands were portrayed with an alkaline phosphatase-specific kit (ab-83369) and, posteriorly, the bands were quantified using a scanning laser densitometer through densitometric analysis of the autoradiograms (Biomed Instrument Inc., USA). The findings were presented as arbitrary units after normalization for β-actin.
Quantitative Real-Time PCR Analysis for BDNF, SIRT1 and NF-κB
Forward and Reverse Primers Sequence for Primers Used in q-RTPCR and the Conditions for PCR Thermal Cycling Included

Quantitative Real Time Polymerase Chain Reaction (qRT-PCR) of microRNA-107 (MiR-107)
Forward and Reverse Primers Sequence for Real Time PCR and Their Conditions

Histopathological Analysis
The excised brain tissue samples from all groups were taken, collected, cleaned and immediately fixed in 10% neutral buffered formalin solution for histopathology, pH 7.4. The specimens were routinely handled as the following manner: dehydrated in ascending concentration of ethanol, cleaned in xylene, imbedded in paraffin wax and sectioned at 5-micron thickness by microtome. 33 Prepared slides sections were stained by hematoxylin and eosin and examined by light digital microscope (Olympus xc30. Tokyo. Japan) at a magnification of 400 X. They were then scored with the following histological grading system 34 : 0, no damage; 1, a few neurons damaged; 2, numerous neurons damaged; 3, majority of neurons damaged; 4, vast majority of neurons damaged.
Statistical Analyses
The values of results were investigated using GraphPad Prism-8 (GraphPad Software Inc., USA) and represented as mean ± SEM. The data were examined for the body weight and fasting blood glucose test using a two-way analysis of variance (ANOVA) followed by a Tukey’s post hoc test and one-way ANOVA followed by a Tukey’s test At (P < 0.001).
Results
Changes in Body Weight in the Different Studied Groups
As shown in Figure 1, the body weight change results revealed significant treatment effects over the 8-week study period. Control rats exhibited normal growth with a modest weight gain of approximately 40g from baseline. In contrast, the HFD + STZ diabetic group showed excessive weight gain of 240g, likely due to diabetic hyperphagia and metabolic dysfunction. Treatment interventions demonstrated varying degrees of therapeutic benefit in controlling this excessive weight gain. The HFD + STZ + IR and HFD + STZ + Q groups showed substantial but incomplete reduction in weight gain (190g and 170g respectively), while the combination treatment HFD + STZ + IR+Q provided better control with 150g weight gain. Metformin-based treatments showed the most effective weight management, with HFD + STZ + MET alone achieving 85g weight gain, and combination therapies (HFD + STZ + MET+HR, HFD + STZ + MET+Q, and HFD + STZ + MET+IR + Q) all maintaining weight gains between 60-75g, approaching levels closer to normal control values. Statistical analysis indicated significant differences between treatment groups (P < 0.001, denoted by different letters), demonstrating that combination therapies, particularly those including metformin, were most effective in preventing diabetes-associated excessive weight gain. Effect of Different Treatments on Body Weight Change. Each Value Represents Mean ± SEM (n = 6). Mean ± SEM (n = 6). Each Value Represents Mean ± SEM (n = 6). Columns Denoted With ˝a˝ Significant From Control, ˝b˝: Significant From HFD + STZ, c˝ Significant From HFD + STZ + IR, ˝d˝ Significant From HFD + STZ + Q, ˝e˝ Significant From HFD + STZ + IR+Q, ˝f˝ Significant From HFD + STZ + MET, ˝g˝ Significant From HFD + STZ + MET+IR, ˝h˝ Significant From HFD + STZ + MET+Q and ˝i˝ Significant From HFD + STZ + MET+IR + Q at (P < 0.001). Two-Way ANOVA Followed by Tukys Post Analytic Test
Changes in Fasting Blood Glucose Tolerance in the Different Studied Groups
Our results in Figure 2 demonstrated significant changes in blood glucose levels across treatment groups in the HFD/STZ diabetic rat model at initial (0 week; after the induction of diabetes and prior to initiation of treatments) and final (8 week; just before sacrifice) time points, all groups started with similar baseline glucose levels around 200-230 mg/dl, but showed dramatically different outcomes by week 8. The control group maintained normal glucose levels around 190 mg/dl, while the HFD + STZ group exhibited markedly elevated glucose concentrations (P < 0.05), confirming successful diabetes induction. Treatment interventions showed varying degrees of therapeutic efficacy in managing this glucose elevation, with single therapies (IR, Q) achieving moderate improvements (340-350 mg/dl), and dual combination IR + Q reaching around 320 mg/dl. However, metformin-containing regimens proved most effective at controlling the HFD + STZ-induced hyperglycemia, with MET alone achieving 300 mg/dl, while combination therapies including MET + IR (290 mg/dl), MET + Q (280 mg/dl), and the most comprehensive treatment MET + IR + Q (260 mg/dl) demonstrated the best glucose control outcomes. These findings indicate that combination therapies, particularly those including metformin with quercetin and gamma radiation, effectively attenuate diabetes-induced hyperglycemia compared to single interventions, suggesting potential combined effects that could translate to enhanced neuroprotection by preventing glucose-mediated neurotoxicity. Effect of Different Treatments on Blood Glucose Change Level. Mean ± SEM (n = 6). Each Value Represents Mean ± SEM (n = 6). Columns Denoted With ˝a˝ Significant From Control, ˝b˝: Significant From HFD + STZ, c˝ Significant From HFD + STZ + IR, ˝d˝ Significant From HFD + STZ + Q, ˝e˝ Significant From HFD + STZ + IR+Q, ˝f˝ Significant From HFD + STZ + MET, ˝g˝ Significant From HFD + STZ + MET+IR, ˝h˝ Significant From HFD + STZ + MET+Q and ˝i˝ Significant From HFD + STZ + MET+IR + Q at (P < 0.001). Two-Way ANOVA Followed by Turkey’s Post Analytic Test
Effect of Different Treatments on Fast Blood Glucose, Fast Serum Insulin, and HOMA-IR
Figure 3, demonstrated that high-fat diet combined with streptozotocin (HFD + STZ) successfully induced a type 2 diabetes model in rats, characterized by significantly elevated glucose levels, decreased insulin secretion, and increased insulin resistance (HOMA-IR) compared to controls. Various treatment interventions showed differential effects on these metabolic parameters. While all treatments reduced hyperglycemia to some extent, combinations involving metformin (MET) exhibited the most pronounced effects, with MET + IR + Q demonstrating the strongest glucose-lowering action. Regarding insulin levels, most treatment groups maintained low insulin similar to the untreated HFD + STZ group; however, the MET + Q and MET + IR + Q combinations uniquely showed improved insulin secretion. The HOMA-IR index revealed that MET-containing treatments most effectively reduced insulin resistance, with MET + IR and MET + IR + Q combinations providing the greatest improvement. These findings suggest that combination therapies, especially those including MET + IR + Q, may offer superior management of diabetes-related metabolic disruptions in this obesity-induced diabetes model, potentially impacting subsequent effects on brain tissues. The Concentration of (A) Serum Glucose, (b) Serum Insulin (C) HOMA-IR Index in Various Animal Groups after 4 weeks of Continuous Treatment. Each Value Represents Mean ± SEM (n = 6). Columns Denoted With ˝a˝ Significant From Control, ˝b˝: Significant From HFD + STZ, c˝ Significant From HFD + STZ + IR, ˝d˝ Significant From HFD + STZ + Q, ˝e˝ Significant From HFD + STZ + IR+Q, ˝f˝ Significant From HFD + STZ + MET, ˝g˝ Significant From HFD + STZ + MET+IR, ˝h˝ Significant From HFD + STZ + MET+Q and ˝i˝ Significant From HFD + STZ + MET+IR + Q at (P < 0.001)
Effect of the Different Treatments on Oxidative Stress in Diabetic Rats
Effect of Different Treatments on Oxidative Stress in Diabetic Rats

Values in the table are means ± SEM (n = 6). Differences between the groups were assessed by one-way analysis of variance (ANOVA) followed by Tukey’s test, where P < 0.001 Columns denoted with.
asignificant from control.
bsignificant from HFD + STZ.
csignificant from HFD + STZ + IR.
dsignificant from HFD + STZ + Q.
esignificant from HFD + STZ + IR + Q.
fsignificant from HFD + STZ + MET.
gsignificant from HFD + STZ + MET + IR.
hsignificant from HFD + STZ + MET + Q.
isignificant from HFD + STZ + MET + IR + Q at (P < 0.001). MDA = Malondialdehyde; GPx = Glutathione peroxidase.
Influence of Different Treatments on (Acetylcholine Esterase) AchE Activity
The current data demonstrated significant alterations in acetylcholinesterase (AChE) activity across different treatment groups in your HFD/STZ diabetic rat model. The control group exhibited baseline AChE activity, while the HFD + STZ group showed markedly elevated enzyme activity (P < 0.001), indicating potential cholinergic dysfunction associated with the diabetic condition. Treatment with IR alone did not significantly affect the elevated AChE levels. The Q-containing treatments began showing moderate improvements, with HFD + STZ + Q and HFD + STZ + IR+Q demonstrating progressive reductions in AChE activity (P < 0.001). More notable decreases were observed with metformin-containing regimens, where HFD + STZ + MET, HFD + STZ + MET+IR, HFD + STZ + MET+Q, and HFD + STZ + MET+IR + Q all exhibited substantial reductions in AChE activity (P < 0.001). The combination of IR + MET + Q produced significantly greater reductions in AChE activity compared to any single treatment alone (P < 0.001), indicating the benefits of a multi-modal therapeutic approach. These findings suggest that combination therapies may provide enhanced neuroprotective effects by modulating cholinergic function in diabetic conditions, with the triple combination approaching values. Figure 4 Effect of Different Treatments on AchE Level. Each Value Represents Mean ± SEM (n = 6). Columns Denoted With ˝a˝ Significant From Control, ˝b˝: Significant From HFD + STZ, c˝ Significant From HFD + STZ + IR, ˝d˝ Significant From HFD + STZ + Q, ˝e˝ Significant From HFD + STZ + IR+Q, ˝f˝ Significant From HFD + STZ + MET, ˝g˝ Significant From HFD + STZ + MET+IR, ˝h˝ Significant From HFD + STZ + MET+Q and ˝i˝ Significant From HFD + STZ + MET+IR + Q at (P < 0.001). One-Way ANOVA Followed by Turkey’s Test
Influence of Different Treatments on MMP-2 in the Brain
Our results demonstrated significant changes in MMP-2 levels across treatment groups in the HFD/STZ diabetic rat model. The HFD + STZ group showed markedly elevated MMP-2 concentrations compared to controls (P < 0.001), indicating heightened neuroinflammation. Treatment interventions reduced MMP-2 levels to varying degrees, with single treatments (IR, Q) providing modest reductions and combination therapies showing progressive improvements (P < 0.001). Metformin-containing regimens demonstrated superior efficacy, with the triple combination HFD + STZ + MET+IR + Q producing the most substantial reduction in MMP-2 levels (P < 0.001), approaching control values. These findings suggest that combination therapies, particularly those including metformin with quercetin and Radiation, effectively attenuate diabetes-induced neuroinflammation by modulating MMP-2 activity in brain tissues. Figure 5 Effect of Different Treatments on MMP-2. Each Value Represents Mean ± SEM (n = 6). Columns Denoted With ˝a˝ Significant From Control, ˝b˝: Significant From HFD + STZ, c˝ Significant From HFD + STZ + IR, ˝d˝ Significant From HFD + STZ + Q, ˝e˝ Significant From HFD + STZ + IR+Q, ˝f˝ Significant From HFD + STZ + MET, ˝g˝ Significant From HFD + STZ + MET+IR, ˝h˝ Significant From HFD + STZ + MET+Q and ˝i˝ Significant From HFD + STZ + MET+IR + Q at (P < 0.001). One-Way ANOVA Followed by Tukey’s Test
Influence of Different Treatments on IRS1 Protein Expression in the Brain
The results of the western blot examination of rat brain homogenates in Figure 6 revealed significant alterations in brain IRS1 protein expression across treatment groups in the HFD/STZ diabetic rat model. Control rats exhibited robust IRS1 expression, while HFD + STZ rats showed markedly diminished levels (P < 0.001), indicating impaired insulin signaling. Single treatments (IR, Q) provided modest improvements (P < 0.001), while combination therapies showed progressively enhanced restoration of IRS1 expression. Metformin-containing regimens demonstrated superior efficacy, with the triple combination HFD + STZ + MET+IR + Q yielding the most substantial recovery of IRS1 levels (P < 0.001), approaching control values. These findings indicate that combination therapies, particularly those incorporating metformin with quercetin and gamma radiation, effectively ameliorate diabetes-induced disruptions in brain insulin signaling pathways, suggesting potential neuroprotective benefits. The Brain Concentration of IRS1 Protein and β-actin in Normal Control Rats (G1), Diabetic Rats (HFD + STZ, G2), and Those Diabetic Rats Treated With Gamma Radiation (IR, G3), Quercetin (Q, G4), Combination of (IR + Q, G5), Metformin (MET, G6), or a Combination of These Treatments (G7), (G8) and (G9). Each Vertical Column With bar Represents the Mean ± SEM (From 6 Rats in Each Group). Columns Denoted With ˝a˝ Significant From Control, ˝b˝: Significant From HFD + STZ, ˝c˝ Significant From HFD + STZ + IR, ˝d˝ Significant From HFD + STZ + Q, ˝e˝ Significant From HFD + STZ + IR+Q, ˝f˝ Significant From HFD + STZ + MET, ˝g˝ Significant From HFD + STZ + MET+IR, ˝h˝ Significant From HFD + STZ + MET+Q and ˝i˝ Significant From HFD + STZ + MET+IR + Q at (P < 0.001)
Influence of Different Treatments on the MiR-107, BDNF, SIRT1 and NF-κB Gene Expression
Our results in Figure 7 depicted a significant alterations in gene expression profiles across treatment groups in the HFD/STZ diabetic rat model. The HFD + STZ group exhibited markedly elevated miR-107/U6 and NF-κB expression levels compared to controls (P < 0.001), while simultaneously showing dramatically reduced BDNF and SIRT1 expression (P < 0.001), indicating profound neuroinflammatory and neurotrophic disruptions. Single interventions with gamma radiation (IR) or quercetin (Q) modestly improved these gene expression patterns (P < 0.001). The dual combination IR + Q showed enhanced benefits over individual treatments. Metformin treatment demonstrated comparable effects to the IR + Q combination. Notably, the combination therapies involving metformin showed progressively greater improvements in all 4 gene markers, with HFD + STZ + MET+IR showing moderate recovery, HFD + STZ + MET+Q exhibiting substantial improvement, and the triple combination HFD + STZ + MET+IR + Q demonstrating the most significant restoration of gene expression patterns (P < 0.001), approaching levels observed in healthy controls. These findings indicate that combination therapies, particularly those including metformin with quercetin and gamma radiation, effectively ameliorate diabetes-induced dysregulation of key neuroprotective and neuroinflammatory pathways, suggesting potential benefits for brain health in diabetic conditions. Quantitative RT-PCR Analysis of the mRNA Levels of MiR-107, BDNF, SIRT1 and NF-κB in Different Treated Diabetic Rats. Each Column and Vertical bar Represent Mean ± SEM (n = 6). Differences Between the Groups Were Assessed by One-Way Analysis of Variance (ANOVA) Followed by Tukey Test, Each Vertical Column With bar Represents the Mean ± SEM (From 6 Rats in Each Group). Columns Denoted With ˝a˝ Significant From Control, ˝b˝: Significant From HFD + STZ, c˝ Significant From HFD + STZ + IR, ˝d˝ Significant From HFD + STZ + Q, ˝e˝ Significant From HFD + STZ + IR+Q, ˝f˝ Significant From HFD + STZ + MET, ˝g˝ Significant From HFD + STZ + MET+IR, ˝h˝ Significant From HFD + STZ + MET+Q and ˝i˝ Significant From HFD + STZ + MET+IR + Q at (P < 0.001)
Histopathology Results
Figure 8 shows the impact of different treatments on the histopathology of the brain of diabetic rats and the scoring system presented in Table 4. Examined brain tissue sections in (normal control) showed regular structure of cerebral cortex score (0) (Figure 8A1) and regular structure of hippocampal score (0) (Figure 8A2). In the (HFD + STZ) Sections group, the cerebral cortex showed focal gliosis and apoptosis of neuronal cells, which appeared as densely basophilic bodies surrounded by a halo zone score (3) (Figure 8B1), and the hippocampal dentate gyrus region revealed atrophy with cellular disorganization, marked shrinkage in size and number of pyramidal cells, and darkened nuclei score (3) (Figure 8B2). In the (HFD + STZ + IR) group, cerebral cortex exhibited neuronal degeneration that appeared in the form of shrunken and darkly pyknotic nuclei and apoptosis of neuronal cells, which appeared as densely basophilic bodies surrounded by a halo zone score (3) (Figure 8C1), and the hippocampal dentate gyrus region revealed atrophy, neuronal degeneration, and nuclear pyknosis of molecular cells with a loss of pyramidal cells score (3) (Figure 8C2). In the (HFD + STZ + Q) group the cerebral cortex showed apoptosis of neuronal cells, which surrounded by a halo zone score (3) (Figure 8D1), and the hippocampal dentate gyrus region revealed cellular disorganization, marked shrinkage in size and number of pyramidal cells, and apoptosis of some granular cells score (3) (Figure 8D2). In the (HFD + STZ + IR+Q) group, the cerebral cortex showed neuronal degeneration that appeared in the form of shrunken and darkly pyknotic nuclei; apoptosis of neuronal cells, which appeared as densely basophilic bodies surrounded by a halo zone, was seen score (3); (Figure 8E1); and the hippocampal dentate gyrus region showed neuronal disorganization, degeneration, and nuclear pyknosis of molecular cells score (2); (Figure 8E2). In the (MET) group, the cerebral cortex of the brain sections revealed neuronal degradation, which appeared as darkly stained cells surrounded by per-cellular haloes spaces, and apoptosis of neuronal cells, which was associated with focal gliosis, were detected and scored (3) (Figure 8F1), and the hippocampal dentate gyrus region revealed marked swelling of granular cells and shrinkage in size and number of pyramidal cells, with darkened nuclei seen score (2) (Figure 8F2). In the (HFD + STZ + MET) group, the cerebral cortex exhibited moderate neuronal degeneration characterized by neuronal swelling and gliosis score (2) (Figure G1) and hippocampal dentate gyrus region revealed cellular disorganization with vacuolar degeneration of granular cell layers score (2) (Figure G2). In the (HFD + STZ + MET+IR) group, the cerebral cortex showed mild swelling of neuronal cells score (1) (Figure H1), and the hippocampal dentate gyrus region revealed cellular organization, and vacuolations of granular cell layers score (1) (Figure H2). In the (HFD + STZ + MET+IR + Q) group, cerebral cortex showed few numbers of degenerated neuronal cells which appeared darkly stained shrunken with per-cellular haloes score (1) (Figure 8I1), and the hippocampal dentate gyrus region revealed cellular organization and shrinkage in size of pyramidal cells, with darkened nuclei being seen score (1) (Figure 8I2). Representative Photographs Sections of Brain Tissues (x 400) and Morphometric Variations Across Different Experimental Groups in Cerebral Cortex and Hippocampus. Figure A represents Normal Control Showed (A1) Normal Histological Structure of Cerebral Cortex; (A2) Normal Histological Structure of Hippocampal Dentate Gyrus Arrow. Figure B Represents the Diabetic Group (HFD + STZ) Showed (B1) Focal Gliosis (Red) and Apoptosis of Neuronal Cells (Black) Arrow; (B2) Atrophy With Cellular Disorganization Black Arrow (A) Focal Gliosis (Red) and Apoptosis of Neuronal Cells (Black) Arrow (B) Atrophy With Cellular Disorganization Black Arrow. Figure C Represents the Diabetic Group Treated With Gamma Radiation (HFD + STZ + IR) Showed (C1) Numerous Numbers of Apoptotic Neuronal Cells Black Arrow; (C2) Atrophy, Neuronal Degeneration and Nuclear Pyknosis of Molecular Cells Black Arrow in Hippocampal. Figure D Represents the Diabetic Group Treated With Quercetin (HFD + STZ + Q) Showed (D1) Apoptosis of Neuronal Cells which Surround by Halo Zone Black Arrow; (D2) Cellular Disorganization and Apoptosis of Granular Cells Arrow in Hippocampal. Figure E Represents the Diabetic Group Treated With 2 Last Groups (HFD + STZ + IR+Q) Showed (E1) Apoptosis of Neuronal Cells Black Arrow; (E2) Nuclear Pyknosis of Molecular Cells Black Arrow. Figure F Represents the Diabetic Group Treated With Metformin (HFD + STZ + MET) Showed (F1) Apoptosis of Neuronal Cells which Associated With Focal Gliosis Black Arrow; (F2) Swelling of Granular Cells and Shrinkage of Pyramidal Cells Black Arrow. Figure G represents the Treated Group With (HFD + STZ + MET+IR) Showed (G1) Swelling of Neuronal Cells (Red) and Gliosis Black Arrow; (G2) Cellular Disorganization and Vacuolar Degeneration of Granular Cells Black Arrow. Figure H Represents the Treated Group With (HFD + STZ + MET+Q) Showed (H1) Mild Swelling of Neuronal Cells Black Arrow; (H2) Cellular Organization and Vacuolations of Granular Cell Layers Black Arrow. Figure I Represents the Treated Group With (HFD + STZ + MET+IR + Q) Showed (I1) Few Numbers of Degenerated Neuronal Cells Black Arrow; (I2) Cellular Organization and Shrinkage in Size of Pyramidal Cells Black Arrow. Scale Bars Represent 10 µm Histopathological Scoring System in Different Groups in Cerebral Cortex and Hippocampus Statistical analysis: Each Colum Values in the table represent means ±SEM (n = 6). Differences between the groups were assessed by one-way analysis of variance (ANOVA) followed by Tukey’s test, where P < 0.001 Columns denoted with ˝a˝ significant from Control, ˝b˝: significant from HFD+STZ, ˝c˝ significant from HFD+STZ+IR, ˝d˝ significant from HFD+STZ+Q, ˝e˝ significant from HFD+STZ+IR+Q, ˝f˝ significant from HFD+STZ+MET, ˝g˝ significant from HFD+STZ+MET+IR, ˝h˝ significant from HFD+STZ+MET+Q and ˝i˝ significant from HFD+STZ+MET+IR+Q at (p < 0.001). Values represent histopathological damage scores (0 = normal, 1 = Mild, 2 = Moderate, 3 = severe damage).

As shown in Table 4 histopathological examination revealed severe brain damage (score 3) in both cerebral cortex and hippocampus of HFD + STZ diabetic rats compared to normal controls (score 0). Combination treatments showed progressive neuroprotection, with metformin-based therapies being most effective, particularly the quadruple combination (HFD + STZ + MET+IR + Q) which reduced damage to mild levels (score 1) in both brain regions (P < 0.001).
Histopathological analysis of the cerebral cortex and hippocampus revealed significant morphometric variations across different experimental groups. In the cerebral cortex, notable differences were observed in neuronal swelling, nuclear pyknosis, apoptosis, and glial cell morphology. Similarly, the hippocampal region demonstrated comparable morphological changes, with additional observations of intra-cellular edema. Group 1, serving as the control, consistently displayed the lowest quantitative morphometric values across all measured parameters. Groups involving HFD/STZ combinations (Groups 2-9) exhibited progressive and varied morphological alterations, suggesting potential complex interactions between metabolic and neurological pathological processes. Figure 8
Discussion
Insulin resistance is considered 1 of the greatest challenges faced by modern medicine. Recent studies reported that miRs have a profound role in several aspects like insulin resistance, obesity, and T2DM. 2 Therefore, the results presented herein attempt to estimate and correlate the levels of miR-107 in diabetic rats as well as treated rats with gamma radiation and/or quercetin and favor their use, in combination with metformin, in controlling HFD/STZ-induced diabetes in rat’s brains.
The link between diabetes and neuropathological diseases is thought to be due to a number of factors, including hyperglycaemia, hyperinsulinemia, ROS production, and inflammation. 35 T2DM develops in cases of dysfunction of insulin generation and secretion from pancreatic-β cells and insulin resistance. 36 Prior research has demonstrated that the HFD/STZ-treated experimental animals were used to establish a non-genetic model of T2DM in order to further mimic the pathology of such a human disease. While HFD induces insulin resistance, the low STZ dosage causes mild impairment in β cell function, resulting in hyperglycaemia, generation of ROS, and hyperinsulinemia, and thus T2DM.37,38 In the present investigation, fasting levels of blood glucose (FBG) were remarkably elevated while levels of fasting serum insulin were reduced in the HFD/STZ rat model related to the normal group, these results were in agreement with Shawky et al. 37 Furthermore, in regards to the insulin resistance index (HOMA-IR), the untreated diabetic group showed a significant increase in the insulin resistance when compared to normal control animals. Similarly, previous studies reported significantly higher HOMA-IR values in untreated diabetic rats compared to the normal control animals. 39 The suggested explanation for this is that the rats have been given HFD and then received a STZ, resulting in disruptions in the function of the pancreatic β-cells via the generation of ROS that cause hyperglycaemia and hyperinsulinemia.38,39 On the other side, treatment diabetic rats with metformin, gamma radiation or quercetin, or both of the last 2 groups showed a better amelioration in FBG, serum insulin level, and HOMA-IR in comparison to the untreated diabetic group, where the decrease in FBG was accompanied by an increase in the insulin level and linked to a decline in insulin resistance in various treated groups. Notably, the combination therapy groups showed a more potent enhanced effect on improvement of these parameters when compared to the untreated diabetic animals rather than only 1 agent. This may be attributed to the enhanced combined treatment effects in the STZ/HFD group, which in turn leads to exert antidiabetic activity by decreasing the blood glucose level and improving pancreatic β-cell function that leads to promoting insulin release and enhanced sensitivity to insulin. 39
In the present investigation, animals with diabetes demonstrated a notable increase in weight at the final of the trial, compared to their control littermates, AJiboye et al 40 agreed with our observation. On the contrary, treating diabetic rats with metformin alone or combined with either gamma radiation, quercetin, or both exhibited a significant reduction in weight unlike the diabetic animals without treatment. The combined agents had an enhanced effect on the rise in body weight, rather than either agent alone; this might be explained by the treatment regimen’s capacity for controlling the level of blood sugar.
It was discovered that diabetes causes oxidative cellular injury brought on by hyperglycaemia. 41 This is consistent with earlier research demonstrating that diabetes markedly changed the oxidative stress in the brain markers, as evidenced by decreased enzymatic antioxidant properties, specifically GPx, besides elevated MDA levels (a marker of lipid peroxidation). 42 The results of this research revealed that levels of peroxidation of lipid in diabetic rat brains were markedly elevated while GPx activity was noticeably lowered. The reason for the raised MDA and decline in the GPx activity could be caused by hyperglycaemia causes overproduction of ROS that overwhelms antioxidant mechanisms and initiates lipid peroxidation, which accelerates cellular oxidative injury. 41 Oppositely, the increased production of MDA and decreased content of GPx were obviously restored by the different treatments against the diabetic rats group, suggesting a clear antioxidant and antidiabetic activity of them.
Cholinergic neurotransmitters, eg, acetylcholine (ACh) are strongly expressed in the hippocampal region and cerebral cortex of the brain and responsible for memory and cognitive functions, which are catalysed by the breakdown of acetylcholinesterase (AchE). The increase in cholinesterase activities causes neuronal function impairment, as found mostly in chronic diabetes patients. 43 In hyperglycaemia, reduced insulin transmission in the brain lowers ACh synthesis and alters the insulin signalling pathway, leading to memory loss. 44 According to our investigation, the brain level of AchE is elevated significantly in diabetic rats induced by hfd/stz relative to the diabetic control group. The elevated activity of AChE resulted in reduced cholinergic action, which caused a diminution of acetylcholine. 45 Conversely, rats treated with previous therapies showed a reduction in the AchE activities by managing oxidative stress. All combined treatment groups revealed enhancement in AChE activities, and the combined of IR + MET + Q produced significantly greater reductions in AChE activity compared to any single treatment alone (P < 0.001), indicating the benefits of a multi-modal therapeutic approach, suggesting amelioration of neuronal damage, which may be associated with correction of memory decline, so they exert anti-cholinesterase activities in the brains of encephalopathy rats.
MMPs are endopeptidases that breakdown the most proteinous components of the extracellular matrix, or ECM, and basement membranes. 46 MMP-2, or Gelatinase-A, is involved in the functioning of the brain-blood barrier (BBB) integrity and brain diseases that are characterized by inflammation, oxidative stress, and cerebral injury. 47 It has been showed that MMP-2 actively breaks down tight junction proteins at the BBB, further increasing BBB permeability. 48 A damaged BBB leads to an influx of brain-circulating pro-inflammatory cytokines, exacerbating neuroinflammation. The current study showed that the MMP-2 expression in the brain of diabetic rats was significantly enhanced compared to the normal control group and was decreased by treating diabetic rats with metformin alone or in combination with gamma radiation, quercetin, or both of them. The MMP-2 elevation in the brain, is followed by a disturbance of the BBB, enhanced neuroinflammation, and decreased cognitive function. 49 Additionally, our data confirm a possibility that prolonged hyperglycaemia might be related to increased activity of MMP-2 expression level by increasing intracellular ROS, which disturbs the harmony between oxidation and antioxidants and causes inflammation. 50 But the combined treatment agents MET + IR + Q have been suggested to has anti-oxidant and anti-inflammatory effects and modulate BBB integrity, which leads to a decline in the action of MMP-2.
Insulin receptor substrate-1 (IRS-1) is is a key modulator of insulin signaling, and low IRS-1 levels are thought to be a sign of insulin resistance in clinical studies. Upon insulin binding to its receptor, IRS-1 is phosphorylated at tyrosine residues. This phosphorylated tyrosine residue plays a critical effect of initiating a sequences of downstream insulin signaling that translocate glucose transporter-4 (GLUT4) to the cell membrane to transport a substantial part of the circulating glucose. 51 Dysregulation of IRS1 signaling is among the fundamental mechanisms of the development of diabetes. A rise in oxidative damage & inflammation activated protein kinases that are caused by hyperglycemia inhibit insulin-induced IRS1 tyrosine phosphorylation in diabetes, therefore deactivating or supressing the insulin pathway which reduces glucose disposal, referred to as insulin resistance.51,52 Our present study revealed suppression of the IRS1 protein in the diabetic group compared to control group. Hyperglycaemia causes a rise in inflammation additionally to ROS generation that leads to impairment in insulin signalling. 53 Oppositely, treatment diabetic rats with metformin alone or with either gamma radiation, quercetin, or both showed enhancement in IRS1 expression level. It is suggested that these treatments show neuroprotective, anti-diabetic, antioxidant, and anti-inflammatory roles, which in turn enhance insulin signaling.
In diabetic patients and animal models, glucose metabolism in the brain is profoundly affected. The transport of glucose, glycolysis, the pentose phosphate pathway, and the tricarboxylic acid cycle are all disrupted. These abnormalities lead to decreased adenosine triphosphate synthesis and increased oxidative stress and inflammation. Consequently, this cascade results in reduced synthesis of neurotransmitters and their modulators, disrupted synaptic plasticity, and ultimately neuronal damage. 54 Chronic inflammation has been linked to disruption of the growth factors belonging to the neurotrophin family, particularly brain-derived neurotrophic factor (BDNF). 55 The BDNF serves a crucial effect on the pathophysiology of T2DM owing to enhancing glucose metabolism, insulin sensitivity and regulating synaptic plasticity. 54 Zou et al 56 study confirmed that BDNF level in the brain tissue was positively correlated with that in the blood serum. In the current investigation, BDNF transcript levels in the brain tissue of diabetic rats were declined relative to normal control. According to earlier research, diabetes significantly lowered the level of serum BDNF relative to normal control,57,58 that aligns with our findings. It is found that brain BDNF transcript level downregulated in diabetic rats allows the upregulation of two synaptic plasticity markers, spinophilin and synaptophysin, suggesting a neurodegenerative function of BDNF. Also, BDNF increased hyperglycemia-induced microglial suppression and increased elevated levels of inflammatory factors, eg, TNF-α, IL-6 resulting in neuroinflammation, 54 moreover, elevated the levels of glucose inhibit the output of BDNF from the brain. 59 Conversely, BDNF expression levels are increased in all treated diabetic rats. This may link to the antidiabetic and anti-inflammatory impact of BDNF in addition to modulating synaptic function in the diabetic hippocampus. So, BDNF upregulation enhancement synaptic damage and ameliorates neuroinflammation induced by hyperglycaemia.
MicroRNAs are small powerful non-coding nucleotides that regulate gene expression and play an important role in inflammation and oxidative stress and contribute to obesity development. 3 They can silence gene expression by inducing mRNA degradation or repressing mRNA translation and regulate the transcription of genes through binding to the 3′ untranslated region (3′UTR) of the mRNA of the target gene, causing transcriptional inhibition or degradation. 60 MiR-107 is among the most interesting miRNAs for assessing T2DM and resistance of insulin. 60 The level of miR-107 was increased in overweight and obese individuals compared to normal-weight individuals. Herein, the current study showed higher expression levels of the miR-107 transcript in the brain of the diabetic group in comparison with the control group. These findings were consistent with those accomplished by Šimonienė et al, 61 who reported that the level of miR-107 gene expression is up-regulated, and its dysregulation has been linked to the correlation between miR-107 and insulin resistance. Also, it has demonstrated that miR-107 directly binds the CAV-1 3UTR sequence, which is necessary for stabilizing the structure of the insulin receptor to allow proper insulin signaling. Moreover, the decreased transcript levels of miR-107 led to an improvement in glucose homeostasis and insulin sensitivity. 62 Limiting the activity of the endonuclease enzyme DICER, a member of the endonucleases family 111 that is important for converting miR precursors into mature miRs, is another way that miR-107 contributes to resistance of glucose and insulin metabolism. This suggested that certain mature miR might feedback to regulate dicer expression. 63 Conversely, the outcome of all diabetic treated groups relative to the diabetic group revealed that a decline in the expression level of miR-107 due to all different treatments boosts sensitivity to insulin, either directly or indirectly, this ought to decrease the expression of miR-107.
More interestingly, it is found that BDNF was the direct downstream objective of miR‐107. MiRNA-107 has the ability to control the expression of BDNF at the transcriptional level by pairing with the base of the 3′- untranslated region (3′-UTR) of BDNF mRNA. 64 According to earlier research that found BDNF was a downstream regulator of miR-107 when the overexpression of miR-107 dramatically reduced the degree of BDNF mRNA.64,65
SIRT1 is a nicotinamide adenine dinucleotide (NAD+)-dependent deacetylase, and it is 1 of the Sirtuins family members that deacetylates histone and non-histone proteins. 66 SIRT1 has been involved in insulin resistance and impaired β-cell function, which are the hallmarks of T2DM. 67 Many investigations have revealed that oxidative stress conditions (ie, ROS overproduction) can lead to a decrease in the expression of SIRT1 activity in diabetic rats, both in vivo and in vitro. 68 In the current research, qRT‐PCR results in the group of diabetes revealed that the transcription of the SIRT1 gene was downregulated relative to the normal group, which seems to be related to the oversupply of ROS leading to a dysregulation of the balance between ROS and SIRT1, therefore leading to an increase inflammatory response. Conversely, treating diabetic rats with different previous agents is able to activate SIRT1 directly or indirectly. Reports indicate that Sirt1 has a brain protective role by modulating the expression of antioxidant enzymes, anti-inflammatory, and reducing ROS. Invariably, the use of various therapies agonists of SIRT1, that directly increase SIRT1 activity attenuates oxidative stress and inflammatory responses and related tissue injuries. SIRT1 upregulation also promotes β cell recovery, which regulates insulin secretion. 69
NF-κB signaling is a master switch system in oxidative stress that activates pro-inflammatory and pro-oxidant responses in diabetic rats. 1 The present investigation revealed a significant inflammatory response in the brain of the diabetic rat group, as evidenced by elevated mRNA NF-κB expression in comparison with the normal group. It’s been proposed that NF-κB overexpression can lead to enhanced oxidative stress, thereby affecting the BBB permeability, which leads to increased Para cellular permeability of solutes, ultimately producing brain injury, which is linked to cognitive damage rats with diabetes. 70 Also, it’s been proven that the NF-κB route is triggered under high glucose exposure, which causes the release of a huge number of inflammatory cytokines, which consequently causes β cell dysfunction in the hyperglycaemic state.70,71 Therefore, NF-κB, plays a vital role in controlling inflammation and oxidative stress in diabetic rat’s brains. Notably, treatment with different agents relative to the untreated diabetic group exhibited significant improvements in NF-κB expression in relation to the diabetic group. The combined therapies showed a decline in NF-κB gene expression, which participates in the neuroprotective effects; the co-treatment might exert anti-oxidant, anti-inflammatory, and antidiabetic activity than metformin monotherapy in HFD/STZ-induced diabetic rats.
The pathway of the NF-κB signalling is provoked by post-translational histone modifications like acetylation, deacetylation, phosphorylation, and methylation, which generate an ‘NF-κB -signalling code’. 72 Many lysine sites on NF-κB’s p65 subunit may be acetylated, promoting the transcription of NF-κB and its capacity to bind to target genes’ promoter regions to drive the inflammatory response. 73 Throughout the inflammation, NF-κB can be directly inhibited by SIRT1 in the inflammatory signaling pathway, where SIRT1 has the ability to attach to the NF-κB p65 subunit directly and specifically eliminate the alteration of acetylation at lysine 310 (k310), hence, preventing the transcriptional activity of p65 and decreasing expression of its pro-inflammatory focus genes. 74 Furthermore, RelA/p65’s deacetylation at lysine 310 promotes methylation at lysines 314 and 315, which is necessary for the ubiquitination and destruction of RelA/p65. 75
The level of miR-107 was increased in overweight and obese individuals compared to normal-weight individuals, which decreased SIRT1 levels by directly binding to a target sequence in the 3′-untranslated region of SIRT1 mRNA, leading to a reduction NF-κB and a concomitant increase in ROS. This finding suggests that quercetin suppresses HFD-induced inflammation by eliminating miRNA-107 mediated repression of SIRT1 and subsequently regulating SIRT1-NF-κB-mediated inflammation.
The histopathological study of the hippocampus and cerebral cortex of diabetic rats was consistent with the biochemical tests. The diabetic group showed morphological changes indicating nerve cell injury, which agrees with previous studies. 76 Hyperglycaemia-induced neuro-inflammation and oxidative stress are suggested mechanisms for diabetic neuronal degeneration in the brain. 77 Treatment with either metformin alone or combined with either gamma radiation or quercetin partially alleviated the histopathological changes. The 3 combined therapy was able to reverse these changes to an apparently normal architecture, supporting the importance of good glycaemic control and the nootropic effects of metformin, gamma radiation, and quercetin.
In high-fat diet plus streptozotocin (HFD + STZ)-diabetic rats, the use of metformin, quercetin, and low dose gamma irradiation together represent combined therapy which significantly downregulates expression of miR-107. Metformin’s actions are partially explained by increased insulin sensitivity secondary to SIRT1 activation, as well as decreased glucose production from the liver. In addition quercetin has also notable antioxidant properties with strong anti-inflammatory defense which protects pancreatic β-cells and improves their glucose metabolism by inhibiting NF-κB signaling pathways. 78 Low-dose gamma irradiation induces hormesis, upregulating endogenous antioxidant systems and enhancing cellular stress resistance through activation of BDNF pathways and improved mitochondrial function. 79 Furthermore, this combination therapy is known to downregulate miR-107 expression, which is known to be elevated in diabetic state and contributes to the insulin resistance by targeting the Insulin receptor substrate-1 (IRS-1) and brain-derived neurotrophic factor (BDNF). 80 The suppression of miR-107 by this combined treatment enhances IRS-1/SIRT1 insulin signaling pathways while simultaneously reducing NF-κB-mediated inflammation and promoting BDNF-dependent neuroprotection in peripheral tissues. The HFD + STZ model would likely show improved glycemic control, reduced oxidative markers, enhanced pancreatic function, and restored miR- 107/IRS-1/SIRT1/BDNF signaling axis with concurrent NF-κB suppression under this therapeutic regimen. 81
Limitations
This study has several limitations that should be considered when interpreting the results. The relatively short duration of the study, spanning only 8 weeks, may have been insufficient to observe significant changes in diabetic neurodegeneration. Furthermore, the study focused solely on molecular changes, excluding behavioural and functional tests, which are crucial for evaluating changes in neurological and cognitive functions in treated animals. Their exclusion was necessitated by the pre-established scope and parameters of the tissue sample collection.
Conclusions
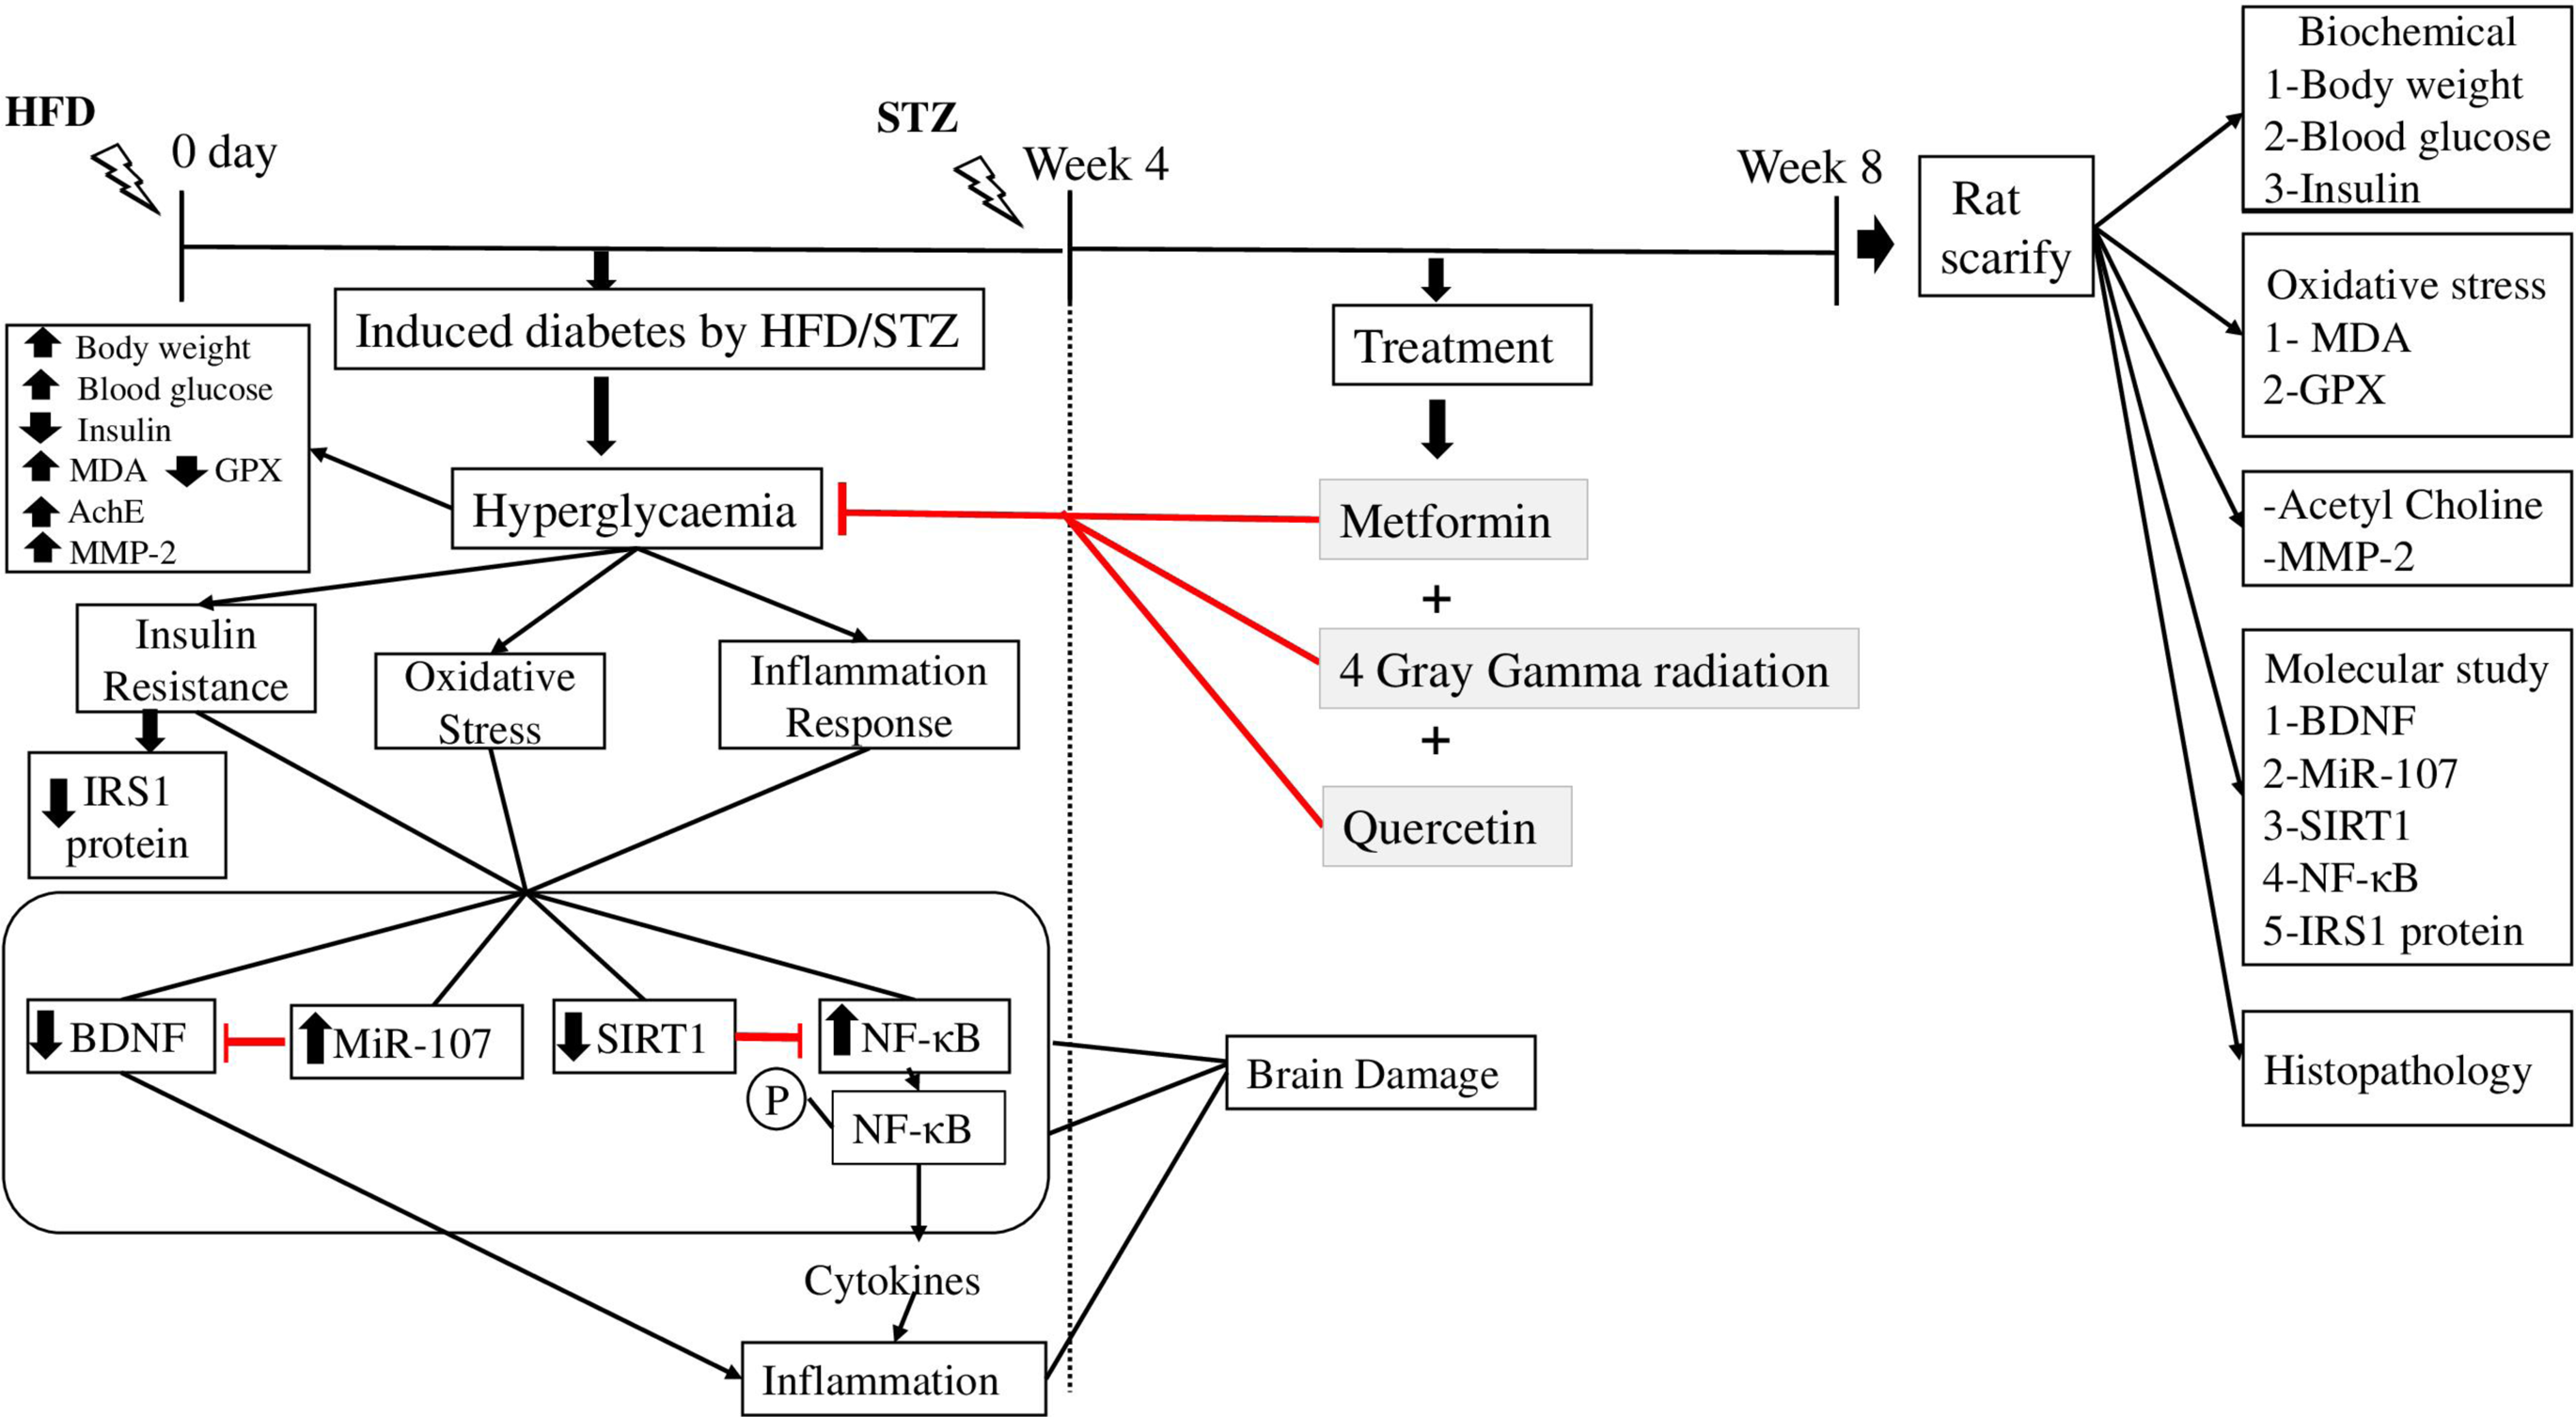
In this investigation, gamma radiation and quercetin were found to protect the brain from HFD/STZ-induced T2DM brain damage with metformin synergistically, which provided an approach to alleviating anti-diabetic and neurodegenerative diseases. Taken together, the functional role of miR-107 on scavenging free radical, improving insulin sensitivity, activating SIRT1/BDNF, and lessening the NF-κB signaling pathway. In addition, it ameliorated the damage of brain tissues and reduced body weight, HOMA-IR, MMP-2, AchE, and MDA caused by elevated glucose levels. Furthermore, it alleviated the expression of IRS1 and ROS production while restoring the antioxidant capacity. Moreover, our data demonstrates that combined treatment with biguanide, gamma irradiation, and flavonol produces significantly stronger beneficial outcomes compared to monotherapies, supporting our central hypothesis that a multi-modal approach is more effective for mitigating brain injury in type 2 diabetic rats. Taken together, gamma radiation and flavonol with biguanide may have a synergy anti-diabetic activity. Our findings may facilitate the understanding of the novel effects of gamma radiation, quercetin alone or combined with the anti-diabetic drug MET and suggest a newly recognized benefit of gamma radiation or quercetin in T2DM. The data from this research suggest that the combination of gamma radiation and/or quercetin with metformin has the potential to be developed into alternative means for the treatment or amelioration of the condition of neurodegenerative disease by this target. Overall, our results support the therapeutic potential of metformin combined with gamma radiation and quercetin, particularly in targeting brain-related pathways in diabetic neurodegeneration. While our results are promising, future research should include longer-term studies, larger sample sizes, varied dosages, and comprehensive behavioural assessments. (Figure 9) Mechanisms Underlying Insulin Resistance, Oxidative and Inflammatory Pathway Suppression by Combining Metformin With Gamma Radiation and Quercetin. They Promote the Activation of Insulin Signaling Molecules IRS1through Caveolin1 (CAV-1). In Addition, They Enhance the Cellular Function via MIR-107 Downregulation. They Alleviate Diabetic Complications by Inhibition of Stressful Stimuli and Improve Antioxidant Capacity Through NF-κB Downregulation which Influenced by Acetylation Caused by Activation of SIRT1 .Also, They Improve Glucose and Insulin Homeostasis by Activation BDNF. They Exert Their Anti-inflammatory Efficiencies by Interrupting the ROS Mediated Inflammation and Down-Regulate all Inflammatory Mediators. (↑): Up-Regulated Targets; (↓) Down-Regulated Targets
Footnotes
Ethical Approval
Animal ethics were approved by the Experimental Animal Ethics Committee of Faculty of veterinary medicine local Institutional, Benha University, Egypt (BUFVTM 04/01-/22).
Consent for Publication
It is neither a human study nor describing human transplantation studies. It is experimental research that was performed in accordance with The Animal Ethics Committee of the Faculty of veterinary medicine, Benha University, Egypt (BUFVTM 04/01-/22). With approval from Egyptian Atomic Energy Authority’s Central Scientific Publishing Committee (Ref No: 235/7/2024).
Author contributions
Omayma A. R. Abozaid and Fatma S. M. Moawed designed the study. Fatma S. M. Moawed and Hanaa F. B. Gabr carried out the practical work. Marwa A Esmat performed the data analysis and wrote the draft of the manuscript and critically read and revised the manuscript. All authors approved the manuscript.
Funding
The authors disclosed receipt of the following financial support for the research, authorship, and/or publication of this article: Open access funding provided by The Science, Technology & Innovation Funding Authority (STDF) in cooperation with The Egyptian Knowledge Bank (EKB). This research did not receive any specific grant from funding agencies in the public, commercial, or not for profit sectors.
Declaration of conflicting interests
The authors declared no potential conflicts of interest with respect to the research, authorship, and/or publication of this article.
Data Availability Statement
The datasets used and/or analysed during the current study available from the corresponding author on reasonable request.