
Abstract
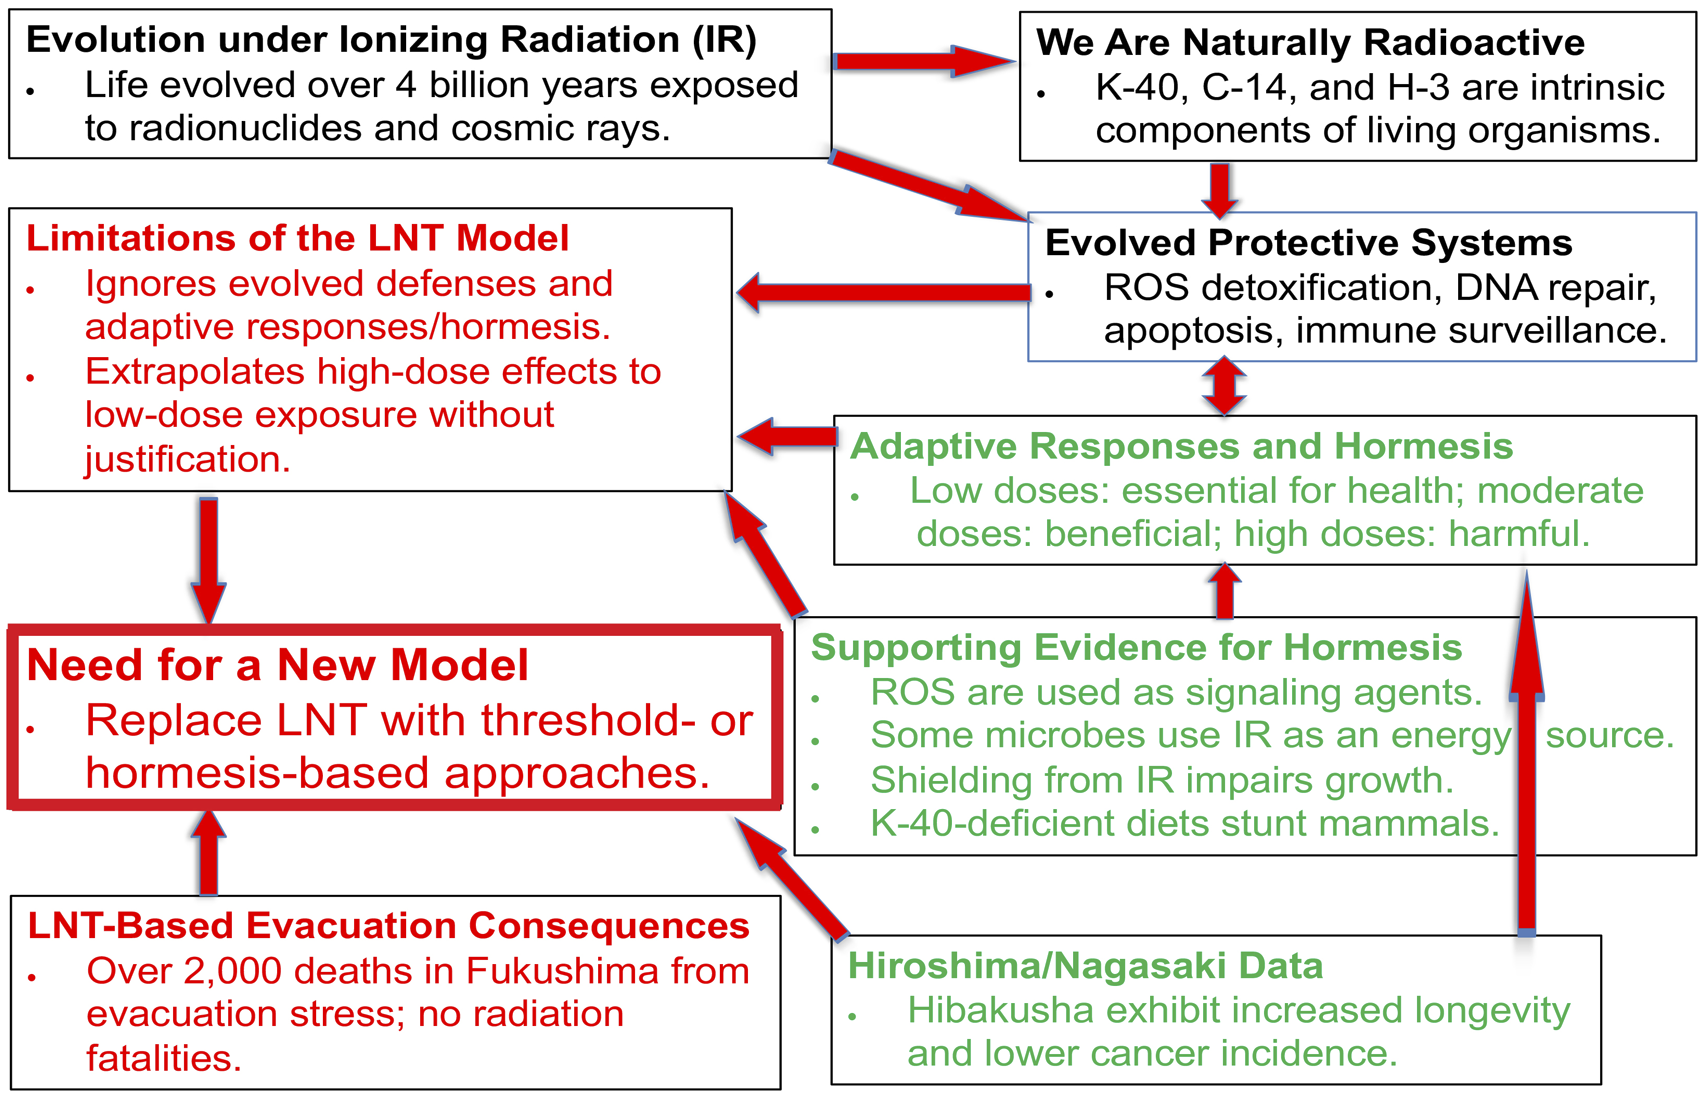
Living organisms have been exposed to ionizing radiation throughout Earth’s 4-billion-year history, with humans presently receiving about 2 mSv of ionizing radiation every year. While radiation generates reactive oxygen and nitrogen species (ROS and RNS), organisms have evolved mechanisms to neutralize these toxic molecules and utilize them as signal transducers. High doses of radiation are harmful, but low doses are seemingly essential, and moderate doses can provide benefits—a phenomenon known as hormesis. Radiation exposure is currently regulated by the linear no-threshold model (LNT), which assumes all radiation is harmful, even at the smallest doses. However, substantial evidence, including insights into biological defense mechanisms like DNA repair, apoptosis, and immune system, supports hormesis. Although the Life Span Study (LSS) data historically backed the LNT, closer analysis reveals that low-dose radiation is linked to increased life expectancy and reduced cancer risk, invalidating LNT. During the 2011 Fukushima nuclear disaster, the Japanese government, adhering to the LNT-based precautionary principle, evacuated residents despite low contamination levels. This decision caused over 2000 deaths, though no fatalities were directly attributed to radiation. These findings challenge the LNT model and highlight the need for regulatory standards that incorporate thresholds and/or hormesis principles, better reflecting biological evidence.
Introduction
Japan has endured two major radiation-related disasters in its history: the atomic bombings of Hiroshima and Nagasaki, and the accident at the TEPCO Fukushima Daiichi Nuclear Power Plant (FDNPP). While no direct deaths were caused by radiation from the Fukushima accident, over 2,000 lives were lost due to the enforced evacuation, which was carried out based on the precautionary principle rooted in the linear no-threshold model (LNT). LNT assumes that radiation is infinitely harmful in direct proportion to the dose, regardless of its magnitude. But was the enforced evacuation truly necessary?
The answer lies in the data from Hiroshima and Nagasaki, where 210,000 lives were lost. These data show that while high doses of radiation are undeniably harmful, low doses can have beneficial effects—a phenomenon known as radiation hormesis. LNT and the concept of hormesis are fundamentally incompatible: if the LNT is correct, hormesis cannot be true, and vice versa. 1
If Fukushima’s contamination levels are examined through the lens of this evidence, it becomes clear that the evacuation of neighboring inhabitants may not have been required. However, despite scientific findings from Hiroshima and Nagasaki that refute the LNT, it continues to be politically misinterpreted and upheld to this day.
The precautionary principle based on the LNT model led to avoidable casualties in Fukushima, illustrating how flawed hypotheses like LNT can result in significant human suffering. Recognizing the profound consequences of this misjudgment is essential for preventing similar disasters in the future.
Data and Information Sources
This study is focused on the safety of radiation, and all data used here were obtained from publicly available sources including articles published in academic journals. The number of hibakusha (A-bomb survivors) and their average age was shown by the Ministry of Health, Labour and Welfare (MHLW). 2 The map of the Great East Japan Earthquake (GEJE) was obtained from the Japan Meteorological Agency. 3 The map of radio-contamination in Fukushima was from Fukushima Prefecture. 4 The number of disaster-associated deaths was issued by the Cabinet Office 5 and the Reconstruction Agency. 6 These are reported in Japanese.2-6 Some figures and tables were adapted from my previous publications; the corresponding reference numbers are indicated in each figure or table caption.
Findings
Ionizing Radiation (IR) is Abundant in Our Surroundings
Radionuclides are Abundant in Our Surroundings
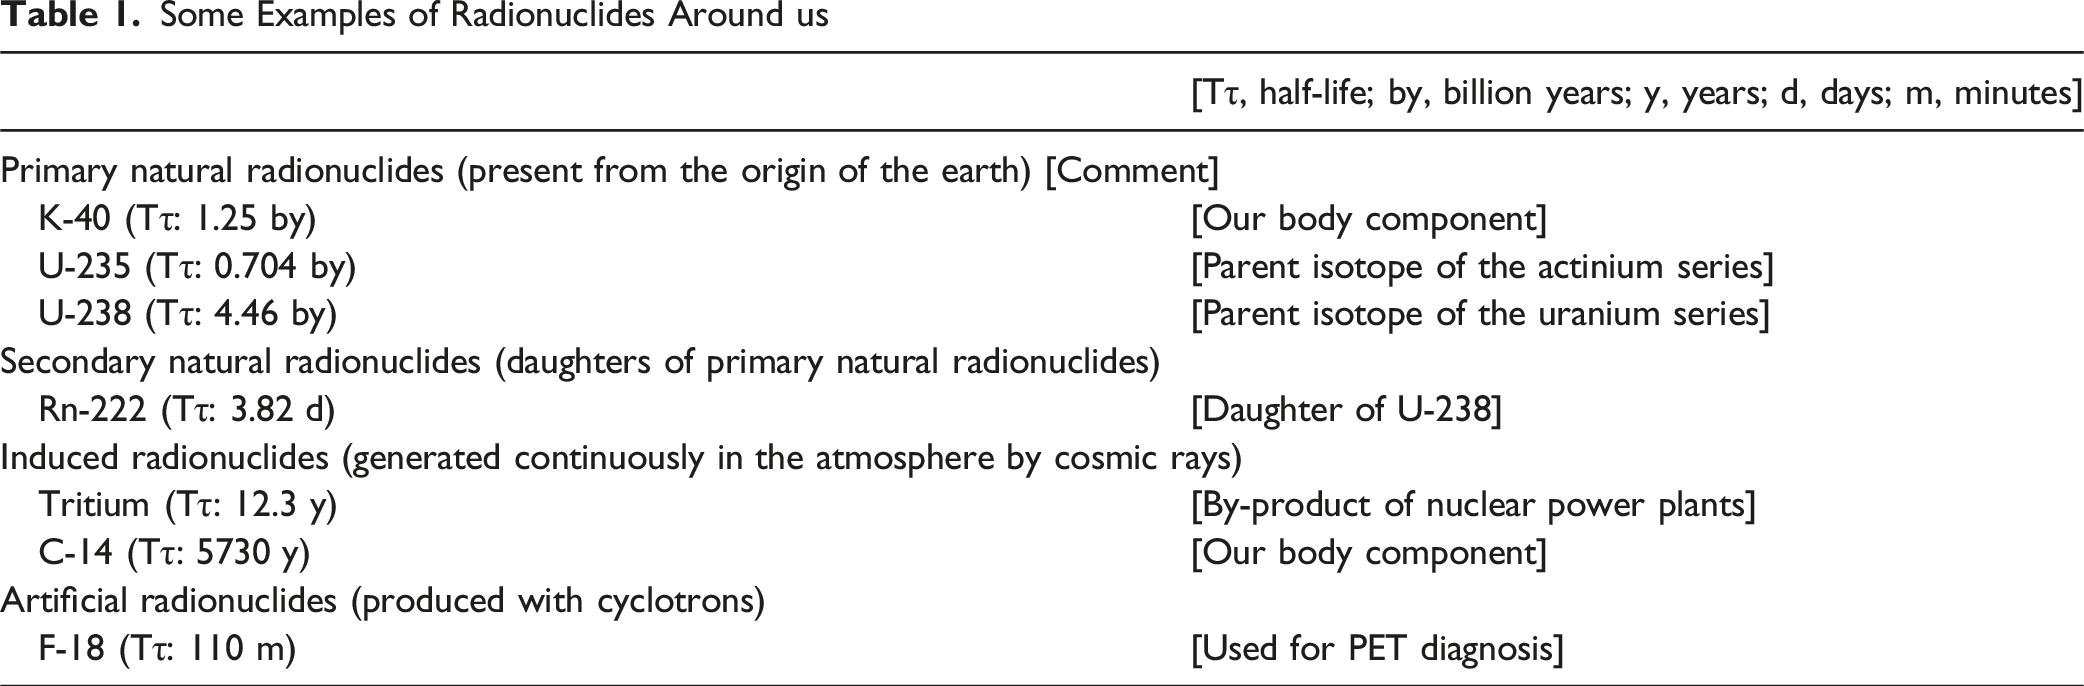
Some Examples of Radionuclides Around us
In this paper, units such as gray (Gy) and sievert (Sv) are used. The Gy is a physical unit that quantifies the absorbed dose of radiation, while the Sv is used to assess radiation risk to humans. Therefore, the use of Sv is not appropriate for experiments involving non-human animals or in vitro studies. Sv is derived by applying two weighting factors to the absorbed dose in Gy: the equivalent dose, which accounts for the type and energy of radiation to reflect its biological impact on specific tissues or organs (unit: Sv), and the effective dose, which further adjusts the equivalent dose using tissue weighting factors to estimate the overall risk to the entire body (unit: Sv). These weighting factors are defined by the International Commission on Radiological Protection (ICRP). 8
Among the naturally occurring radionuclides listed in Table 1, uranium-238 (U-238) undergoes more than ten successive decay steps—emitting α, β, and/or γ radiation—before ultimately becoming the stable, non-radioactive isotope lead-206 (Pb-206). This decay pathway is known as the uranium series, or the 4n+2 series. Similarly, uranium-235 (U-235) follows the actinium series, also called the 4n+3 series, eventually transforming into stable lead-207 (Pb-207).
Potassium-40 (K-40), which is one of the components of the human body, decays either through beta emission to calcium-40 (Ca-40) or through positron emission/electron capture to argon-40 (Ar-40). Although radon-222 (Rn-222) has a relatively short half-life of 3.8 days, it is continuously generated as part of the U-238 decay chain and thus persists in the environment as long as U-238 is present.
In addition, tritium (H-3) and carbon-14 (C-14) are constantly produced in the atmosphere through interactions with cosmic rays and are incorporated into living organisms. C-14 decays via beta emission into nitrogen-14 (N-14), while H-3 decays into helium-3 (He-3) through beta emission.
Beyond naturally occurring radionuclides, a wide range of artificial radionuclides are also produced for use in various experimental and clinical applications. One such example is fluorine-18 (F-18), a positron-emitting radionuclide that plays an important role in PET (positron emission tomography) imaging, particularly for whole-body cancer screening, as well as the detection of metastases and recurrence.
Natural Occurrence of Potassium-40 (K-40) in Foods and Living Organisms
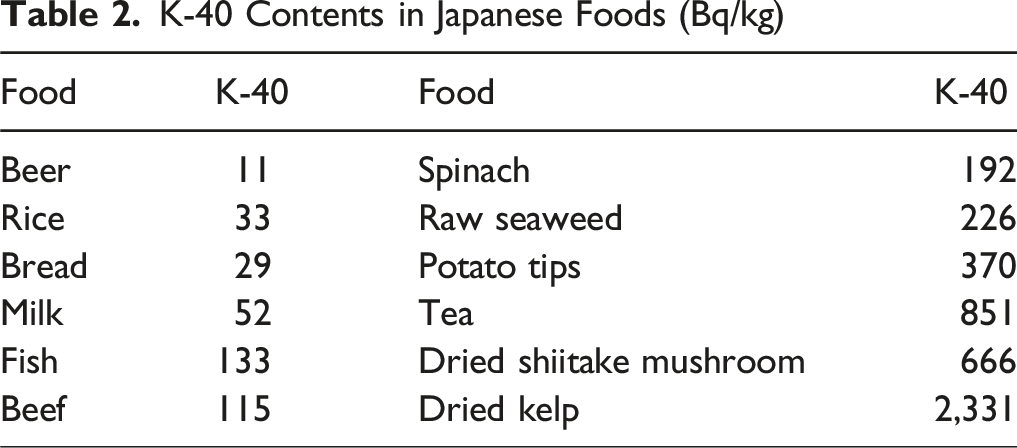
K-40 Contents in Japanese Foods (Bq/kg)
The Human Body is Exposed to Radiation from Both Internal and External Sources at a Level Corresponding to Approximately 20,000 Ionizing Events per Second
Internal and External Exposure Doses of Natural Radiation
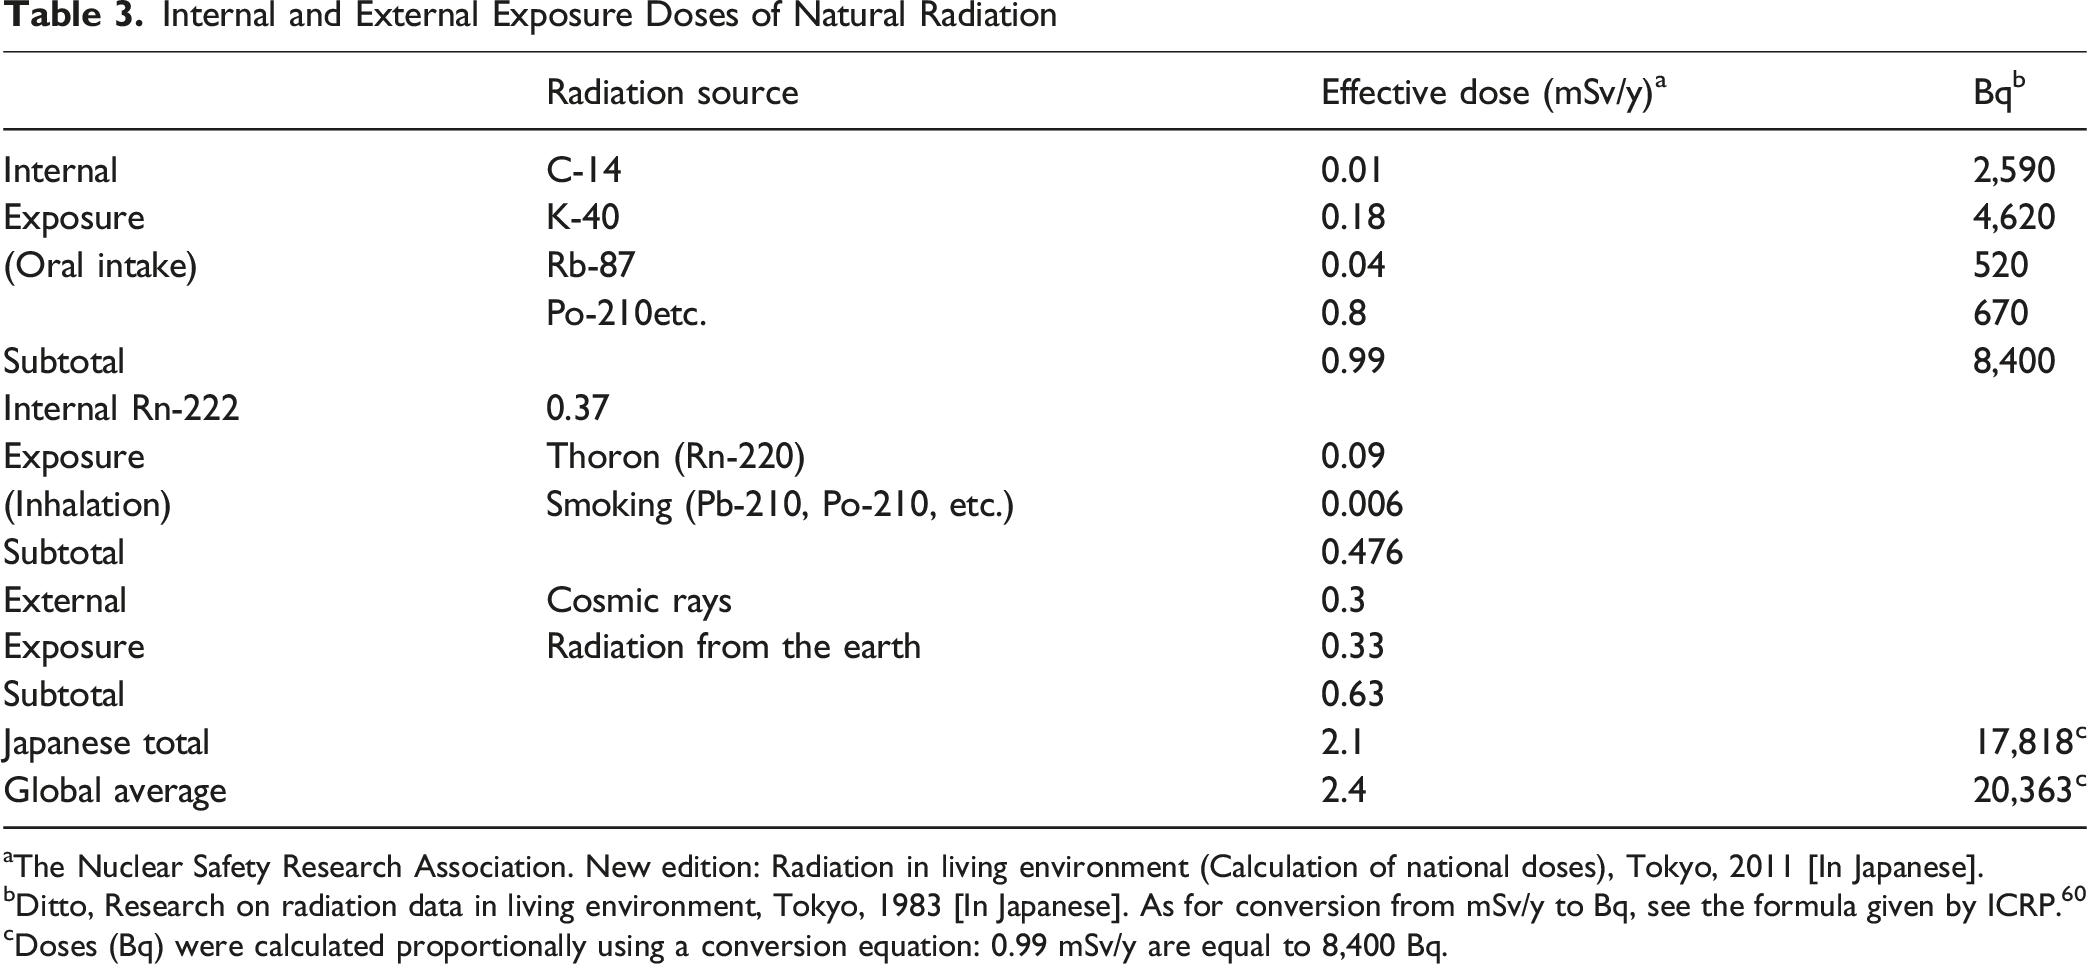
aThe Nuclear Safety Research Association. New edition: Radiation in living environment (Calculation of national doses), Tokyo, 2011 [In Japanese].
bDitto, Research on radiation data in living environment, Tokyo, 1983 [In Japanese]. As for conversion from mSv/y to Bq, see the formula given by ICRP. 60
cDoses (Bq) were calculated proportionally using a conversion equation: 0.99 mSv/y are equal to 8,400 Bq.
It should be noted, however, that this conversion from dose rate (mSv/y) to activity (Bq) is only applicable to radionuclide intake and not to external radiation sources such as X-rays and γ-rays, which do not have a defined decay rate. Therefore, this approximation—suggesting that the body experiences around 20,000 ionizing events per second—should be interpreted as a conceptual representation of average natural background radiation exposure, rather than a precise physical measurement.
Scott et al provide a table showing the number of disintegrations per day due to natural radioactivity in the body of a typical 70-kg adult human. 10 When these disintegrations are converted to Bq, the total is 8,496 Bq. Applying this value to an annual dose of 2.4 mSv results in 20,390 Bq. Similarly, Hecht reports a disintegration rate of 8,154 Bq, 11 which corresponds to 19,569 Bq when applied to the same annual dose of 2.4 mSv. The Health Physics Society indicates that the total disintegrations from K-40, C-14, P-210, and Po-210 is 8,120 Bq, 12 which translates to 19,488 Bq under the same conditions. Therefore, on average, we receive approximately 20,000 ionizing events per second.
Hormesis Challenges LNT, Whose Limitations Stem from Overlooking Evolutionary Processes
Epidemiologists often adopt an agnostic stance, arguing that the available data lacks the resolution needed to determine whether statistically significant differences exist in low-dose radiation (LDR) areas, and no one knows whether a threshold exists. A persuasive critique of this LNT-based argument, grounded in evolutionary biology, is presented in the article ‘Epidemiology without Biology’.
13
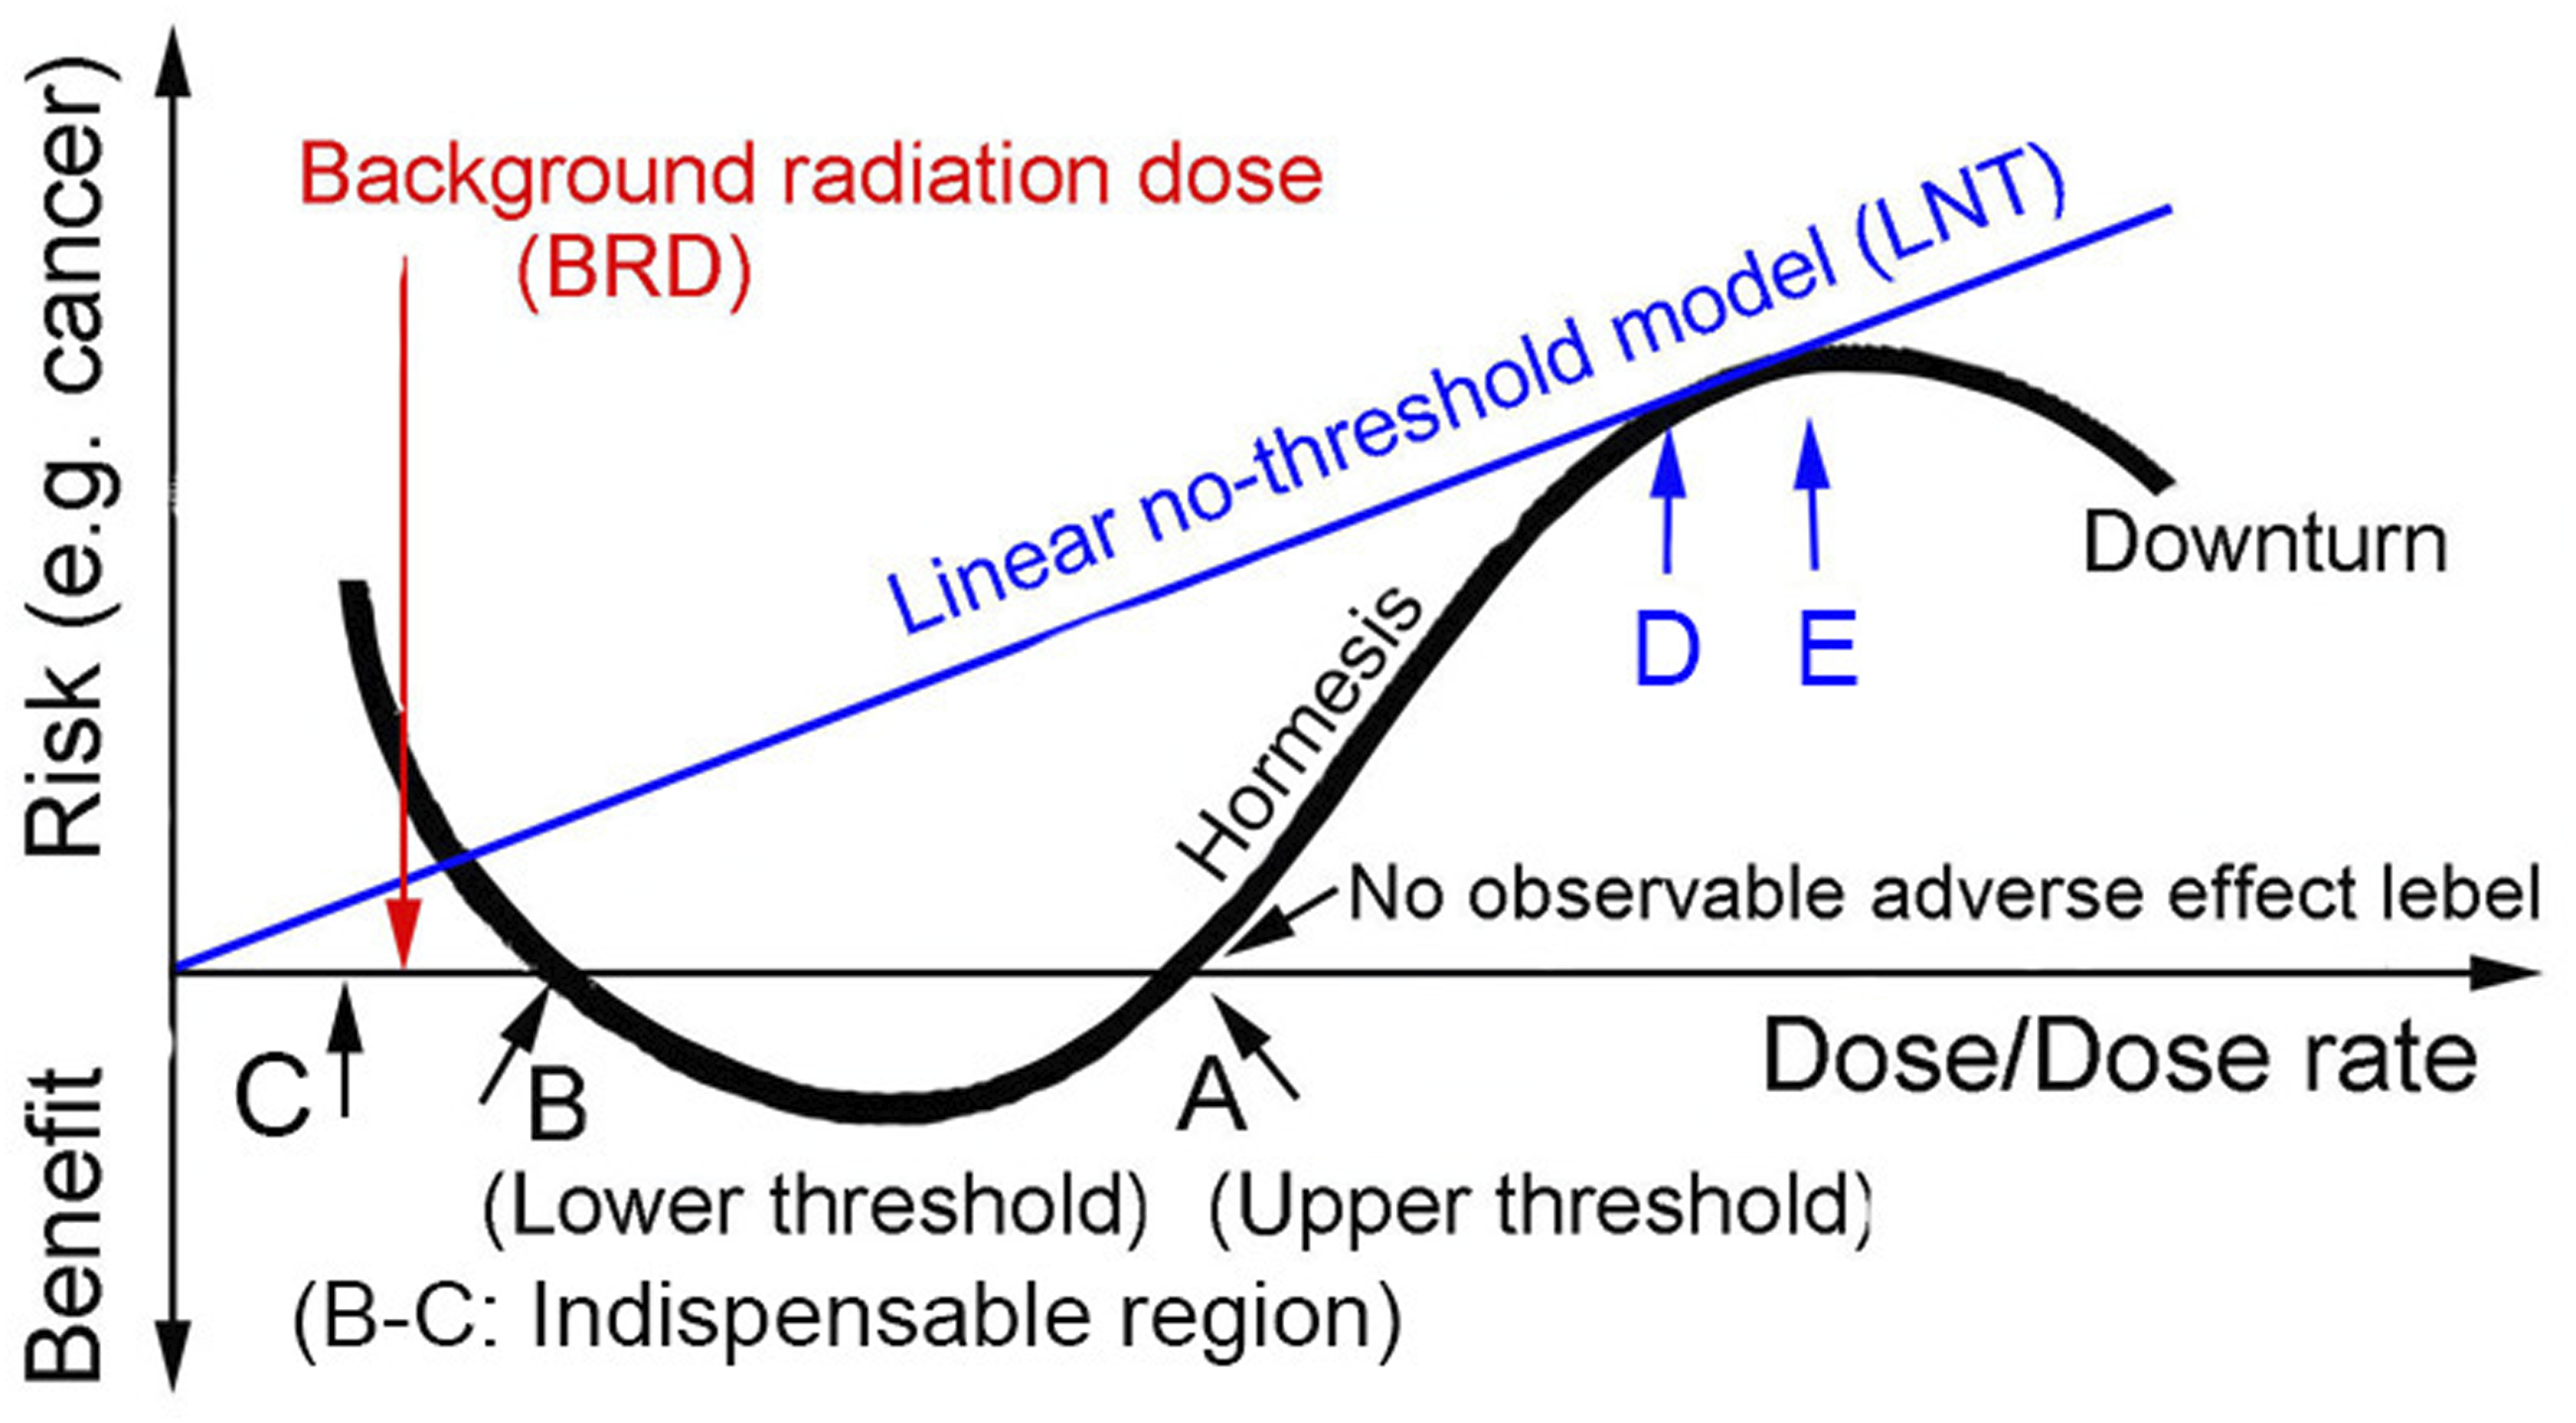
In fact, if hormetic responses are observed, they could invalidate LNT (Figure 1). LNT and hormesis are fundamentally incompatible. If hormesis is correct, LNT is incorrect, and vice versa. Comparison of Dose-Response Models: Linear No-Threshold (LNT) vs. Hormesis. The Blue Line Represents the LNT Model, which Assumes Any Radiation Dose Increases Risk. This Model Was Derived From High-Dose Experiments in Drosophila melanogaster and Extrapolated to Lower Levels, as Discussed in1. The S-Shaped Curve Illustrates the Hormesis Model, where low Doses May Have Beneficial Effects. Points A and B Mark the Range of Beneficial (Hormetic) Doses, while B‐C Indicates a Zone where Small Amounts of Radiation May be Essential for Normal Biological Function. The Background Radiation Dose (BRD) Lies Below Point B, where Slight Radiation is Believed to Stimulate Biological Activity. At Higher Doses, the Hormesis Curve Declines, Indicating Harmful Effects, as Described by Sinclair
19
Substantial evidence supports hormesis. I have previously reviewed evidence supporting hormesis in. 1 Doss presented data favoring radiation hormesis and discussed its implications in his article “Facilitating the End of the Linear No-Threshold Model Era”. 14 Agathokleous and Calabrese argued that the dose–response relationship for the 21st century should be based on hormesis, rather than the LNT model. 15 Luckey’s comprehensive book provides extensive support for hormesis, citing 1269 references. 16 Siegel et al. also advocate for abandoning the LNT assumption in favor of hormesis-based approaches. 17 Jaworowski argues that hormesis can serve as a remedy for fear. 18
IR may have contributed to the creation of life on Earth. 1 Living organisms have been exposed to IR for billions of years throughout the evolutionary process. In addition to radionuclides (Table 1), radiation originates from various sources, including cosmic rays, solar wind, the Van Allen radiation belts, and thunderstorms. The primary effects of IR include the production of reactive oxygen species (ROS) and reactive nitrogen species (RNS). While ROS and RNS are highly reactive and hazardous when produced in large quantities, their primary source is metabolic processes associated with aerobic respiration. According to the quantitative analysis by Pollycove and Feinendegen, the rate of ROS production from normal respiration exceeds that from whole-body gamma exposure at 1 mGy/y by a factor of approximately 108. 20 However, living organisms have evolved defense mechanisms to prevent and mitigate the harmful effects of ROS. These include scavenging of ROS, DNA repair systems, removal of damaged cells through apoptosis, and various immune mechanisms. 21 Evolution has not only developed biological systems to neutralize ROS, but also to utilize them as inducers of hormesis, as reported by Scott. 22 Sies and Feinendegen have further proposed that hydrogen peroxide (H2O2), due to its relative stability among ROS, plays a central role in radiation-induced hormesis. 23
When DNA lesions occur, most are effectively repaired. If lesions remain unrepaired, cells with such damage are eliminated through apoptosis. To compensate for lost cells, tissues undergo cell division. For instance, if half of the liver is removed, it regenerates to its original size within about a week—a process known as liver regeneration. Similarly, when one kidney is removed, the remaining kidney enlarges to compensate for the lost function, a phenomenon called compensatory hypertrophy. A more familiar example of compensatory hypertrophy may be the increase in muscle mass resulting from strength training.
Additionally, the immune system has evolved intricate mechanisms to defend against infections and cancer. Hormesis represents another adaptive response that allows organisms to cope with radiation and chemical stressors. Over the course of evolution, biological systems have become remarkably advanced, effectively mitigating the harmful effects of IR.
LNT, however, appears to treat IR as a hazardous agent, regardless of how small the dose may be. The flaws in LNT lie in its disregard for the role of evolution, its inability to account for the repair of radiation damage to the DNA, and also to account for dose-rate effects. Proponents of LNT should heed Dobzhansky’s famous words: Nothing in biology makes sense except in light of evolution—a principle that also underpins the evolutionary development of hormesis-mediated resilience and adaptive protective mechanisms, as cited by Calabrese and Agathokleous. 24
LDR is Likely to be Indispensable for Normal Life
Figure 1 highlights an essential region between points B and C. The LNT model was originally developed to assess cancer risks in humans and employs the Sv unit, which is specific to human radiation exposure. However, since the core premise of LNT is that cancer arises from mutations in DNA—and DNA is the fundamental genetic material in nearly all living organisms (with rare exceptions such as RNA viruses)—it is scientifically relevant to examine the effects of IR across a broad range of biological systems. The following examples from microorganisms and multicellular organisms suggest that LDR may play an indispensable role in maintaining normal biological function, potentially including in humans.
LDR is Likely to be Indispensable: Some Bacteria Utilize IR as an Energy Source
Desulforudis audaxviator bacteria, discovered in a South African gold mine at a depth of 2.8 km, 25 are chemoautotrophic thermophiles that derive essential life components from surrounding rocks using energy from uranium-238 radiation. In this process, CaCO3 in calcite is reduced by H2 to HCO2- (formate), which is subsequently metabolized into acetyl-CoA. Another radiation-dependent microorganism was found in a 2-km-deep aquifer in eastern Siberia. 26
LDR is Likely to be Indispensable: Microorganisms Thrive Deep Underground with the Support of IR
Many microorganisms live on the ocean floor, feeding on organic matter embedded in sediments or precipitated from the ocean. Beneath the sediments, basalt appears, followed by gabbro. These rock layers have pores and cracks through which seawater can seep. Biofilms form along these cracks. The total number of cells within the biofilm, consisting mainly of bacteria and archaea, is estimated to be 1.2 × 1030 cells. 27 Microbial cell density in subseafloor basalt can exceed 1010 cells/cm3. 28 The prosperity of life deep underground is supported by IR. Recent studies have shown that the radiolysis of water continuously produces H2, which is the main electron donor (food) for microorganisms in continental aquifers several km below the earth’s surface. 29 The deeper microorganisms live, the more they depend on radiolytic H2, especially produced in rock formations.
LDR is Likely to be Indispensable: Shielding Experiments
In an experiment in which the protozoan Tetrahymena was irradiated with γ-rays, its proliferation was inhibited when it was shielded with lead bricks, and its proliferation was promoted when it was not shielded. 30 Similar findings were observed with cyanobacterium Synechococcus lividus. 31 In addition to these microorganisms, the growth or viability of the following organisms were also hindered by radiation shielding: Mastigocladus laminosus (alga), Hordeum bonus (barley), and Artemia salina (brine shrimp). 32
LDR is Likely to be Indispensable: Deep Underground Experiments
Italy’s Gran Sasso National Laboratory (LNGS) is situated beneath approximately 1,300 m of bedrock, creating an environment characterized by low background radiation levels. When Saccharomyces cerevisiae (yeast) was cultured and exposed to methyl methanesulfonate, a mutagen, it led to an increased mutation rate. 33 Similarly, Chinese hamster V79 cells exposed to γ-rays exhibited elevated mutation rates. 34 According to LNT, mutation rates should decrease in low radiation environments.
The Waste Isolation Pilot Plant (WIPP) in Carlsbad, New Mexico, is positioned 650 m below the surface. When Deinococcus radiodurans, a radioresistant Gram-positive bacterium, was cultured there, its growth was significantly inhibited. 35 Transcription analyses indicated that background radiation is essential for normal growth. 36 Furthermore, the growth of V79 cells was similarly delayed when cultured in the WIPP environment. 37
LDR is Likely to be Indispensable: K-40 Deficiency Experiments
Of the 20,000 ionizing events we receive every second, approximately 4,600 are attributed to K-40 (Table 3). Luckey investigated the effects of the lack of K-40 on organismal growth. 32 Escherichia coli (bacteria), Tetrahymena pyriformis (protozoa), mice, and rats showed significant growth retardation. Muckerheide 38 reported that mice fed a diet lacking K-40 showed reduced growth, but supplying K-40 restored growth.
Three Key Topics in the Creation of LNT
It has been nearly 70 years since the National Academy of Sciences (NAS) recommended LNT in 1956. Over this time, a wealth of information has emerged regarding LNT, but here I will focus on three key points. First, HJ Muller’s connections to the Rockefeller Foundation (RF) played a significant role in the development of LNT. Second, the LNT paper published by NAS itself contains numerous issues. Third, NAS argues that radiation-induced carcinogenesis follows LNT, but this argument is based on assumptions that are increasingly challenged by empirical data.
The Muller-RF Connection
In 1859, C Darwin published The Origin of Species, and in 1900, Mendel’s Laws were rediscovered. In 1913, TH Morgan of Columbia University created a chromosome map using Drosophila melanogaster. By then, there was a consensus that the person who could elucidate the causes of evolution would surely win the Nobel Prize. In the same year, John Rockefeller established RF, one of whose missions was to use eugenics for the betterment of humanity. In the same year, John D Rockefeller established the RF, one of whose missions was to promote the betterment of humanity through scientific advancement, including the support of eugenics. The RF had a deep and well-documented historical connection to eugenic initiatives, particularly in the United States and Europe, as discussed in Stefan Kühl’s The Nazi Connection: Eugenics, American Racism, and German National Socialism (Kühl, 1994).
At the same time, Muller, a student of Morgan, was a passionate proponent of eugenics. He believed that humans should use genetics to control their evolution. Muller argued that the future of mankind should not be left to “the free love of men and women,” and he was also an advocate for sperm banks. It is likely that RF shared Muller’s eugenic ideas from the foundation’s inception and welcomed him as a key figure when Muller was at Columbia University. RF continued to support Muller throughout his life, which is why it is said that Muller was nurtured by RF.
Muller was known for attempting to win arguments through exaggeration and overstatement. His first Science paper, which was allegedly the most important one among those that contributed to his Nobel Prize, was controversial because it lacked detailed experimental methods, data, and references, and consisted largely of discussions. 39 However, in order to win the Nobel Prize, Muller needed to set a precedent by publishing a paper, even if incomplete. Morgan read the paper and remarked, “Now he’s done it. He’s hung himself.” Why was such an incomplete paper published in Science? At the time, Science was privately owned by Prof. JM Cuttell of Columbia University, 40 and Muller apparently managed to have it published without peer review. 41 Because Muller’s paper lacked references, it overlooked a previous study that reported chromosome aberrations and gene mutations in Datura. 42
The Manhattan Project during World War II had the primary objective of building atomic bombs, but it also investigated the effects of radiation on living organisms. Prof. C Stern of Stanford University led the research on the effects of radiation on Drosophila (fruit flies). Muller was also invited as an advisor. However, since Muller’s experimental system was used in the research, he was, in effect, the actual leader. The research produced data showing that radiation has a threshold. 43 Data supporting a radiation threshold was dismissed due to “(1) the low sensitivity to irradiation of aged sperm, (2) the dependence of induced mutation frequency at low dosages on a time factor, and (3) errors of sampling which might have obscured a true difference between control and experimental rate”. 44 The data indicating a threshold was obtained by Caspari, an experienced and skilled researcher. His negative control data was close to that reported by Muller, which suggests that his results were reliable. 43 In contrast, Uphoff, who reported no threshold, was a graduate student at the time and arguably less experienced. Although the paper by Uphoff and Stern stated, “A more detailed account of the work will be presented later”, 44 no such detailed report was ever published.
In 1945, atomic bombs were dropped on Hiroshima and Nagasaki. In 1946, Muller was awarded the Nobel Prize. Although Muller was aware of the data showing a threshold before his Nobel Prize speech, he stated: “…there is no escape from the conclusion that there is no threshold”. 45 This statement highlights Muller’s tendency to assert his viewpoint, even at the expense of distorting the facts. The “threshold” concept was changed to “no threshold,” and the authority of the Nobel Prize ensured that the “no threshold” idea remains dominant to this day. It is also worth noting that some of those who recommended Muller for the Nobel Prize were likely eugenics advocates as Calabrese argued. 46
Negative Contribution of NAS to the Establishment of LNT
In 1953, President Eisenhower delivered a speech titled “Atoms for Peace” at the United Nations, marking the transition of nuclear power from government and military control to the private sector. In response, in 1954, D Bronk (Chairman of the NAS, Director of RF, and President of the Rockefeller Institute) established the Committee on Biological Effects of Atomic Radiation (BEAR I) within NAS. The committee consisted of sixteen members, with Muller playing a central role. W. Weaver, a board member of RF and allocator of its research funds, was appointed as chair. RF provided significant financial support to NAS and several key members, including Muller. This financial involvement can be considered a conflict of interest.
In 1956, the committee recommended LNT without proper discussion or evidence in Science journal. 47 The significance of the LNT is as follows: (1) The tolerable radiation dose limit established in 1934 (approximately 2 mGy/d or 500 mGy/y) was drastically replaced by the concept of “no threshold. (2) LNT became the foundation for the hypothesis, proposed by NAS in 2006, that radiation induces cancer in direct proportion to dose with no safe threshold. 48 This hypothesis is scientifically flawed (see the next section). (3) The Environmental Protection Agency (EPA) adopted LNT for evaluating the carcinogenicity of various substances, which is also scientifically incorrect. (4) The ICRP develops regulations based on UNSCEAR (United Nations Scientific Committee on the Effects of Atomic Radiation) reports, which heavily rely on NAS recommendations. Despite its scientific shortcomings, LNT has been upheld for political reasons.
The dose limit recommended for radiation workers (2 mGy/d or 500 mGy/y) is worth revisiting in light of a statement by LS Taylor, one of the founders of the ICRP: “No one has been identifiably injured by radiation while working within the first numerical standards set by the NCRP and then the ICRP in 1934”. 49 This supports the assertion by Prof. G Walinder: “I do not hesitate to say that the LNT is the greatest scientific scandal of the 20th century, as cited by Muckerheide 38 .” If LNT were replaced with a threshold model, the dose limit (2 mGy/d or 500 mGy/y) could instead be used as a scientifically supported threshold.
The problems associated with the LNT paper produced by NAS 47 are as follows: (1) Authorship Issues: The paper lacks an identifiable author, and it is unclear who holds responsibility for its contents. Furthermore, the NAS decided not to entertain any questions regarding the paper. (2) Conflict of Interest: RF funded both NAS and several members of the BEAR I committee, creating a clear conflict of interest. (3) Lack of Supporting Data: Research data indicate no genetic effects on the children of Hiroshima and Nagasaki atomic bomb survivors. 50 Neel’s argument that human policy should be based on human data was overruled by Muller’s insistence. (4) Data Manipulation: Among the nine BEAR I members’ predictions of genetic effects, the three lowest estimates were arbitrarily discarded. This manipulation created an impression of uniformly high predicted effects, bordering on data fabrication. (5) Petitions for Retraction: On March 17, 2015, J Cuttler requested that M McNutt, the Editor-in-Chief of Science, retract a 1956 article published in the journal. 47 After several email exchanges between Cuttler and McNutt, McNutt rejected the request on August 11. In response, on August 19, E Calabrese sent a follow-up letter to McNutt, presenting five reasons why the paper warranted retraction and urging her once again to retract it. McNutt rejected the request again on the same day. The last three email exchanges are reproduced in full in Calabrese’s paper. 51 (6) Questionable Authorship: It was later revealed that the LNT paper was written by a magazine reporter and that the manuscript had not been circulated to the BEAR I committee members for review, as detailed by Calabrese and Giordano. 52
Notably, Muller, the committee’s leading figure, expressed shock in a letter stating that the 1956 ‘Report to the Public’ 47 was ‘a version that had in fact not been prepared by the committee nor seen by or approved by them before its publication’. 52 ”Following this discovery, Calabrese and others again appealed to McNutt, who by then had become the first female chair of the NAS. She once again refused to take action.
NAS Expands LNT to Radiation Carcinogenesis
Before beginning this section, it is useful to compare the frequentist and Bayesian approaches to risk analysis. The Radiation Effects Research Foundation (RERF) evaluates cancer risk in hibakusha using the frequentist method, which compares cancer incidence in hibakusha to that of a designated control group. In the Life Span Study (LSS), this control group consisted of individuals classified as NIC (Not-In-the-City) at the time of the bombing.
However, using NIC individuals as a control group presents two significant issues. First, both hibakusha and NIC individuals were exposed to residual radiation from the black rain, yet this exposure is excluded from dose estimates. Consequently, NIC individuals should not be considered unexposed and are inappropriate as a control group. Second, the dose received by NIC individuals likely falls within the hormetic range, which may reduce cancer risk (see Table 4). Using such individuals as the control group may therefore artificially lower the baseline incidence, leading to an inflated estimate of relative risk.
Furthermore, the exclusion of residual radiation from hibakusha dose estimates results in an underestimation of their actual exposure, further exaggerating the apparent excess risk. These two sources of bias—misclassification of the control group’s exposure and underestimation of hibakusha’s dose—can together substantially inflate cancer risk estimates. While this paper does not quantify the exact degree of overestimation, it argues that these compounded biases are likely to lead to significant distortion.
By contrast, the Bayesian approach does not rely on fixed comparisons with a control group. Instead, it incorporates all available data, including from control groups, in a cumulative manner and evaluates the overall trend. This method avoids the biases introduced by misclassified exposure levels and is therefore better suited to assessing cancer risk in hibakusha.
NAS later extended the application of LNT to cancer risk estimation based on the LSS data (Figure 2).
48
However, this report remains controversial. While the excess relative risk (ERR) of both leukemia and solid cancers fits well with a linear-quadratic curve, the BEIR VII report asserts that the ERR of solid cancers follows LNT. This assertion is based on the lack of a statistically significant difference between the linear-quadratic curve and the linear fit (Figure 2a and b). Excess Relative Risk (ERR) of Solid Cancers Among Hibakusha, Based on Data From the BEIR VII Report.
48
Curves Include Both Linear-Quadratic (a) and Linear (b) Models. Certain Methodological Limitations are Noted: (c) The Dose Range is Capped at Approximately 2 Sv; (d) Data Grouping (11 Points Into 3) May Obscure Variability; (e) the Linear Fit Starts at the Origin, although Negative Controls Were Likely Exposed to Residual Radiation; (f) x-Axis Doses Reflect Initial Radiation Only, Underestimating Actual Exposure by a Factor of 2-3; (g) as a Result, ERR May be Overestimated; and (h) Doses Below 100 mSv are Grouped Into a Single Low-Dose Category. The Lower-Left Region (Highlighted in Green) is Enlarged in the Inset (Lower Right), which Compares Two Statistical Approaches, as Reported by Furukawa et al.
53
: The Black Solid and Dotted Lines Represent a Linear Fit and its 95% Confidence Intervals (LNT), while the Red Solid and Dotted Lines Represent a Bayesian Fit With 95% Credible Intervals
Leukemia is considered a better indicator of radiation-induced tumors than solid cancers because it typically appears 2-8 years after irradiation and has a high incidence rate (2 ERR/Sv). In contrast, solid cancers generally emerge a decade or more after irradiation and have a lower incidence rate (0.5 ERR/Sv). Furthermore, not all solid cancers are induced by radiation. Therefore, the BEIR VII report should acknowledge that leukemia and solid cancers follow a linear-quadratic curve rather than LNT. 48 This curve reaches a plateau and eventually exhibits a downturn (Figure 1). However, the BEIR VII report obscures the plateau and downturn by limiting the upper dose to 2 Sv (Figure 2c).
The lower left area, shaded in pale green, is magnified in the lower right inset, which displays the results of frequentist and Bayesian analyses (Figure 2d and inset). The intersection of the red line with the x-axis indicates the threshold. While the threshold dose appears small, the actual dose would be higher when residual radiation is considered. Six out of 12 data points fall below the x-axis, suggesting hormesis. Seven out of 12 data points lie within the 95% credible interval in the Bayesian analysis, whereas only one point falls within the 95% confidence interval in the frequentist analysis. This demonstrates that Bayesian analysis is superior to frequentist analysis, supporting the occurrence of a threshold and hormesis.
The radiation dose in Figure 2 was determined based on the initial radiation, which accounts for 5% of the A-bomb’s energy. When residual radiation, comprising 10% of the bomb’s energy, is taken into consideration and the radiation dose is doubled, the lower left portion of Figure 2 is transformed into Figure 3. The original ERR is 0.55/Sv, but Figure 3 shows that the ERR is reduced by half. Effect of including Residual Radiation on ERR Estimates. When Residual Radiation–Estimated to Account for Approximately 10% of the Total A-Bomb Energy–is Considered, the Assumed Radiation Dose Effectively Doubles (eg, 0.5 Sv Becomes 1.0 Sv). This Adjustment Results in a Halving of the Calculated ERR Values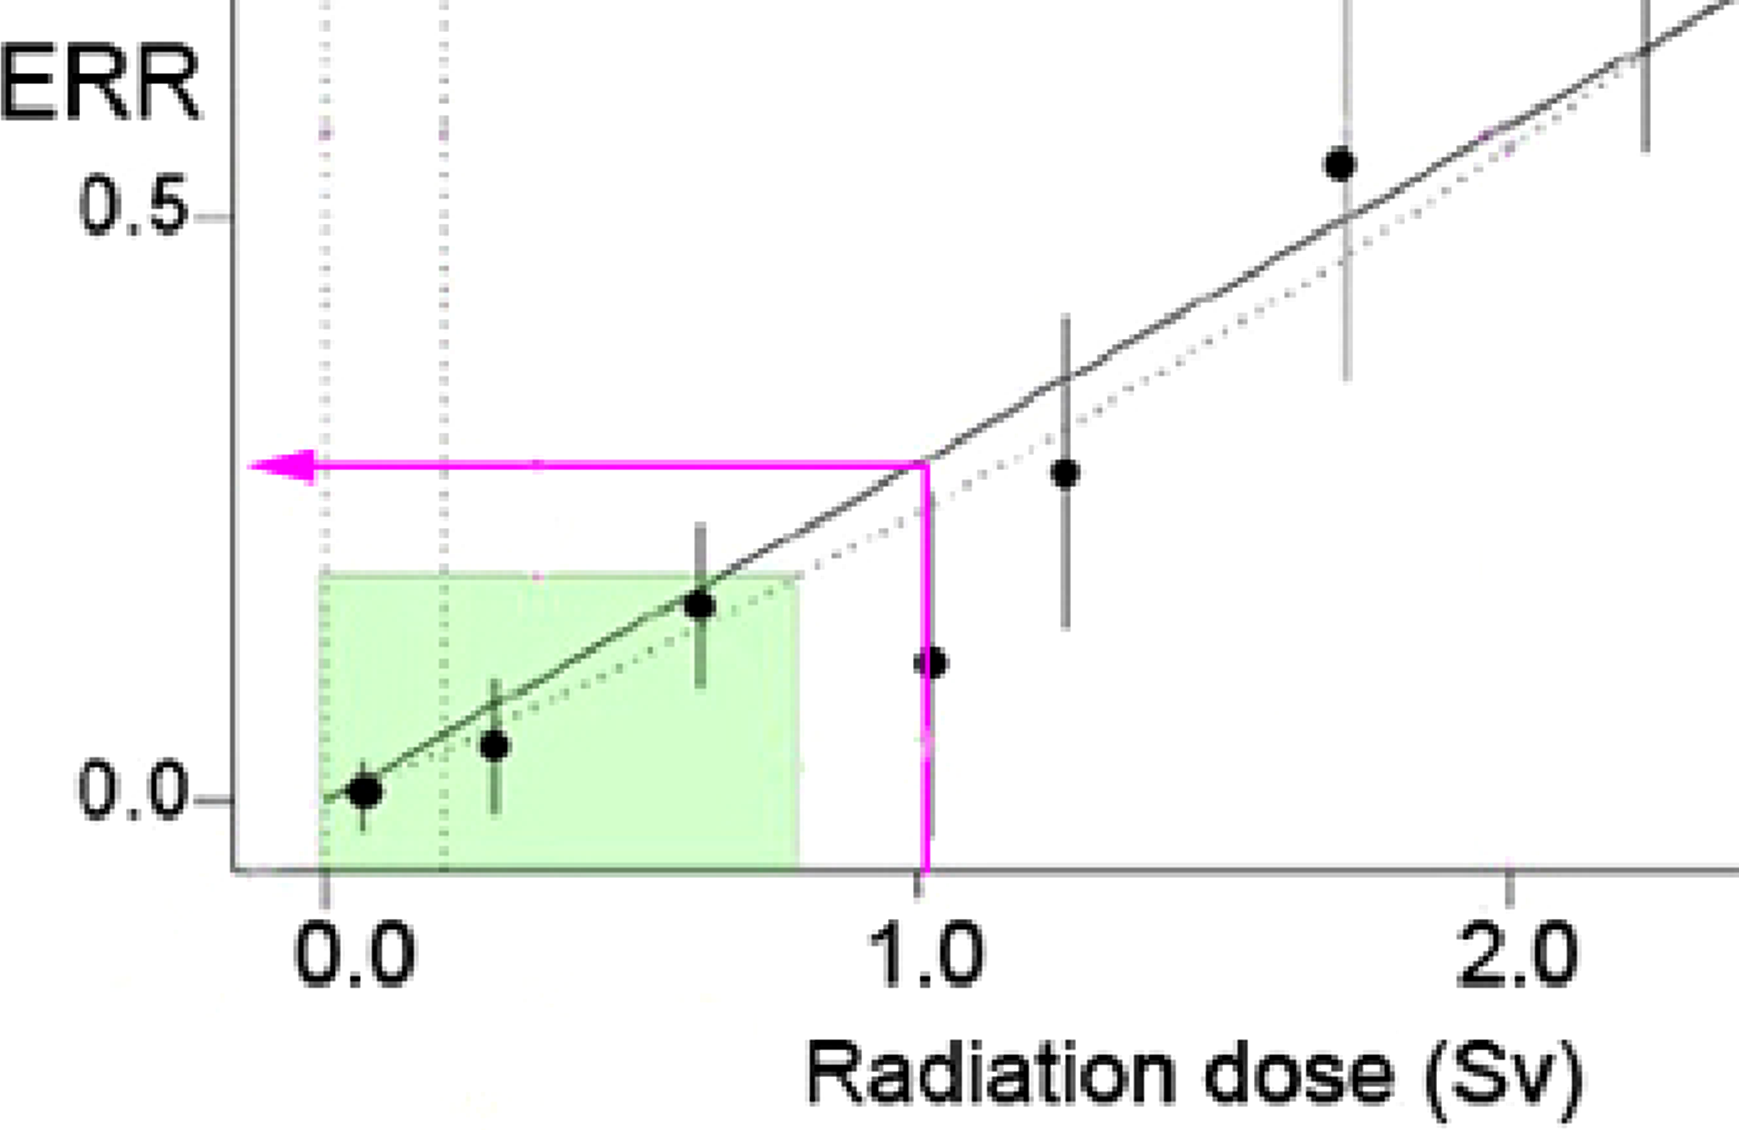
The Bayesian analysis suggests the presence of a threshold and evidence of hormesis (Figure 2, inset). While the dose-response relationship is sigmoidal, for simplicity, a straight, parallel line is drawn alongside the LNT in the low-dose range (Figure 4, blue line). Taking the intersection point of the line with the x-axis as the origin, a new ERR estimate can be determined (Figure 4, blue y-axis). The Bayesian analysis thus indicates a reduced ERR. Comparison of Bayesian and LNT Model Estimates of ERR at Low Radiation Doses. The Bayesian Estimate (Blue Line) Appears as a Straight, Parallel Line Below the LNT Model (Black Line), Indicating a Lower ERR in the Low-Dose Region. Both Lines Intersect the x-Axis at the Origin, Allowing Direct Comparison of the Two Models
Figures 3 and 4 demonstrate that cancer risk in the LSS cohort may be overestimated. Bill et al criticized this approach as “epidemiology without biology”. 13 Furthermore, Sutou argued that NAS selectively emphasized data favoring the LNT model. 54
Fundamental Information on the A-Bomb
Fundamental Information on the A-Bomb Dropped on Hiroshima
On August 6, 1945, an atomic bomb was dropped on Hiroshima. The bomb’s energy release was composed of 50% blast, 35% heat, and 15% radiation (Figure 5A).
55
Most individuals within a 1-km radius of the epicenter perished instantly due to the blast and intense heat. Overview of key aspects of the Hiroshima atomic bombing. (A) Typical Energy Distribution From an Atomic Bomb, Based on Combined Data From
55
and
56
. (B) Schematic Depiction of the Bomb Detonation and Subsequent Formation of Black Rain, Adapted From
54
. (C) Map of Areas Affected by Black Rain in Hiroshima, Also Adapted From
54
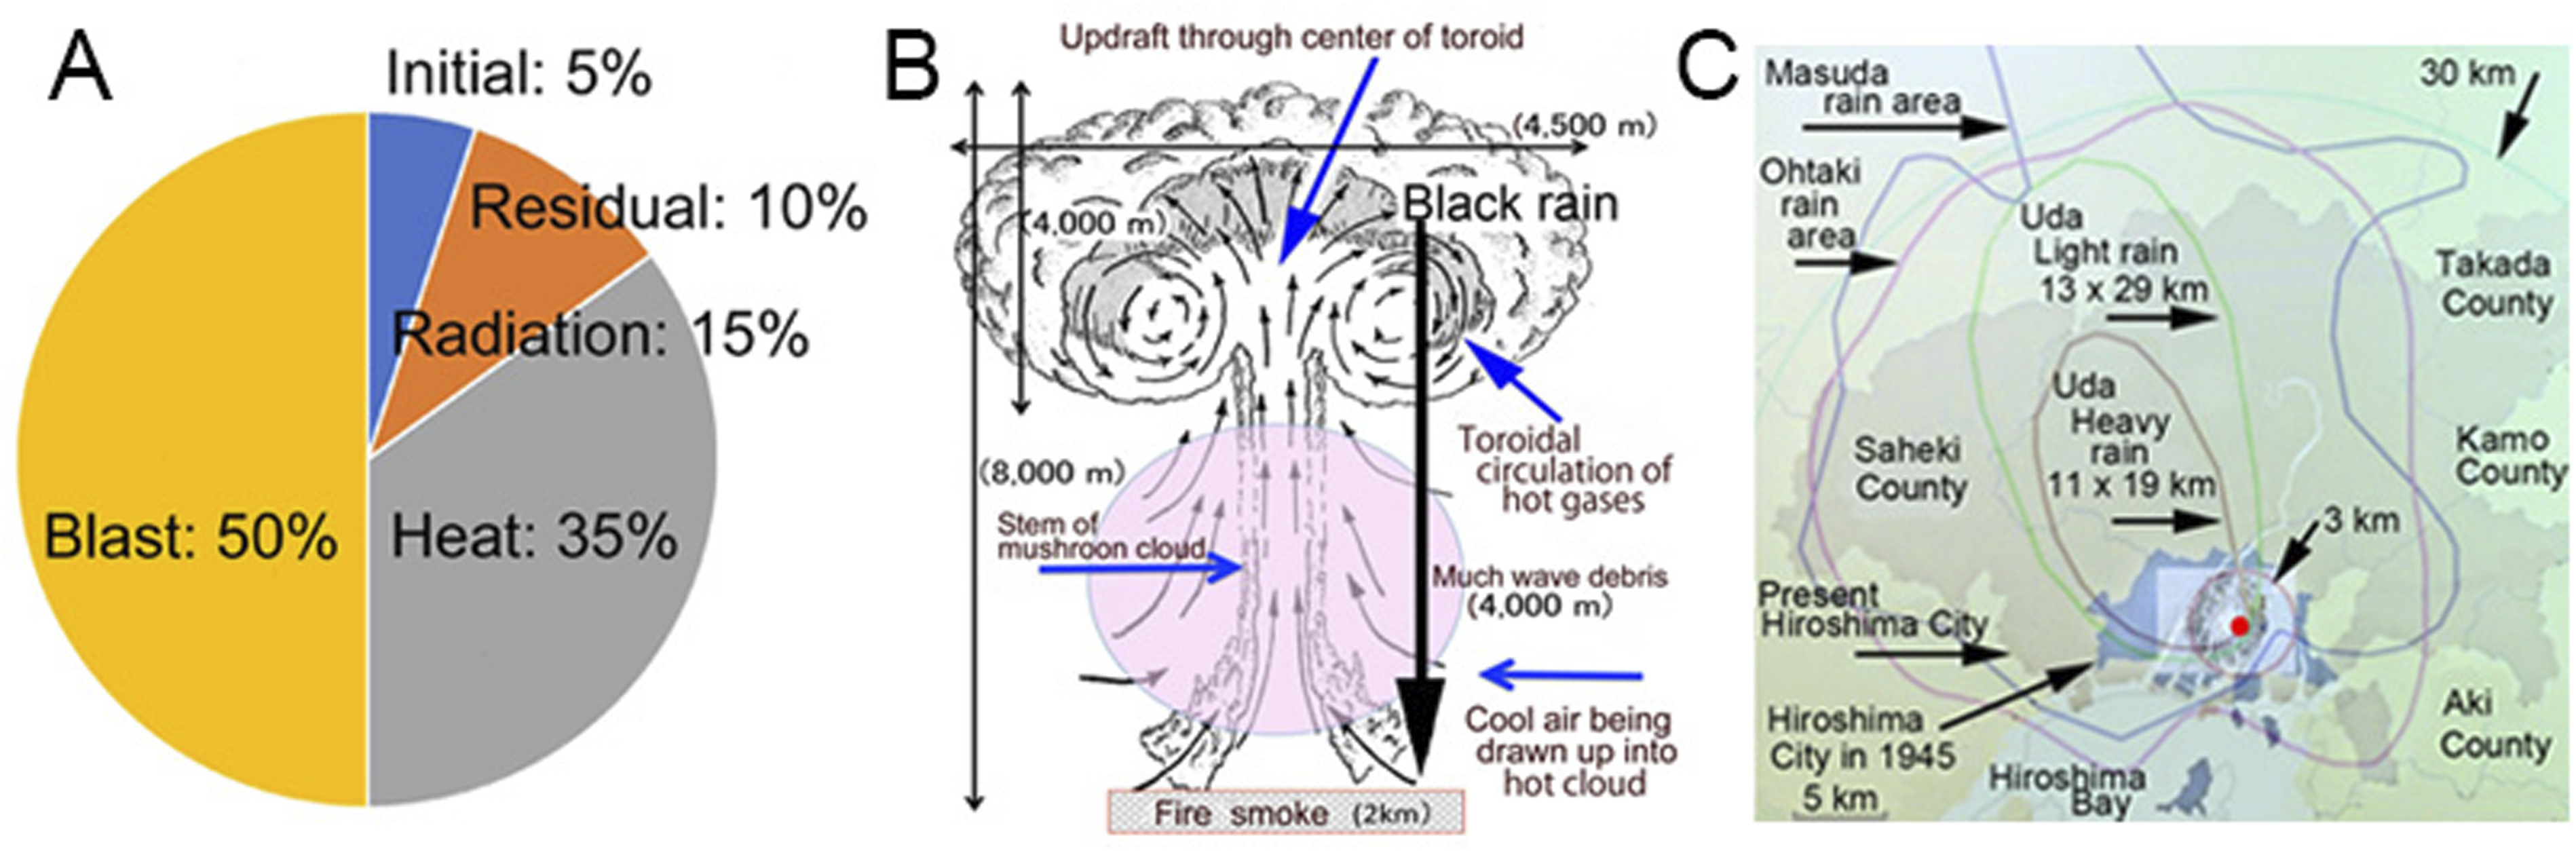
Approximately 20-30 minutes after the detonation, “black rain” began falling (Figure 5B). This rain was sticky, and some locals spread rumors that American soldiers had spilled heavy oil to burn out Hiroshima. The black rain was widely distributed (Figure 5C), highlighting a significant difference between the effects of dropping an atomic bomb on urban areas compared to the Nevada desert.
In Hiroshima, the city’s numerous waterways and water sources, including houses, animals, and plants, played a significant role in the aftermath. For example, when a human body is completely burned, approximately 50 kg of water is released, assuming the body’s water content is 70%. Most of the residual radiation originated from fallout carried to the ground by the black rain, leading to widespread contamination across Hiroshima City.
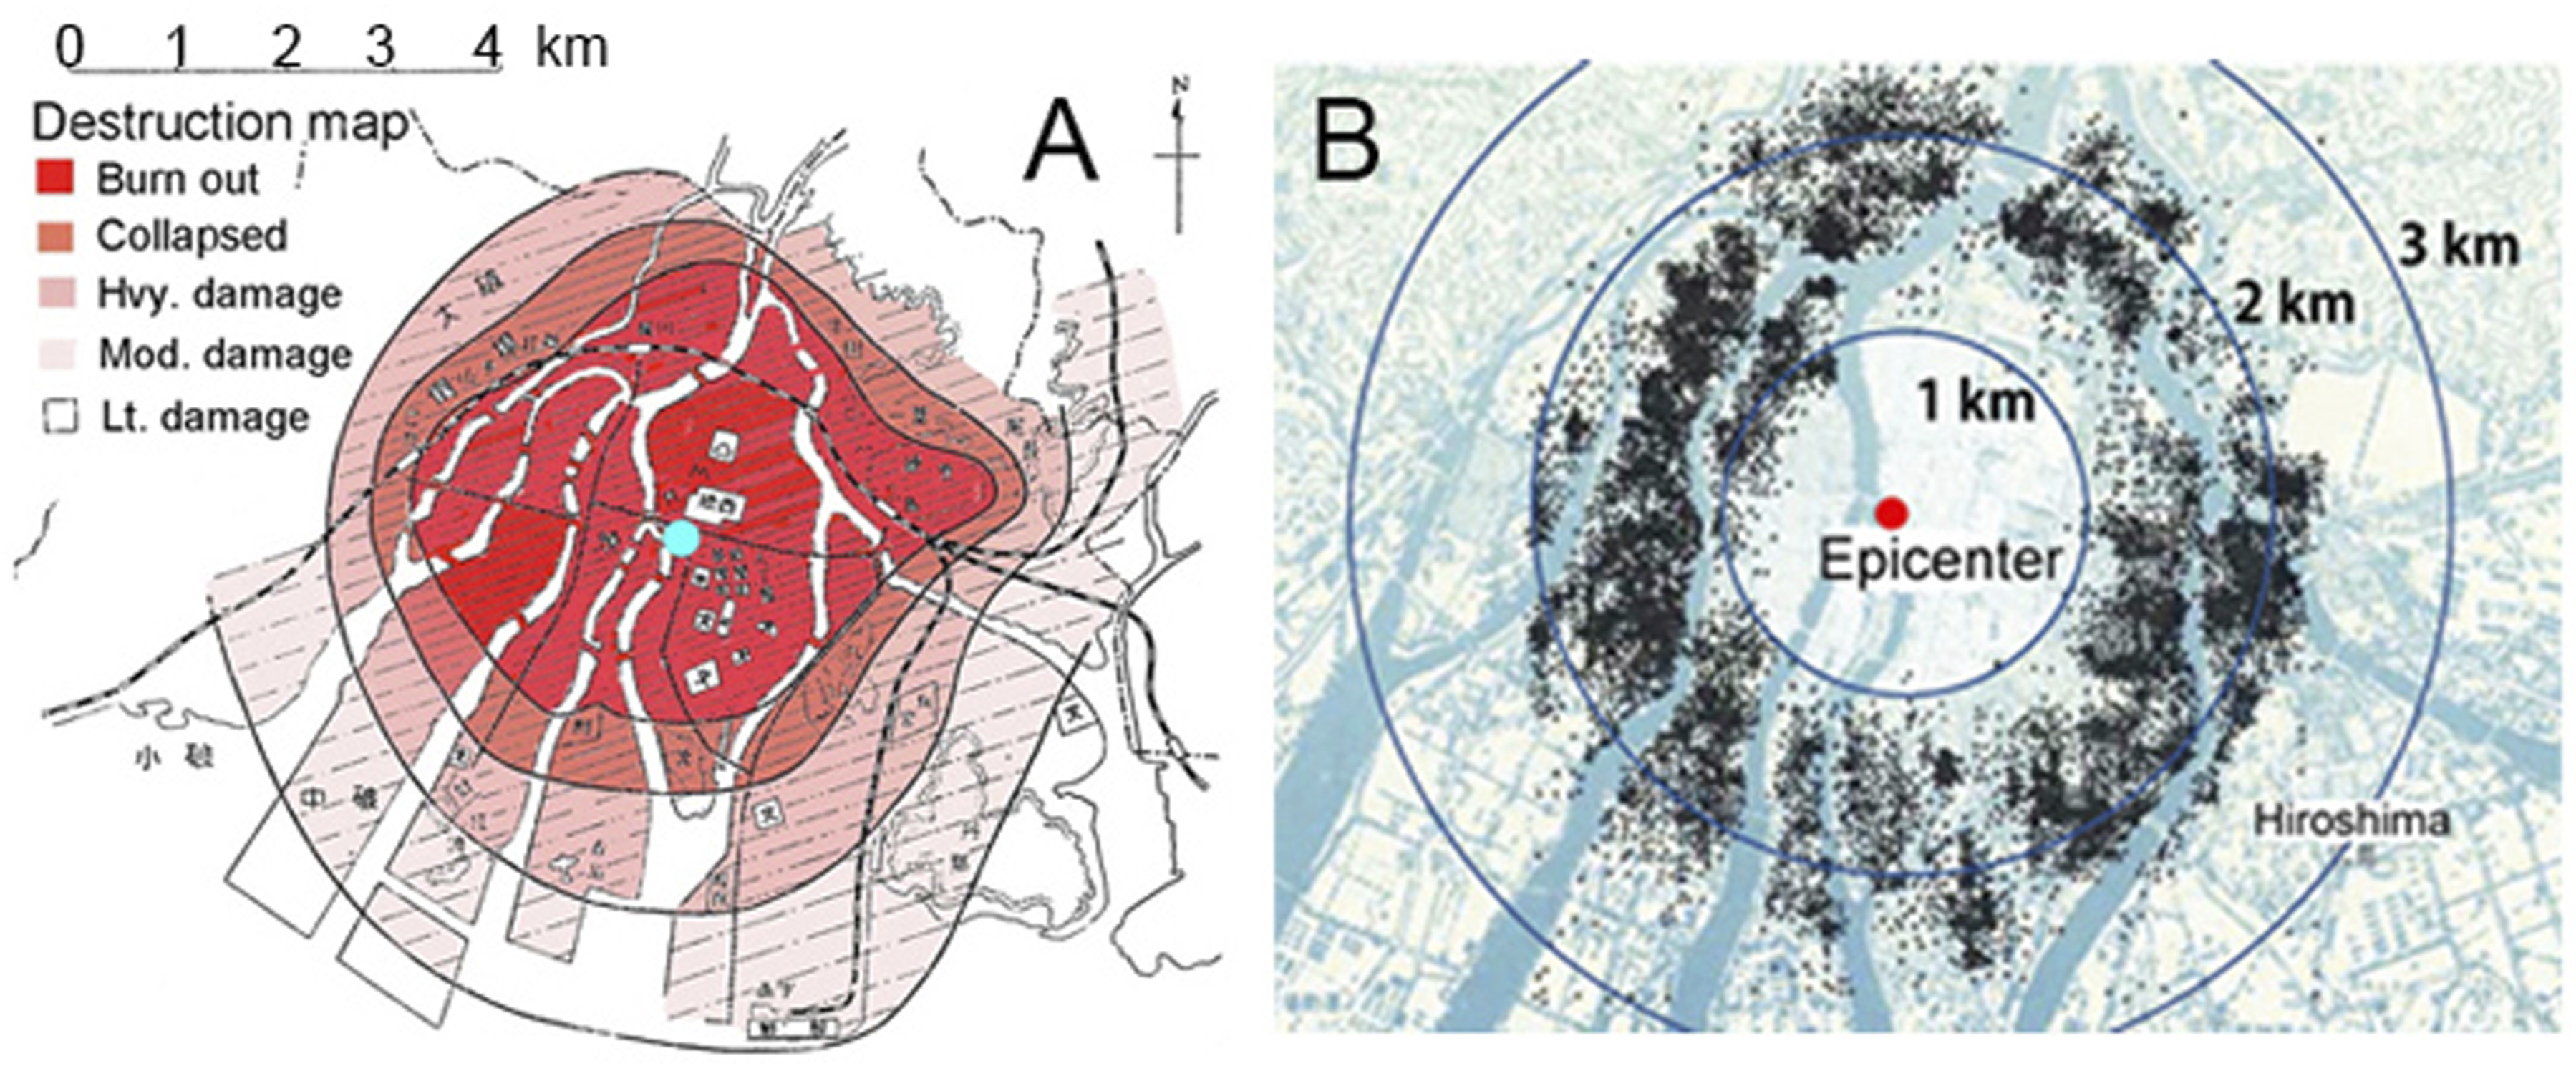
Although heat accounted for 35% of the energy from the A-bomb (Figure 5A), it triggered a massive inferno, leading to severe destruction in Hiroshima (Figure 6A). A rough estimate suggests that the energy generated by the inferno was 65 times greater than the energy released by the bomb itself. This estimate is mainly based on the following assumptions: 1 g of U-235 was converted into energy in the A-bomb. Wooden buildings, made of cellulose material, covered approximately 30% of the area within a 2 km diameter in central Hiroshima and were entirely consumed by fire. A more detailed calculation was provided in my previous report.
57
It is estimated that Hiroshima’s population on August 6, 1945, was approximately 350,000 (Figure 5C, Hiroshima City in 1945). By the end of that year, around 140,000 people are believed to have died, many of them likely perishing in the massive inferno. This again highlights a significant difference between the effects of dropping an A-bomb in an urban area vs in the Nevada desert.
Black Rain Was Highly Radioactive
Initial radiation extended up to 3 km from the epicenter (Figure 6B). However, A-bomb survivors living beyond the 3 km radius in Hiroshima also experienced severe acute radiation syndrome (Figure 7A). Additionally, individuals who entered Hiroshima after the bombing suffered from the same syndrome (Figure 7B). Evidence that Black Rain Was Highly Radioactive, Based on Health Outcomes in Hiroshima (adapted From
59
). (A) AProportion of Hibakusha Exhibiting Severe Acute Radiation Syndrome, Categorized by Exposure Conditions. Open Red Circles: Outdoor Survivors who Entered the Central Area (Within 1 km of the Epicenter; n = 398). Filled Red Circles: Outdoor Survivors who Did Not Enter the Central Area (n = 652). Open Blue Squares: Indoor Survivors who Entered the Central Area (n = 1018). Filled Blue Squares: Indoor Survivors who Did Not Enter the Central Area (n = 1878). A Vertical Line at 3 km Indicates the Estimated Boundary of Initial Radiation exposure. (B) Proportion of Non-hibakusha Exhibiting Symptoms. Open Triangles: Individuals who Entered the Central Area (n = 525). Filled Triangles: Individuals who Did Not Enter the Central Area (n = 104)
Induced radioactivity occurs when neutrons convert non-radioactive substances into radioactive ones, but its effects are short-lived and generally negligible. Therefore, it is highly likely that radiation from the black rain significantly impacted a wide area, as illustrated in (Figure 5C and 7).
Low Cancer Risk Among A-Bomb Survivor
Solid Cancer Mortality in the Life Span Study (LSS) of A-Bomb Survivors Compared With Japanese Average Cancer Mortality (adapted from 57 )

The findings suggest that the residual radiation dose experienced by the NIC group likely fell within the hormesis range. While most hibakusha were exposed to both direct and residual radiation, many received doses within the hormesis range, with only a minority exposed to harmful high doses. Overall, the average cancer mortality rate among hibakusha was lower than that of the general Japanese population, who were not exposed to the potential hormetic effects of LDR.
It is crucial to highlight the significance of the low cancer risk among NIC individuals. This is because the LSS data is fundamentally flawed: it uses the cancer risk of the NIC group as the baseline (denominator) to calculate the cancer risk of hibakusha through frequentist analysis. In other words, the LSS data itself reveals its inherent flaws.
Longer Lifespan of Hibakusha
Longer Lifespan of Hibakusha: An LSS Report
Lifespan is a more reliable indicator than cancer for assessing the effects of radiation. 62 An LSS report claimed that exposure to 1 Gy reduced an individual’s lifespan by 1.3 years. 63 However, closer examination of the same data reveals a hormetic dose-response. 57
For example, early entrants—those who entered A-bombed cities within one month of the bombing—had lower mortality rates than later entrants. This suggests that individuals who were more heavily exposed to radiation lived longer (Figure 8, P). When radiation exposure levels were too low to categorize individuals by dose, they were instead classified based on their distance from the epicenter. In this case, individuals closer to the epicenter showed lower mortality rates, again suggesting that those more heavily exposed lived longer (Figure 8, Q). Excess Relative Mortality by Time of Entrance, Distance From the Hypocenter, and Radiation Dose (adapted from
57
). Groups are Defined as Follows: (A), Late Entrants (NIC: Entered after 1 month); (B), Early Entrants (NIC: Entered Within 1 month); (C‐F), Individuals With Radiation Doses <0.005 Gy, Categorized by Distance From the Hypocenter; (G‐M), Groups With Increasing Radiation Dose Levels; and N, Individuals Located 0.11-3 km From the Hypocenter With Unknown Doses. The Number of Individuals in Each Group is Shown Above the Corresponding Bars (A‐N). The x‐Axis Represents the Average Excess Relative Mortality of Groups C‐F (n = 34,064)
Of course, individuals who were extensively exposed to radiation showed shorter lifespans, but this group represented only a small fraction (6.4%). On average, A-bomb survivors are expected to live longer. The overall dose-response relationship exhibits a J-shaped curve, a hallmark of hormesis (Figure 8, R).
The data in Figure 8, P and Q provide extremely important insights into the extended lifespan of hibakusha. 1) The longer lifespan of hibakusha is not a result of the selection of healthy individuals. This is because the individuals shown in Figure 8, P and Q were not exposed to high radiation doses that would selectively favor only stronger individuals. 2)
The longer lifespan of hibakusha cannot be attributed to free medical care. This is evident because the individuals shown in Figure 8, P and Q would have had access to the same free medical care, as all of them were holders of the A-bomb Survivor Health Handbook.
Longer Lifespan of Hiabkusha: MHLW Report
MHLW provides support to individuals affected by the A-bombs in Hiroshima and Nagasaki, categorizing survivors into four groups: Category 1 Survivors, those directly exposed to the A-bomb; Category 2 Survivors: those who entered the area within 2 km of the hypocenter for medical treatment or to search for relatives; Category 3 Survivors: those exposed to residual radioactivity; and Category 4 Survivors: those who were fetuses at the time of exposure and whose parents fall under Categories 1-3.
No. Of Hibakusha (A-Bomb Survivor Health Handbook Holders) and Average Age as of March 31, 2023 and March 31, 2024 2

Key findings from Table 5 are as follows: (1) As of the end of March 2023, the average age of hibakusha was 0.86 years higher than the national average. By the end of March 2024, this difference increased to 1.39 years, suggesting that hibakusha may continue to exhibit a longer lifespan in the coming years. (2) The average age of hibakusha increased by 0.57 years within one year, compared to a 0.04-year increase in the general Japanese population. (3) In the future, the average age of hibakusha may surpass the national average by an even greater margin. If this occurs, it could be interpreted as a sign of radiation hormesis.
As illustrated in Figure 8, the longer lifespan of hibakusha cannot be solely attributed to the selection of inherently healthy individuals or the provision of free medical care. Instead, it appears that LDR may contribute to increased longevity through hormetic effects. Calabrese et al have argued that hormesis induced by LDR can influence the upper limits of lifespan. 64 Vaiserman et al reviewed evidence showing that LDR can extend the lifespan of various organisms, including Caenorhabditis elegans, Drosophila melanogaster, flour beetles, and several vertebrate models such as guinea pigs, mice, and rabbits. They further suggested that LDR may have potential applications in treating age-related diseases, including Alzheimer’s disease, for which effective therapies remain limited. 65 Several high background radiation areas—such as Ramsar in Iran, Kerala in India, and Yangjiang in China—offer further insight. Studies in these regions have reported reductions in chromosomal aberrations (∼10%), cancer incidence (∼15%), and cancer mortality (∼17%), which contradict predictions based on the LNT model. 66 Additionally, an analysis of background radiation levels and life expectancy among 320 million Americans found that individuals living in areas with relatively high background radiation had life expectancies approximately 2.5 years longer than those in low-radiation regions. 67 Sanders hinted at a close relationship between radiation and supercentenarians. 68
The Nobel Prize for the Japan Confederation of A- and H-Bomb Victims Organizations (Nihon Hidankyo) and Longevity
Nihon Hidankyo was established in 1956 to advocate for the abolition of nuclear weapons and seek national compensation for the damage caused by the atomic bombings. The organization played a pivotal role in promoting the “nuclear taboo”—the principle that nuclear weapons are inhumane and incompatible with humanity’s existence, and therefore must be abolished as quickly as possible. For this effort, Nihon Hidankyo was awarded the Nobel Peace Prize in 2024. As shown in the above section, hibakusha tend to live longer. They are often mentioned in relation to the idea that “hibakusha tend to live long lives,” and are therefore worth presenting.
Hiromi Tanaka, the representative committee member of Hidankyo, was 13 years old when he experienced the atomic bombing at his home in Nagasaki, located 3 km from the hypocenter. Now 92 years old, he attended the award ceremony and delivered an acceptance speech.
Tanaka’s predecessor, Sunao Tsuboi, was directly exposed to the bombing just 1.5 km from the hypocenter and suffered severe burns to his face and arms in Hiroshima. He later welcomed U.S. President Barack Obama to Hiroshima at the Peace Memorial Park on May 27, 2016. Tsuboi passed away at the age of 96 due to arrhythmia caused by anemia.
Yamaguchi Tsutomu, known as a “double bomb survivor,” endured both the Hiroshima and Nagasaki atomic bombings. At 90 years old, he gave a speech at the United Nations in New York, declaring, “I experienced the bomb twice. I sincerely hope there will never be a third.” Yamaguchi died of stomach cancer at the age of 93.
On December 12, 1952, Jimmy Carter, who would later become the 39th President of the United States, was a 28-year-old Navy lieutenant involved in addressing the nuclear accident at the Chalk River Nuclear Reactor (NRX) in Canada. During the incident, the reactor went out of control, fuel rods melted, and Carter was exposed to radiation while assisting in the emergency response. After serving as president from 1977 to 1981, Carter visited the Hiroshima Peace Memorial Museum in May 1984, becoming the first former U.S. president to do so. In the museum’s guestbook, he wrote, “This memorial must be a constant and permanent reminder for all people to work for peace and better understanding.” Carter’s family seems to have predisposition for pancreatic cancer―his father, brother, and sister died of pancreatic cancer in their fifties. Carter passed away on December 29, 2024, at the age of 100. Carter was awarded the Nobel Peace Prize in 2002.
Several examples of individuals exposed to ionizing radiation who later lived long lives are presented above. Did they possess innate extraordinary resilience, or did radiation itself contribute to longevity? It appears that surviving severe challenges, such as exposure to IR, can activate mechanisms that promote extended lifespan. This may be associated with epigenetic modifications. The idea recalls Friedrich Nietzsche’s 1888 maxim: “What does not destroy me makes me stronger.”
For instance, mitochondrial dysfunction induced by stress can activate histone demethylases such as jmjd-1.2/PHF8 and jmjd-3.1/JMJD3, which act as positive regulators of lifespan in both Caenorhabditis elegans and Mus musculus. 69 Moreover, humanin, a mitochondrial-derived peptide, has been shown to improve healthspan and lifespan in multiple species when overexpressed. 70 While only two studies are cited here, numerous others support similar conclusions. Mitochondria, being the primary source of ROS, appear to have evolved mechanisms of hormetic or adaptive response, converting distress into beneficial eustress. Thus, the long-lived outcomes observed in radiation-exposed individuals may reflect epigenetic and mitochondrial adaptations triggered by IR.
Estimation of Nuclear Accident-Associated Deaths
Position of Fukushima, FDNPP, and Epicenters of the Great East Japan Earthquake (GEJP)
Many Earthquakes occurred around March 11, 2011 with the biggest one of magnitude 9 (Figure 9). Miyagi is the closest prefecture to the magnitude 9 tremor followed by Iwate and then Fukushima. Death tolls are arranged in this order. Geographic Location of Fukushima Prefecture, FDNPP, and Earthquake Epicenters (adapted from
3
). The figure illustrates the Relative Positions of the Plant and Affected Areas in Relation to the Seismic Events
Radio-Contamination Map of Fukushima Prefecture
Fukushima Prefecture provides us with radioactivity measurement maps (Figure 10). The highest level of radio-contamination appears to be 5 µSv/h in April 2011 (Figure 10A). Data from the LSS on mortality or the incidence of solid tumors show that there is no significant increase below approximately 200 mSv.
69
This 200 mSv corresponds to the initial radiation dose in Hiroshima and Nagasaki, delivered in 30 seconds.
56
Therefore, 200 mSv/30 sec = 400 mSv/min = 24,000 mSv/h = 24,000,000 µSv/h. The highest contamination in Fukushima (5 µSv/h) is 1/4,800,000th of the no-effect level in Hiroshima and Nagasaki. Even if the contamination was 10 times higher in March 2011, the level would be 1/480,000th, meaning that the contamination in Fukushima was negligibly small (Figure 10A). It could be said that there was almost no contamination in Fukushima in April 2023 (Figure 10B). Maps Showing Radioactivity Measurements Following the Fukushima Accident (Adapted From
4
). Color Gradients Represent Measured Radiation Levels Across the Affected Region. The Black Star Indicates the Location of FDNPP
Comparison of Radiation Doses or Dose Rates

More than 2000 People Likely Killed by Enforced Evacuation
Estimation of the Number of Nuclear Accident-Associated Deaths From Disaster-Associated Deaths in the Great East Japan Earthquake as of December 31, 2023
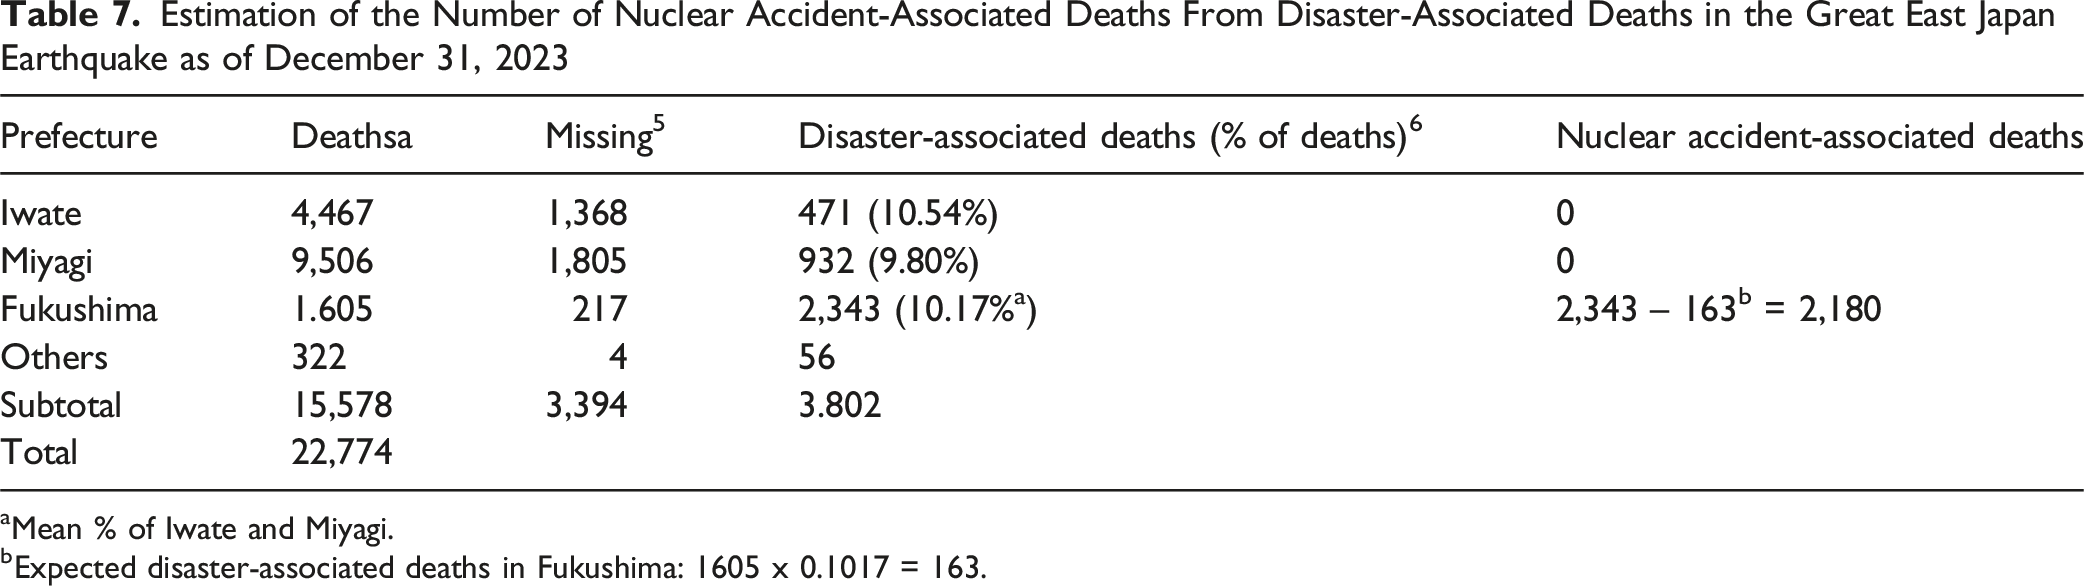
aMean % of Iwate and Miyagi.
bExpected disaster-associated deaths in Fukushima: 1605 x 0.1017 = 163.
Discussion
The lower cancer incidence observed among NIC subjects compared to both hibakusha and the general Japanese population (Table 4) raises concerns about the appropriateness of using NIC as a baseline in the LSS. If the NIC group is not representative of the broader population, this could lead to an overestimation of radiation-related cancer risk among hibakusha. To address this potential bias, Bayesian statistical methods may offer a more suitable alternative to conventional frequentist approaches. Bayesian analysis suggests the presence of a dose threshold and potential hormetic effects (Figure 2 inset; Figure 4), which are not captured under the LNT model.
Despite these methodological limitations, NAS adopted the LNT model in the BEIR VII report, 48 which continues to influence international radiation protection standards, including those of the ICRP. 8 One reason LNT remains in use is its alignment with the precautionary principle, which assumes no safe dose in the absence of conclusive threshold evidence. The model is also valued for its simplicity and conservative nature in public health policy. 9
Nevertheless, re-evaluating the scientific basis of LNT is warranted. When foundational LSS data are reanalyzed with Bayesian approaches—or adjusted for potential underestimation of radiation exposure, such as from residual radiation—support for LNT may weaken. Residual radiation, while difficult to quantify precisely, may significantly contribute to total exposure. A provisional approach, such as assuming residual doses are twice the initial estimates, may be useful for sensitivity analysis (Figure 3).
Additional evidence from populations in high natural background radiation areas (eg, India, China, Brazil, and Iran) shows no consistent increase in cancer risk and, in some cases, suggests possible protective effects. These findings (Table 6) challenge the universality of LNT and underscore the need for a more nuanced scientific rationale behind radiation protection policies.
The practical application of LNT, particularly following nuclear accidents such as the FDNPP disaster, also warrants review. Although radiation doses were generally low, mass evacuations were enforced under LNT-based guidelines. While no deaths were directly attributed to radiation exposure, the evacuations themselves led to over 2000 fatalities. This unintended consequence highlights the need for policy frameworks that are both scientifically robust and risk-proportionate.
In addition, greater public communication is needed. The media should aim not only to address radiophobia but also to report objectively on the scientific debates surrounding LNT and its real-world implications.
Conclusion
The continued reliance on the LNT model, as recommended by the NAS and adopted by the ICRP, merits critical reassessment. Data from the LSS, when viewed through a Bayesian lens or corrected for methodological limitations, may not support the assumption that all radiation exposure increases cancer risk linearly and without threshold. Moreover, the lower cancer incidence observed among NIC subjects—used as a control group—suggests that their baseline health status may confound risk estimates for hibakusha, particularly when analyzed using frequentist models. In contrast, Bayesian approaches allow for the possibility of dose thresholds and even beneficial effects at low doses (hormesis), presenting a challenge to the foundational assumptions of LNT. The precautionary measures implemented following the Fukushima accident, grounded in LNT-based policy, led to considerable harm through displacement and indirect mortality. This underscores the importance of evidence-based regulation that balances protection with proportionality. Given growing evidence from epidemiological data, alternative statistical methodologies, and real-world outcomes, it may be time for regulatory bodies such as NAS and ICRP to reconsider their continued endorsement of the LNT model. Threshold-based or hormetic dose limits—such as those proposed by Taylor (2 mGy/day or 500 mGy/year)—may offer a more scientifically grounded and socially responsible basis for radiation protection moving forward.
Footnotes
Acknowledgements
I contributed this paper in my role as one of the co-editors of this Special Issue to provide an overview of the topic. On July 1, 2023, the Asia Research Awards, an organization headquartered in India, awarded me the “International Distinguished Scientist Award” among scientists for my research on “biological effects of low-dose radiation”. On October 1, 2023, the organization awarded the “Asia’s Outstanding Researcher Award” to me among scientists, researchers, doctors, and professors for my work on “research on radiation hormesis.” As a year-round recipient, the organization awarded me “the International Innovative Scientist of the Year Award” on March 16, 2024 for my research on “radiation and chemical hormesis.” The organization awarded me “Excellent Lifetime Achievement of the Year Award” on October 20, 2024 for my research field in “genes and Environment.”
Funding
The author received no financial support for the research, authorship, and/or publication of this article.
Declaration of Conflicting Interests
The author declared no potential conflicts of interest with respect to the research, authorship, and/or publication of this article.
Data Availability Statement
The datasets used and/or analyzed during the current study are available from the author upon reasonable request.