
Abstract
Background
Previously the author was unable to develop a formal mathematical characterization of his probability-based hormetic relative risk (HRR) model for cancer prevention/elimination by absorbed doses (D) of ionizing radiation in the hormetic zone where D < Dt (population absorbed dose threshold for cancer induction).
Objective
To develop a formal mathematical characterization of the HRR model’s disease prevention function DPF(D), which is the cancer prevention/elimination probability.
Approach
Use distributed (over a population) individual-specific, natural-defenses-enhancing (E) and suppressing (S) dose thresholds.
Results
DPF(D) is now mathematically characterized based on Weibull-type E and S thresholds distributions. The E thresholds predominate at very low radiation doses and the S thresholds predominate at higher doses just below Dt. This leads to a hormetic dose-response relationship for cancer relative risk RR(D) (= 1 − DPF(D)) for doses from zero (representing natural background radiation exposure) to dose Dt. The greatly improved HRR model is quite flexible and was applied to lung cancer and reticulum cell sarcoma prevention/elimination data from a study involving more than 15 000 gamma-ray exposed mice.
Conclusion
The System of Radiological Protection needs to be updated to account for health benefits rather than invalid LNT-hypothesis-based phantom radiation-caused cancers from radiation doses < Dt.

Keywords
Introduction
The System of Radiological Protection (SRP) developed by the International Commission on Radiological Protection (ICRP) is based on the linear-no-threshold (LNT) hypothesis for radiation-exposure-related health detriment risk, which includes detriment associated with radiation-induced cancer. Based on the LNT hypothesis, many different LNT models have been developed for cancer risk assessment including weighted and unweighted combinations of LNT models. 1
The link of the SRP to the LNT hypothesis promotes radiophobia which has caused much harm including the loss of lives. 1 Largely unrecognized by the public is that humans and all other mammals have forever been exposed to ionizing radiation throughout life, yet have not perished, thankfully due to adapting to prolonged genomic stresses (gensadaptation) 1 over many previous generations. Everyone is radioactive throughout their life from natural radionuclides and this radioactivity is unlikely to harm oneself or others. 1
Low radiation doses associated with natural background radiation exposure help to maintain life via enhancing the body’s natural protection mechanisms against cancer. 1 The level of protection related to natural background radiation exposure is here referred to as the baseline protection. Radiation doses a little higher than from natural background radiation can further enhance the protective processes1-11 helping to prevent and eliminate cancer, while high doses greatly suppress natural protection mechanisms thereby increasing cancer risk. The low-dose enhancement is a consequence of gensadaptation and without this adaptation it is highly unlikely that humans and other mammals would exist today given all the genomic stresses encountered throughout life. 1
For the absorbed dose range from that from natural background radiation exposure to just below the higher population threshold dose Dt for radiation-caused cancer, radiation exposure can efficiently enhance natural protection against cancer above the already operative baseline protection level. This natural protection enhancing range of doses is called the hormetic zone. 1
The dose Dt is the smallest organ/tissue-specific absorbed dose that would cause cancer of the type of interest in a given population and it depends on the population characteristics (e.g., age and gender makeup). Dt also depends on the type or types of radiation exposed to. Note that everyone in the usually assigned zero dose (e.g., 0 mGy) group has already been exposed to an absorbed dose > 0 mGy from natural background radiation. Thus, the radiation dose from natural background radiation, which increases throughout life, is usually ignored in dose-response modeling. Throughout this paper the absorbed dose D is in excess of the natural background radiation dose.
The author12,13 previously proposed that, for the hormetic zone, the radiation-dose-dependent relative risk, RR(D), for cancer, as a function of the organ- or tissue-specific dose D, be evaluated as follows:

Equation (1) is referred to as the hormetic relative risk (HRR) model. The disease prevention function (DPF(D)), which is a joint probability, relates to the benefit function B(D), a probability, and protection factor Λ (represented elsewhere by PROFAC),
1
also a probability, as indicated by the following equation:

B(D) is the dose-dependent probability for enhanced (above baseline) natural protection against cancer. The protection factor Λ is the probability that enhanced natural protection will successfully prevent or eliminate cancer.
Both B(D) and Λ relate indirectly to evolution-associated gensadaptation to multiple genomic stresses over many previous generations. 1 Thus, B(D) and Λ likely depend on the genomic-stress history of a given population. This includes all forms of genomic stress. Indeed, all lifeforms on our planet today have benefited from gensadaptation, as it favors the preservation of life. For specific examples of gensadaptation outcomes see a complementary paper. 1
For a given population of size S with each person exposed to a dose D (in excess of the natural background radiation dose and < Dt) to a given organ/tissue, the product S × AR0 × DPF(D) is the expected number of cancer cases prevented or eliminated as a result of the body’s natural defenses being elevated by the dose. AR0 is the absolute risk of cancer of the type of interest, for the population of interest, in the absence of above background radiation exposure. Note that the product S × AR0 is the expected cancer cases for the type of interest, when not exposed to the dose D.
For estimates of Λ for different irradiated populations for which exposure to low radiation doses (above natural background) led to a reduction in the cancer incidence or in cancer mortality, see Sanders 14 and Sanders and Scott 8 ; however, the indicated estimates were with B(D) = 1 implied, as RR(D) was evaluated as the difference “1 – Λ” (represented as “1– PROFAC ” in the cited references).
Methods
Mathematical Characterization of B(D)
The new mathematical characterization of B(D) presented here relates to two types of individual-specific, distributed dose thresholds. The first type is distributed low-dose E thresholds (above natural background radiation exposure) that enhance the body’s natural defenses (DNA repair, aberrant cell removal via apoptosis, anticancer immunity, etc.)1,15-19 to above the already-protective baseline level, so long as the absorbed dose does not exceed the population threshold dose Dt for radiation-caused cancer. Dt is the dose needed to cause cancer in the most radiosensitive member of the population. Thus, Dt depends on the population considered and radiation exposure scenario. 1
The second threshold type is distributed low- and moderate-dose S thresholds that also apply to the dose zone 0 to Dt. For an individual, their S threshold exceeds their E threshold and if surpassed somewhat, the dose suppresses their natural defenses against cancer, but not to the extent that cancer risk is increased. This is because in this case D < Dt and with the HRR model cancer risk for a given individual or population only increases when D > Dt > 0 (e.g., Gy or mGy). For a given individual, their E and S thresholds depend on their life history as it relates to encountering genomic stresses, as well as the radiation exposure scenario. Thus, these thresholds are likely to change as the person ages.
For those exposed to radiation doses < Dt, no observed cancer is attributed to the radiation exposure scenario of interest. For a radiosensitive population, Dt is likely less than for a radioresistant population, but for both populations Dt > 0 (e.g., mGy).
The E distribution is represented by fe(D) and the S distribution is represented by fs(D). The distributions are assumed to be Weibull type and are expressed as follows:

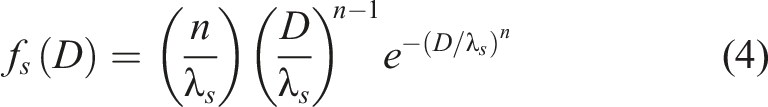
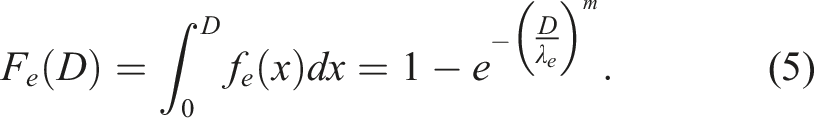
Parameters m and n are called shape parameters. Parameters λe and λs are called scale parameters. The respective cumulative distributions Fe(D) and Fs(D) are as follows:

The benefit function B(D) is now evaluated as follows:

Note that equation (7) represents the probability that only the E threshold is exceeded. Thus, equation (7) represents the probability that natural defenses against cancer are enhanced as a result of being exposed to dose D.
Many different dose-responses for B(D) and RR(D) can be generated using Weibull functions for Fe(D) and Fs(D). Doses above the hormetic zone, where both B(D) and DPF(D) are zero, suppress natural defenses to far below the protective baseline, and this is the basis for cancer absolute risk AR(D) increasing to above the baseline absolute risk AR0 and is the basis for RR(D) > 1.
For the present version of the HRR model, shape parameters m and n are linked via the constraint n{m} = m-1, where {} specifies a constraint on the value assigned to n. Stated differently, n is presently evaluated as m-1. Scale parameters λe and λs are linked via the constraint λs{λe} = λe. Thus, λs is constrained to take on the same value as is assigned to λe. This constraint guarantees that E and S thresholds both only apply for doses between 0 and Dt. Thus, both fe(D) and fs(D) decrease to zero as D increases towards Dt. The E and S thresholds are likely to change with age and depend on genetic background.
For very low radiation doses, natural protection enhancement above baseline predominates due to fe(D) > fs(D). For doses just below Dt, natural protection suppression predominates due to fs(D) > fe(D). This leads to a hormetic dose-response relationship for RR(D) for cancer occurrence evaluated over the presumed long follow-up period of interest.
Again, with the HRR model only radiation doses in the dose range for which RR(D) > 1 are attributed to causing cancer. Radiation-caused cancer is not the focus of the HRR model, as the model only applies to the hormetic zone, where RR(D) ≤ 1 and DPF(D) ≥ 0.
Radiation-prevented and radiation-eliminated cancers are the focus of the HRR model. The number of such events increases as DPF(D) increases. When DPF(D) = 0.5, then half of the expected cancer cases in the absence of radiation exposure (i.e., baseline cancer cases) would be predicted to not occur.
Different links between m and n, i.e., n{m}, may apply to some datasets. Where parameter linking fails, n can be treated as independent of m.
Both λe and the linked parameter λs{λe} have the same units as the absorbed dose D. For some HRR model applications a different link may be required for λs{λe}. Possibly, parameter linking may not be suitable for some datasets. For such datasets, λs can be treated as independent of λe.
Generating Dose-Response Data for RR(D) and DPF(D)
Cancer incidence data (based on cancer cases) for the animal model considered (female RFM mice) was used as estimates of AR(D) for the above natural background radiation dose D and the AR(D) estimates were used to estimate RR(D). Again, D = 0 (e.g., Gy or mGy) corresponds to the natural background radiation dose.
Lung Cancer RR(D) Estimate r, loge(r), and Standard Error for loge(r), for a Given Dose Group.

r = (Iw × (Ino + Iw)-1) × (Cw × (Cno + Cw)-1)-1.
loge(r) = loge(Iw × (Ino + Iw)-1) – loge(Cw × (Cno + Cw)-1).
Standard error, SE(), for loge(r):
SE(loge(r)) = sqrt(((Ino × Iw-1) × (Ino + Iw)-1) + ((Cno × Cw-1) × (Cno + Cw)-1))
The 95% CI associated with the estimate r, based on a lognormal distribution, was evaluated using the following relationship involving the Z1-α/2 score:
Note that because SE(loge(r)) > 0 for all values of D ≥ 0 Gy, equation (8) assigns the usually missing 10 relative risk uncertainty for the assigned zero dose group (exposed only to natural background radiation) for which r = 1 is the central estimate. The indicated uncertainty for the assigned zero dose group was evaluated and is included in graphs presented. Where an adjustment for this uncertainty was made, it is indicated. The 95% CIs for relative risk, based on a lognormal distribution, were very close to published results 1 based on a binomial distribution of cancer cases.
Obtaining Model Parameters Estimates
For fitting the HRR model to dose-response data to obtain curves for RR(D) and DPF(D), model parameters m, λe, and Λ were systematically changed until adequate representation of the dose-response data was achieved. Linked parameters n{m} and λs{λe} were automatically changed as m and λe were changed. Evaluations were carried out using Microsoft Excel. All model parameter estimates should be considered as the current best central estimates, and parameter uncertainty has not been characterized.
Results
The HRR Model Is now Quite Flexible
The assigned value for m strongly impacts the shape of the RR(D) vs D relationship (see Figure 1). The figure was generated with fixed parameters λe = 1.0 Gy and Λ = 1.0. Note that the shapes of the three curves plotted are quite different. Shape parameter (m) impact on the RR(D) vs dose D relationship. The shape parameter linkage was n{m} = m-1. Fixed parameter assignments were λs{λe} = λe = 1.0 Gy and Λ = 1.0.
Figure 2 shows the strong impact of the scale parameter λe on the dose range over which RR(D) < 1 (i.e., the hormetic zone). The figure was generated using fixed parameters m = 0.25 and Λ = 1.0. Scale parameter (λe in grays) impact on RR(D) vs dose D relationship. The scale parameter linkage was λs{λe} = λe. Fixed parameter assignments were m = 0.25, n{m} = m-1 = 4, and Λ = 1.0.
The gensadaptation-related parameter Λ also strongly impacts the RR(D) vs D relationship. Increasing the value for this parameter towards the maximum value of 1 increases the simulated efficiency of the enhanced (above baseline) natural protection in preventing (or eliminating) cancer, as shown in Figure 3. Fixed parameter assignments were m = 0.25 and λe = 1.5 Gy. Protection factor Λ impact on the RR(D) vs dose D relationship. Fixed parameter assignments were m = 0.25, n{m} = m-1 = 4, and λs{λe} = λe = 1.5 Gy.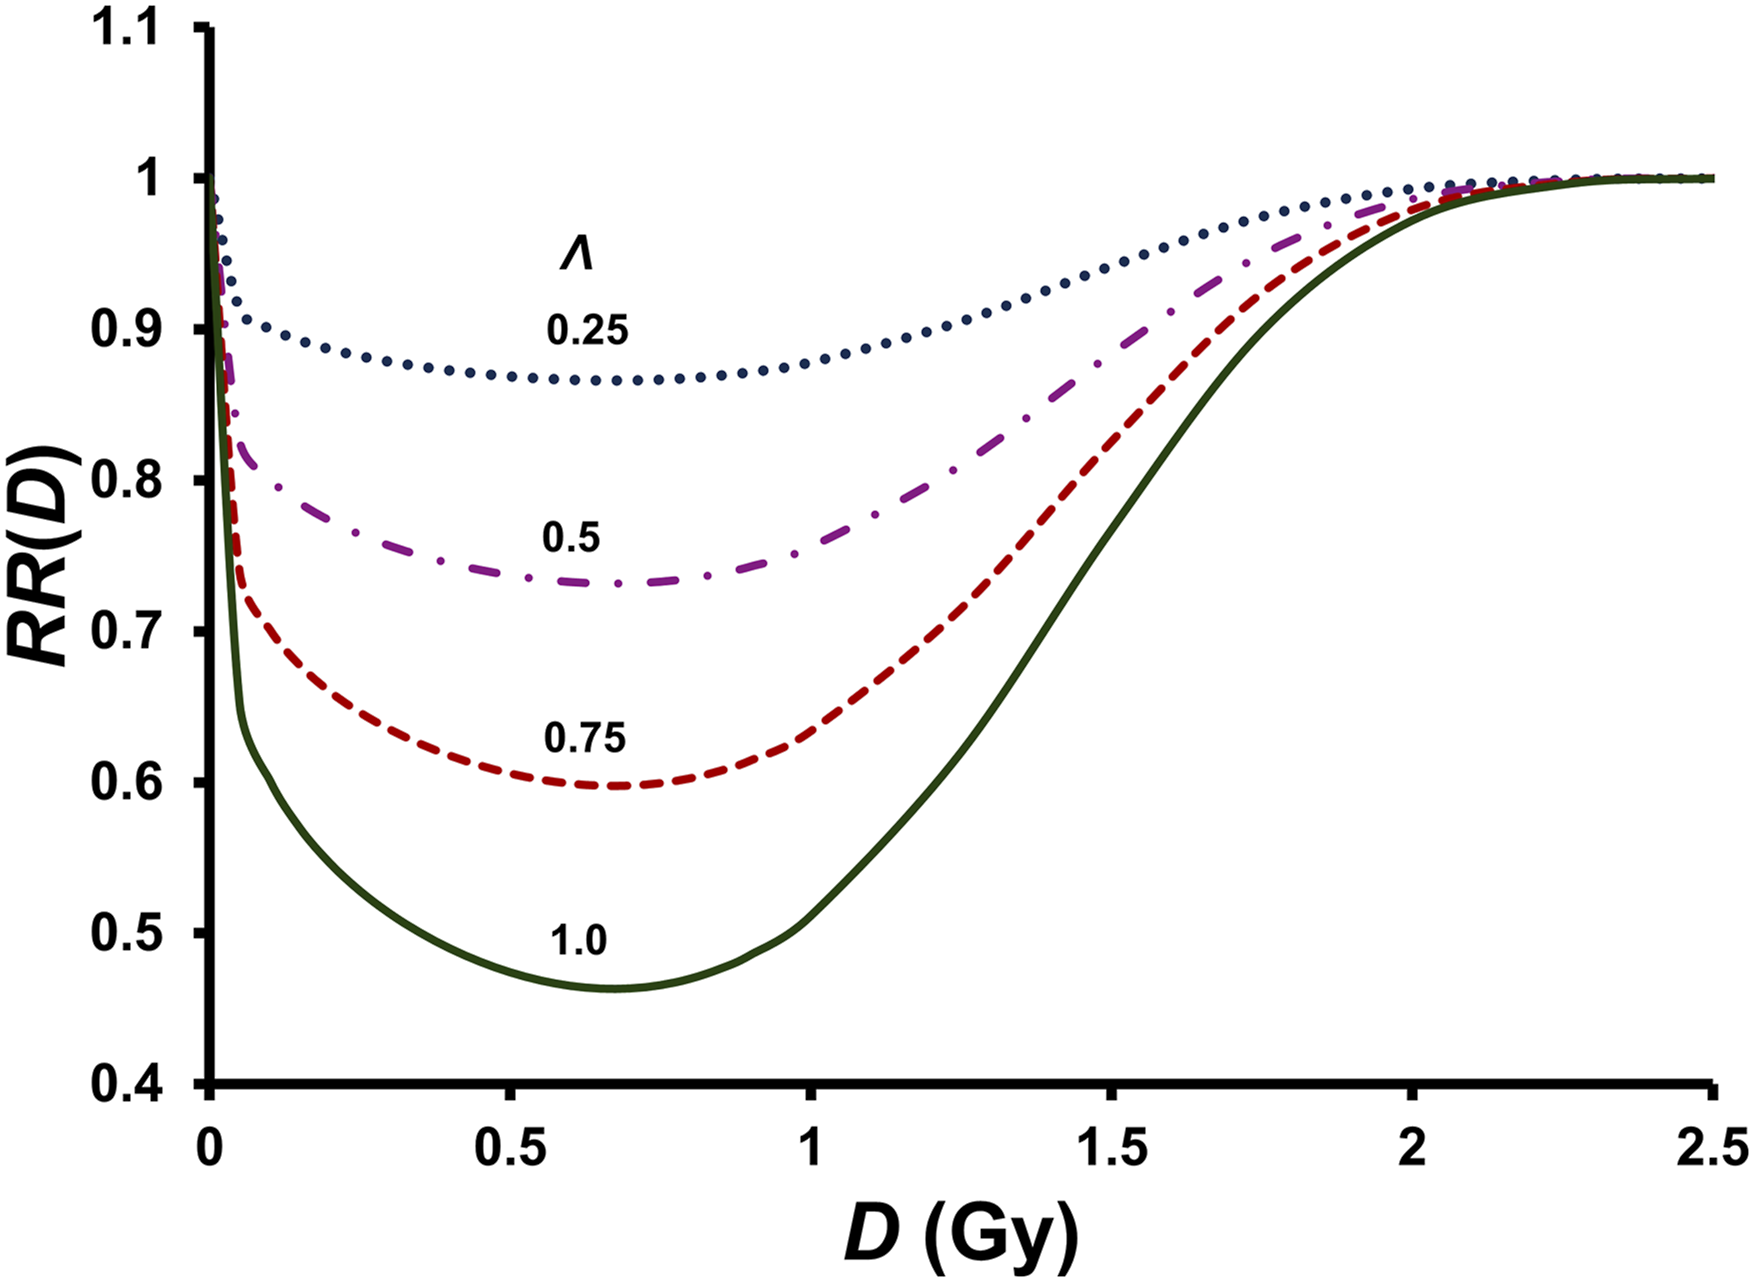
Applications of the HRR Model to Dose-Response Data
Figure 4 through Figure 12 show results of application of the HRR model to cancer data from a study at Oak Ridge National Laboratory by Ullrich’s group
20
that involved more than 15 000 137Cs gamma-rays-exposed female RFM mice. The data are quite valuable today as it is unlikely that such a large study using mammals and low, intermediate, and high radiation doses will ever be performed again. HRR-model-based lung cancer RR(D) vs dose D relationship for female RFM mice exposed at high dose rates to 137Cs gamma rays based on cancer incidence data from a study of Ullrich et al
20
using more than 15 000 mice. Error bars are for 95% CI. Data points below the bottom horizontal dashed line are significantly (P < 0.025) less than the estimate RR(0 Gy) = 1. The uncertainty (95% CI was evaluated) related to the estimate RR(0 Gy) = 1 is often missing from research publications.
10
HRR-model-based disease prevention function DPF(D) for preventing/eliminating lung tumors in female RFM mice exposed at high dose rates to 137Cs gamma rays, based on the RR(D) results presented in Figure 4. Error bars are for 95% CI based on the RR(D) estimate r having a lognormal distribution. Data points above the horizontal dashed line are significantly (P < .025) greater than the estimate DPF(0 Gy) = 0. Derived weibull probability density fe(D) for the distribution of E thresholds and Weibull probability density fs(D) for the distribution of S thresholds, associated with the smooth curve in Figure 4. Results in Figure 4 re-plotted as a function of D / λe, with four data points (filled triangles) from a female RFM mouse study of Ullrich et al
20
using fission neutrons added to the figure along with the fitted smooth curve for the neutron data based on the HRR model. Both D and λe are in grays. Error bars are for 95% CI, based on a lognormal distribution. Data points below the bottom horizontal dashed line are significantly (P < .025) less than the estimate RR(0 Gy) = 1. For gamma rays, λe = 1.5 Gy, as in Figure 4. For neutrons, λe = 0.1 Gy. HRR-model-based reticulum cell sarcoma (non-Hodgkin lymphoma) RR(D) vs dose D relationship for female RFM mice exposed at high dose rates to gamma rays based on incidence data reported elsewhere.
20
Error bars are for 95% CI, based on a lognormal distribution. Data points below the lower horizontal dashed line are significantly (P < .0025) less than the estimate RR(0 Gy) = 1. HRR model parameter assignments were m = 0.37, n{m} = m-1 = 2.7, and λs{λe} = λe = 7.0 Gy. HRR-model based disease prevention function DPF(D) for preventing/eliminating reticulum cell sarcoma (non-Hodgkin lymphoma) in female RFM mice exposed at high dose rates to gamma rays, based on RR(D) results in Figure 8. Error bars are for 95% CI, based on a lognormal distribution of estimates of RR(D). Data points above the horizontal dashed line are significantly (P < 0.0025) greater than the estimate DPF(0 Gy) = 0. Predicted dose-response curves for DPFu(D) for 137Cs gamma-ray exposed female RFM mice, for single and multiple exposures to fixed very small doses d, based on equation (10), and HRR model parameters used for Figure 4. DPFu(D) values were adjusted for uncertainty in the estimate DPFu(0 mGy) = 0 by subtracting 0.0644 (see horizontal dashed line in Figure 5). The adjustment helps to prevent overestimating the cancer prevention/elimination benefit of the radiation exposure.
1


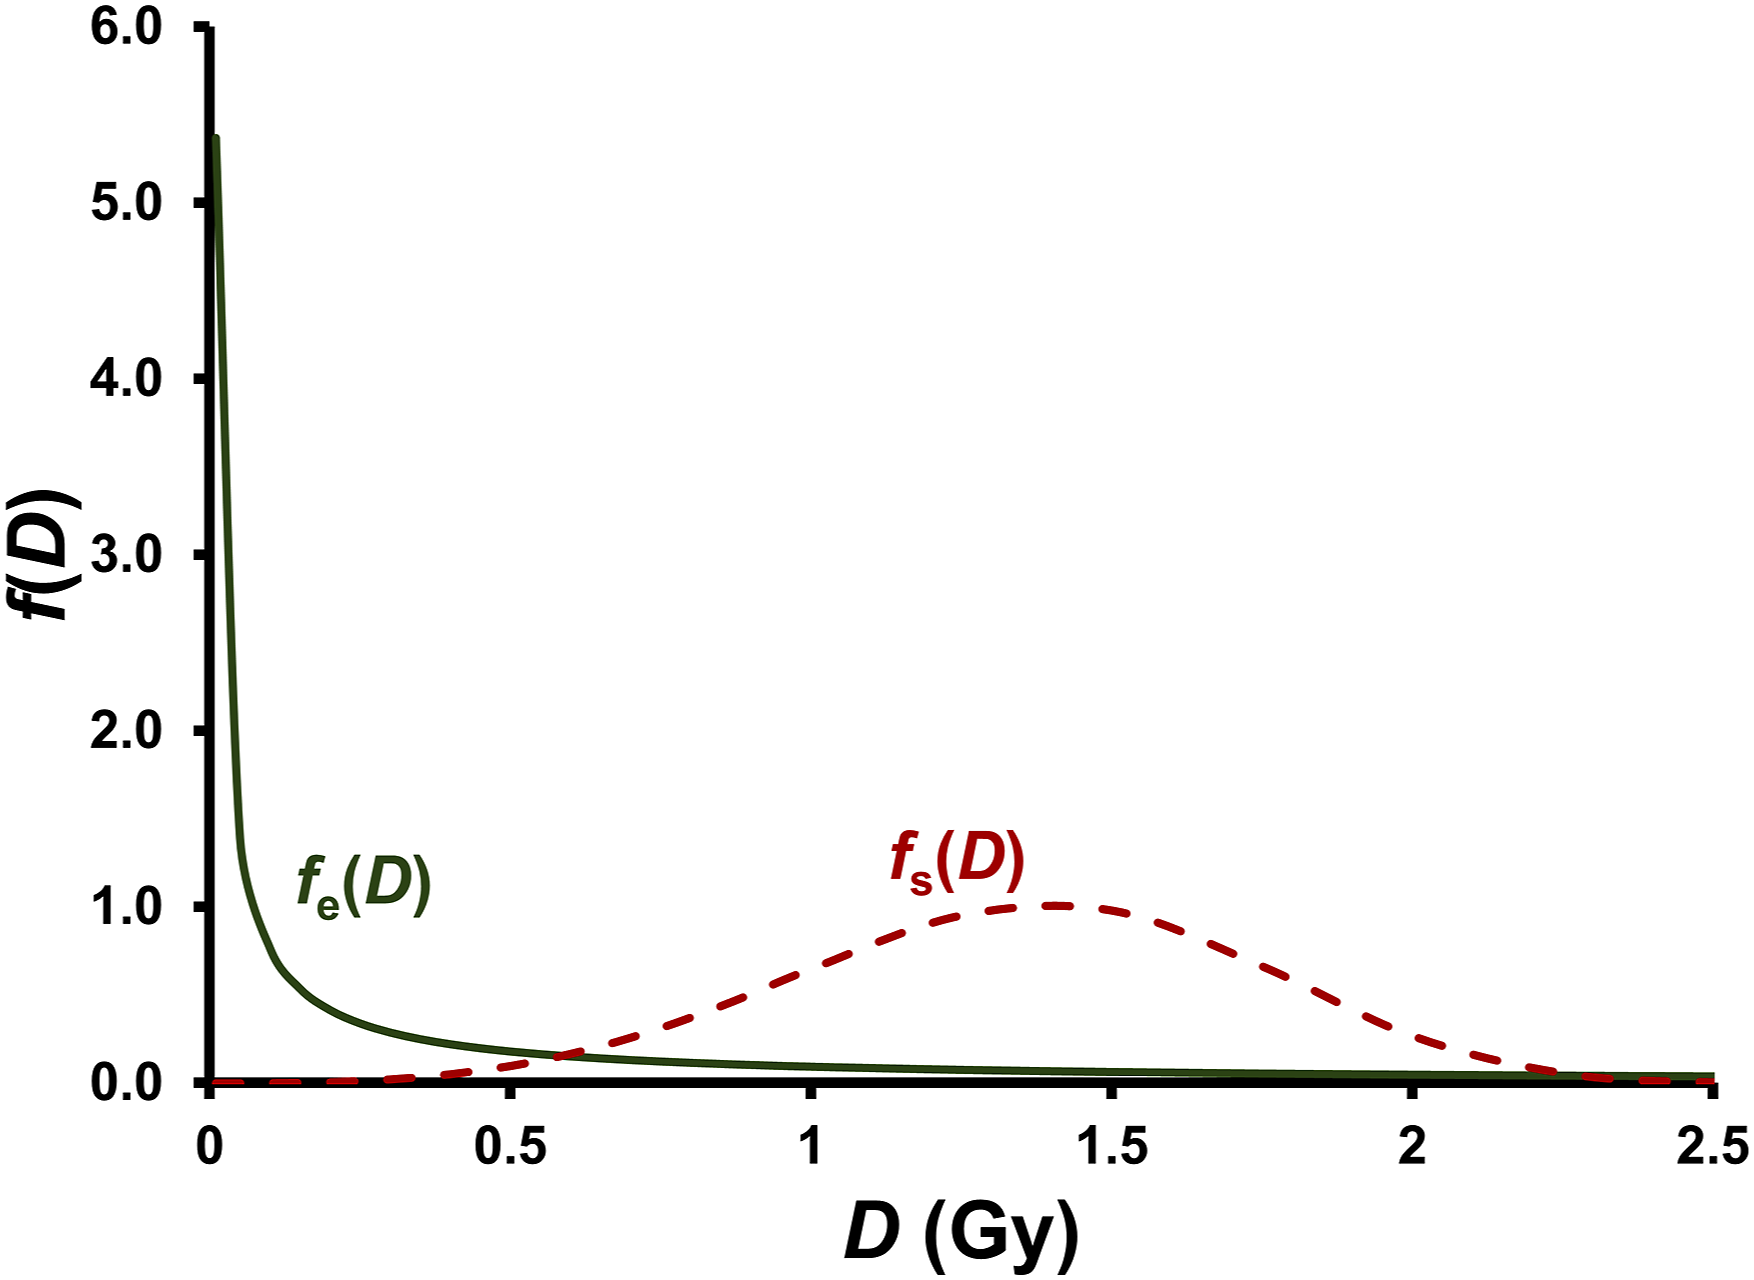
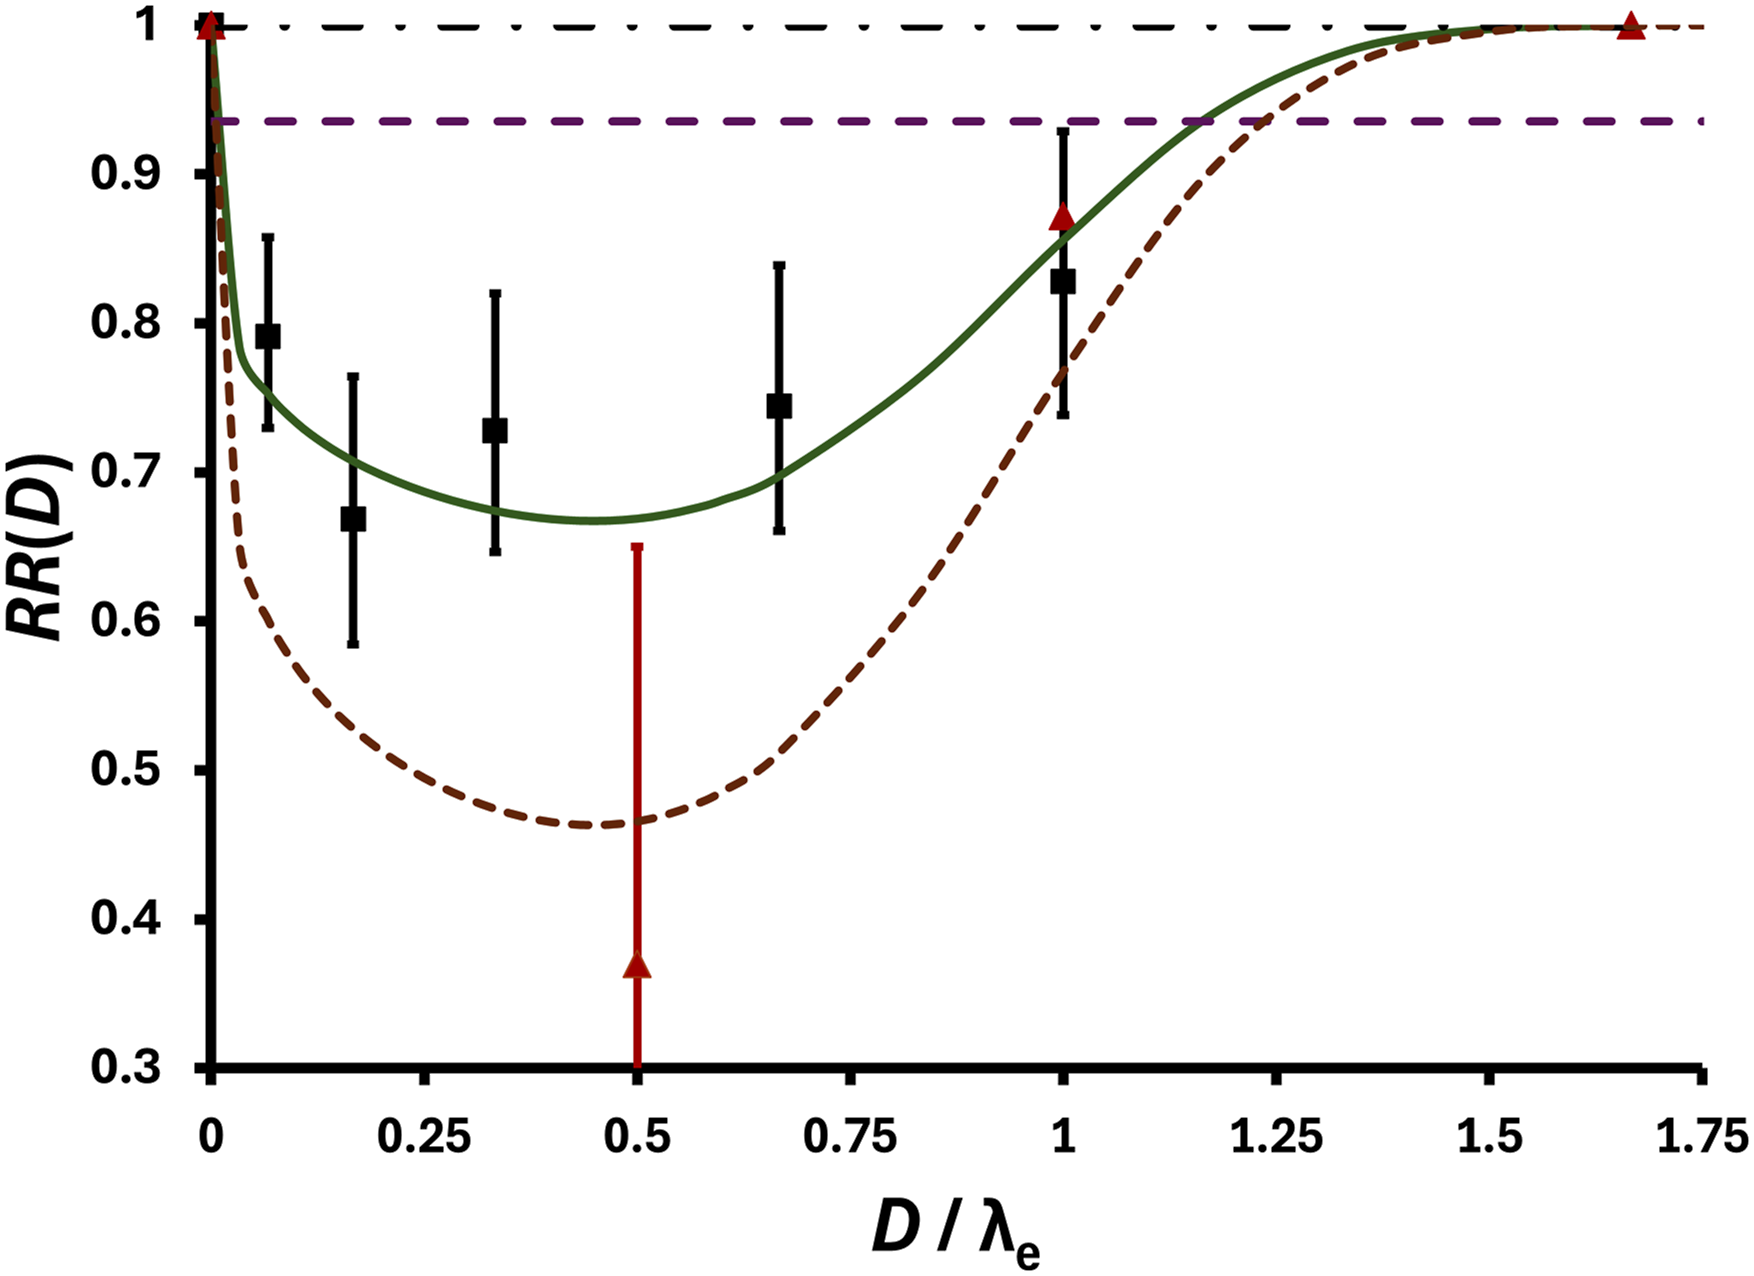


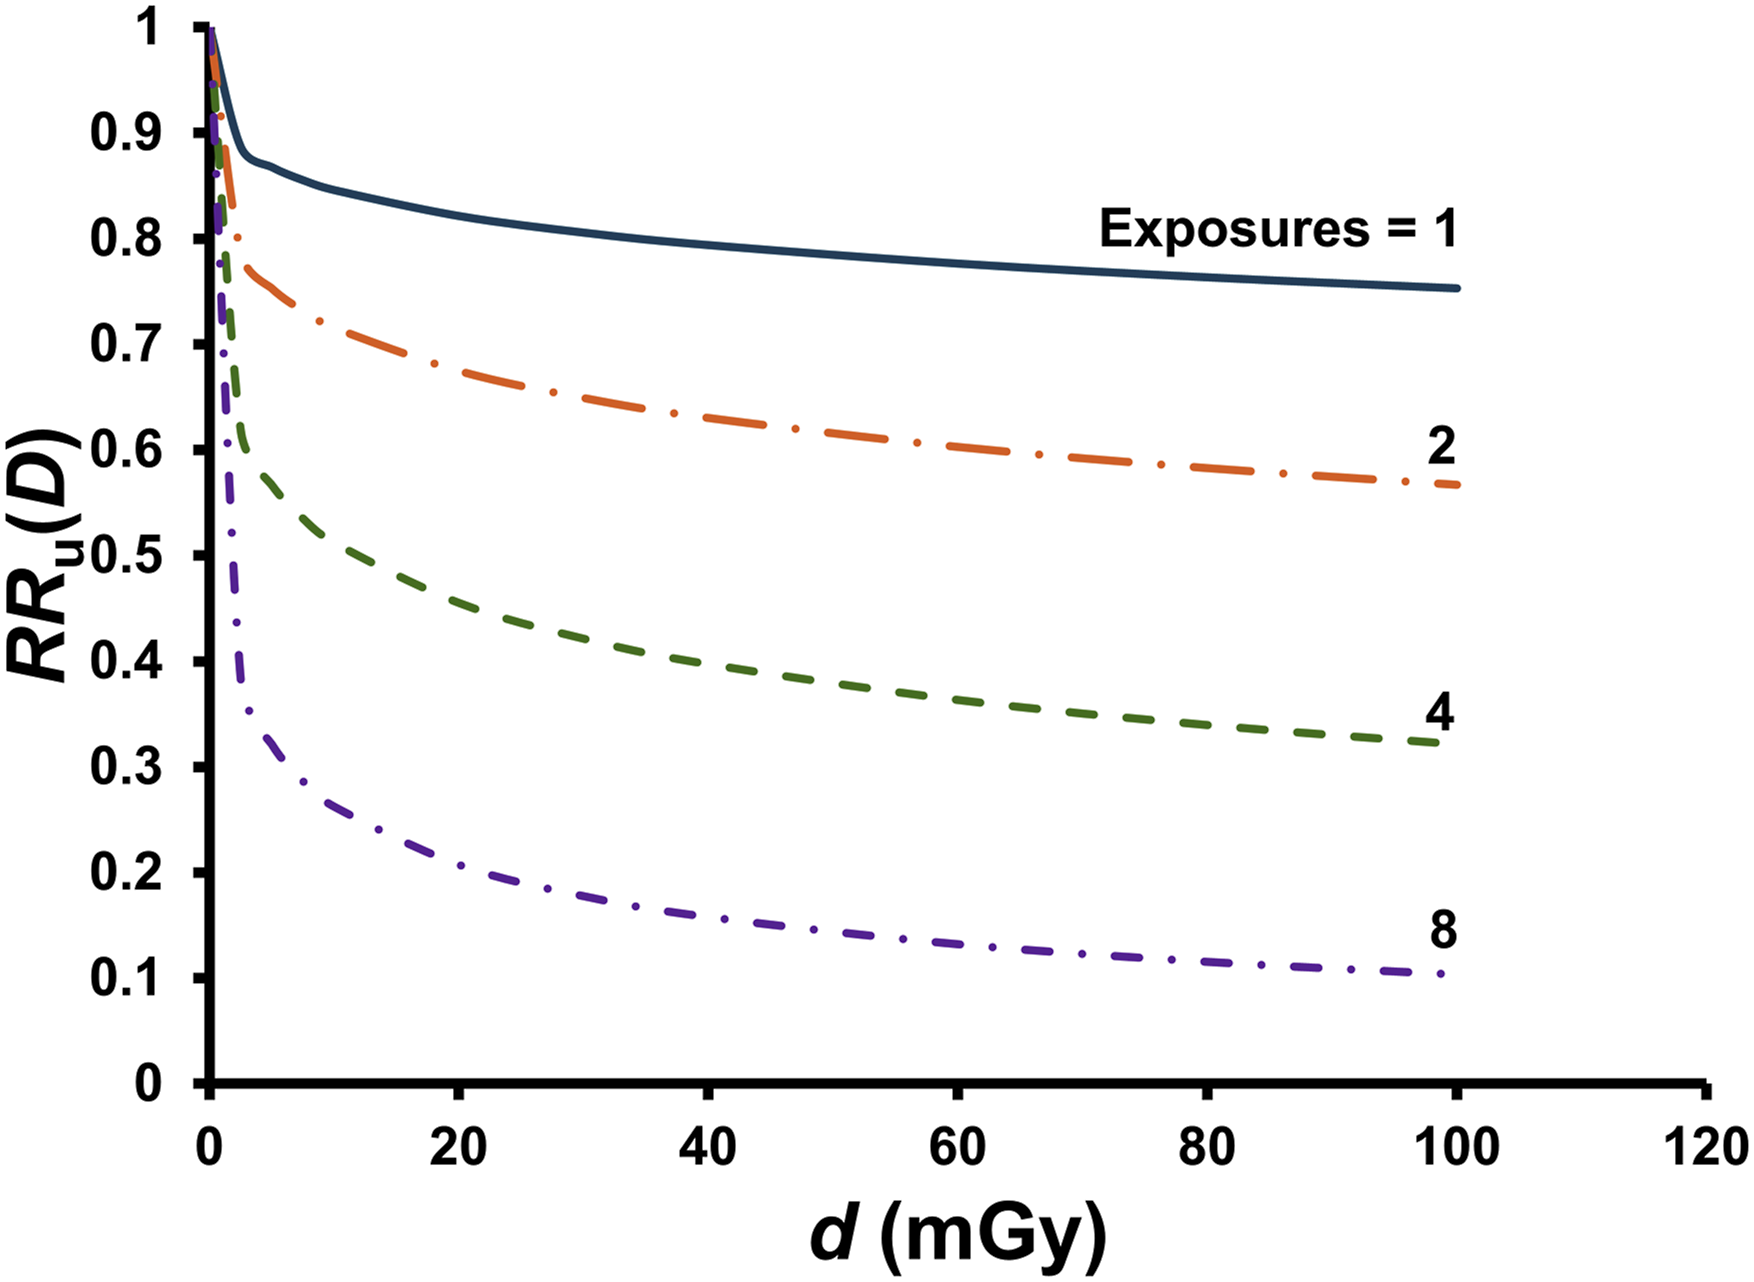


Figure 4 shows results for RR(D) for spontaneous lung tumor (adenomas) suppression/elimination by low-dose, single-exposure, high-dose-rate, 137Cs gamma rays. HRR model parameter assignments were m = 0.25, n{m} = m-1 = 4, Λ = 0.62, and λs{λe} = λe = 1.5 Gy. Note that with λe = λs{λe} = 1.5 Gy, 1.5 Gy < Dt < 2.5 Gy. No adjustments have been made for uncertainty in the estimate RR(0 Gy) = 1. The results for DPF(D) for lung cancer based on RR(D) findings in Figure 4 are presented in Figure 5. Results in Figures 4 and 5 should be considered the current best estimates that could change with additional modeling research.
Note that there is a steep initial drop in the dose-response relationship for RR(D) in Figure 4, and corresponding steep initial increase in DPF(D) in Figure 5. RR(D) reaches a minimum at a dose between 0 and 1 Gy and then increases to RR(D) = 1 at a dose between 2 and 2.5 Gy. The results presented in Figures 4 and 5 clearly invalidate the LNT hypothesis as applied to lung cancer induction by low radiation doses to Female RFM mice, as with the hypothesis no decrease in cancer risk can occur as dose increases. Only radiophobia-promoting cancer risk increases are predicted based on the LNT hypothesis.
Radiation Health Effects Truths vs Falsehoods.

Figure 6 presents the generated Weibull distributions fe(D) and fs(D) that relate to the smooth curves in Figures 4 and 5, which were generated with the already pointed out links for shape parameters and for scale parameters for the E and S distributions of individual-specific E and S thresholds. The assigned distributions in Figure 6 should be considered the current best estimates that could change with additional modeling research. The distributions should be interpreted to apply to a very large population exposed to many different absorbed radiation doses from 0 to 2.5 Gy.
The steep initial decline in RR(D) in Figure 4 (and steep initial rise in DPF(D) in Figure 5) as dose increases can be explained on the basis of gensadaptation-linked natural protection being efficiently enhanced with mild genomic stresses associated with very low radiation doses. This is reflected by fe(D) being predominant at low doses (see Figure 6). The increase in RR(D) (and decrease in DPF(D)) at higher doses can be explained based on fs(D) predominating for this dose region (see Figure 6). Note that for the assigned unexposed group (controls), the baseline level of natural protection is likely already elevated due to the genome stresses from natural background radiation and other sources, thereby facilitating efficient enhancement of natural protection by low radiation doses above natural background radiation exposure.
Figure 7 shows how the use of “Dose / λe” as independent variable allows comparing results obtained in Figure 4 for gamma rays with results of a smaller study of Ullrich et al 20 using neutrons and the same mouse strain and gender. Controls from two neutron studies were combined (total control mice = 648, total lung cancer cases = 177). To avoid clutter, error bars for the neutron data were only plotted for the lowest data point for neutrons. The Λ estimate assigned for neutrons was 1.0, compared to the estimate of 0.62 for gamma rays. The same estimate was assigned for m (= 0.25) for both radiation types as was used in Figure 4 for gamma rays. This relates to m presently being assumed to be independent of the radiation microdose distribution.
The very low data point (shaded triangle) in Figure 7 for D / λe = 4.8 is for neutron absorbed dose = 0.048 Gy (48 mGy) and r = 0.37 (95% CI: 0.202, 0.639), suggesting that > 35% of expected baseline lung tumors were prevented or eliminated by a single small neutron dose. Interestingly, the width of the hormetic zone for the high dose-rate neutrons is narrow (λe = 0.1 Gy; current estimate) compared to the wide zone (λe = 1.5 Gy; current estimate) for high-dose-rate gamma rays. Perhaps a research group with expertise in radiation biology, radiation chemistry, and radiation physics might explore possible reasons for this more than 10-fold difference for high vs low-LET radiation. Note that implied is an RBE of 15 when evaluated at the population threshold Dt. Estimates of 150 mGy and 2250 mGy, for Dt for neutrons and gamma rays respectively, based on the two fitted curves in Figure 7, are consistent with this possibility.
The max for DPF(D) (= 1 − RR(D)) for the high-dose-rate, single-dose neutrons appears to be larger than the max for the high-dose-rate, single-dose, gamma rays. This is due in part to Λ for neutrons being assigned the value 1.0 compared to 0.62 for gamma rays.
Figures 8 and 9 show applications of the HRR model to data for reticulum cell sarcoma (RTC) in female RFM mice (more than 15 000) exposed at high dose rates to single doses of 137Cs gamma rays, based on incidence data also from Ullrich et al 20 , Interestingly, λe (= 7 Gy; current estimate) is quite large for RTC compared to the value for lung cancer (λe = 1.5 Gy). This suggests that evolution-related gensadaptation may be further along for the RFM mouse reticulum than for their lungs. Note that the data point at 0.1 Gy is suggestive of an absence of any E thresholds being exceeded, which is indeed a possibility.
Ullrich et al (1976) also generated RR(D) data for neutrons-exposure-associated reticulum cell sarcoma. However, doses when weighted by RBE (10 to 20) greatly exceeded what would be considered low doses, so no attempt has been made to model this data, even though the relative risk estimates decreased with increasing unweighted absorbed dose, which ranged from 0.24 Gy to 1.88 Gy. Possibly high-dose destruction of spontaneous tumors may have been involved, especially for the1.88 Gy group. For an RBE of 10 to 20, the weighted dose would be 18.8 to 37.6 RBE-weighted Gy.
Discussion
New knowledge about a molecular mechanism that may help explain E thresholds is first discussed. Next discussed is a new approach (theoretical) for obtaining hormetic dose-response relationships for RR(D) and DPF(D) for different radiation types and related research needs. Dose rate influences on RR(D) and DPF(D) are then discussed, followed by a discussion of an approach to addressing repeated exposure (low doses) impacts on RR(D) and DPF(D). Then discussed are how combined exposures to different radiation types (i.e., mixed radiations) can be addressed, followed by a discussion of evidence for mitigating very high dose chemical carcinogen harm (tumors) to the lungs using small gamma-ray doses. Some key questions prompted by study findings are then discussed, followed by a discussion of the implications of research findings in the paper for improving the SRP.
TRA2β Reduction and Tumor Suppression
Our cells have a natural editing system that allows them to alter genetic instructions which permits them to create different proteins using the same gene. This gensadaptation-related gift of evolution is known as alternative RNA splicing. The splicing mechanisms finetunes how specific proteins function, aiding in responding to genomic stresses. When the splicing is not properly functioning, spontaneous tumors may occur, and their rate of growth may accelerate over time.21,22
Improper splicing can lead to high levels of TRA2β levels in cells, which favors the occurrence of certain cancers. The TRA2B gene, which encodes TRA2β, is amplified in ovary, lung, cervix, head, stomach, and neck tumors and TRA2β expression favors cancer cell survival. 21
While high levels of TRA2β promote cancer cell proliferation and migration, its suppression reduces cell proliferation and invasion and promotes apoptosis (self-destruction) of breast, lung and brain cancer cells, benefits of gensadaptation.21,23 The inhibition of invasion and the promotion of apoptosis of cancer cells are also benefits of low-dose radiation, 1 suggesting a possible link between E thresholds and TRA2β suppression. The suppression can arise due to TRA2β poison exon interacting with TRA2β, leading to lncRNA with anti-tumor effects. 21 This raises the possibility that lncRNA with anti-tumor effects may be a consequence of mild-stress-related intracellular and intercellular signaling stimulated by low radiation doses. If so, E thresholds would likely be associated with protective molecular changes 23 linked to anticancer activities.
Dose-Response Relationships for Different Radiation Types
Predicting RR(D) for high-LET (h) radiation based on results for λe for low-LET radiation (indicated here by λe,L) of a specific type and Λ for low-LET radiation (indicated here as ΛL) of a specific type can be achieved using the relationship λe,h = ΩL,h-1 × λe,L > 0 (e.g., mGy) and the relationship Λh = ψL,h × ΛL ≤ 1. Note that the indicated relationships pose constraints on the LET-based weighting factors ΩL,h and ψL,h because λe,h > 0 and because the protection factor cannot be > 1.
Presently, it appears that the shape parameter m may be independent of the type of radiation as well as dose rate. This along with possible values for ΩL,h and ψL,h need to be investigated experimentally, with perhaps theoretical support.
An estimate of the weighting factor ΩL,h for fission neutrons relative to 137Cs gamma rays, based on Figure 7 is ΩL,h = 1.5 Gy/0.1 Gy = 15. A similar value may also apply to alpha particles, fission fragments and heavy nuclei, when evaluated relative to 137Cs gamma rays for high-dose-rate exposure. The value ΩL,h = 15 for fission neutrons relative to gamma rays is similar to the current radiation weighting factor WR = 20 for alpha particles, fission fragments, heavy nuclei, and neutrons with energies in the range >100 keV to 2 MeV. This may also be the case for other radiation types (X-rays, beta particles, muons, and protons) for which WR ≤ 2. Stated differently, the HRR model weighting factor may be < 2 for X-rays, beta particles, muons, and protons.
Note that a value for ΩL,h such as 15 indicates that Dt for the high-LET radiation of interest is lower than for low-LET radiation and thus may be lower than doses employed in many previous experimental studies of cancer induction by high-LET radiation. Note also that detecting such thresholds in epidemiological studies of populations of humans exposed to radiation (e.g., A-bomb survivors, Mayak plutonium facility workers, etc.) would be quite challenging, especially when LNT is used as the null hypothesis.
An estimate of ψL,h for fission neutrons relative to 137Cs gamma rays is ψL,h = 1/0.62 = 1.6 (rounded). A similar value may also apply to heavy ions and other high-LET sources for high dose rates. The uncertainty associated with the estimate 1.6 should be considered to be relatively large because the estimate is based on limited data.
Dose Rate Effects
Here the focus is first on dose rates for delivered radiation doses significantly above natural background radiation exposure. Increasing this dose rate is expected to reduce λe. This is because for low dose rates natural protection processes operate more efficiently than for high dose rates. Thus, the dose range 0 to Dt (e.g., in Gy) is expected to be wider for low dose rates than for high dose rates, including varying low dose rates from internal radionuclides.
Whether m for a given cancer type depends on dose rate needs to be researched. Possibly, m may be found to be dose-rate-independent. If so, replacing the ratio D/λe with the unitless dose Z (= D/λe) would allow for predicting RR(D) and DPF(D) for all dose rates of interest, based on results for but one dose rate or dose-rate-pattern-related study to determine the value for m and associated uncertainty, for a given cancer type. Thus, for Z = 1, the evaluated endpoint (e.g., RR(D) = r) applies to all dose rates and dose rate patterns for the cancer type and population considered. The protection factor Λ is presently assumed to be independent of the dose rate.
For exposure only to natural background radiation, the baseline absolute risk AR0 for cancer of a specific type is expected to depend on the average dose rate for the mixed radiation types involved. AR0 may be negatively correlated with the natural background radiation dose rate as gensadaptation may be further along evolutionarily for areas with higher natural background dose rates than for areas with lower rates. This would be implicated if cancer mortality was found to be lower in areas with high natural background radiation exposure (e.g., some parts of Ramsar, Iran and Kerala, India) 24 when compared to areas with lower natural background radiation exposure.
For a discussion of an approach to addressing dose-rate effects for D > Dt, see the complementary paper. 1
Repeated Exposure to Small Radiation Doses
For repeated exposures to different very small, absorbed radiation doses di, the relative risk (indicated as RRu(D)) can be evaluated using relative risk contributions rri(di) for the consecutive small doses d1, d2, …, du, for u exposures and total dose D. Here rri(di) relates to the ith exposure and is conditional on prior doses d1, d2, …, di-1, for i > 1, and rr1(d1) = RR(d1), with RR(d1) evaluated using B(d1), according to equation (7). In this case, the following solution applies for RRu(D), where D is now the sum of the small doses d1, d2, …, du:
Note that each rri(di) for di > 0 is < 1 and therefore reduces RRu(D), unlike is the case for LNT functions of dose. New research is needed related to mathematically characterizing the conditional (on prior exposure) function rri(di) for i > 1, as it may differ from RR(di) when there is a prior dose di-1. In the special case, should it occur, where each dose di, for i > 1, acts independently of all prior doses and each dose di has a fixed value d, then RR(D) can be evaluated as follows:
Similar results as presented in Figures 10 and 11 would be expected for X-rays. For fission neutrons, similar results are expected when the dose fraction size is about 15-fold smaller. This is based on the estimate ΩL,h = 15 for neutrons relative to gamma rays.
The results in Figure 11 along with those in Figures 5 and 9 support the view that repeated-exposure, low-dose radiation therapy, may be a way to treat lung cancer and non-Hodgkin lymphoma in humans. Some other diseases might also be treated with low-dose radiation therapy.1,25,26
The low dose therapy could possibly involve gamma rays, X-rays, or high-LET radiation (e.g., neutrons). With neutrons, smaller absorbed doses d would likely apply than for gamma and X-rays.
For treating different diseases with low-dose therapy, it is possible that the optimal time interval between the different exposures would not be the same for different diseases should repeated low-dose therapy be proven appropriate. New research is needed to help clarify whether repeated low-dose therapy is appropriate.
In designing such studies, in no circumstance should the SRP-related radiation effective dose be used. The LNT-linked effective dose is hypothetical and was intended for use in limiting radiation exposure. It is not a measure of the radiation dose to a specific organ or tissue.
Now there is growing interest in possibly using low-dose-radiation therapy to treat some diseases in pets. One such disease is idiopathic cystitis in cats, which often leads to necessarily euthanizing the animal. Findings reported here and elsewhere 1 related to low radiation doses enhancing the body’s natural defenses support conducting research on the possible use of single or multiple small radiation doses (e.g., X-rays) to treat feline idiopathic cystitis.
Mixed Radiation Exposures
For mixed radiation exposures, λe (but possibly not m) will likely depend on the radiation mix in addition to the radiation exposure pattern. For mixed neutrons (N) and gamma rays (γ), a plausible solution for the scale parameter λe,γ,N is as follows (based on radiation mixture modeling elsewhere1,27):
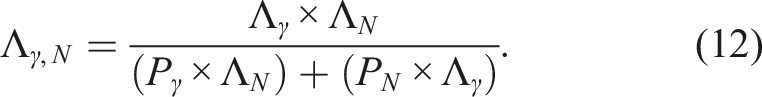
The solution for Dt for the N + γ mixture based on the cancer induction population threshold Dt,γ for gamma rays is as follows:
1


Figure 12 presents estimates of λe,γ,N and Λγ,N for lung cancer prevention/elimination by high-dose-rate mixed N + γ irradiation of female RFM mice, based on parameters used for the dose-response relationships in Figure 7. Note that for Pγ < 0.5, more weight is given to the neutron component of the dose, consistent with neutron RBEt,N > 10 (evaluated based on λe).
Mitigating High-Dose Chemical Carcinogen Harm with Low-Dose Radiation
Cigarette smoking causes thousands of mutations in heavy smokers’ lungs. 28 High doses of cigarette smoke carcinogens such as urethane and benzo[A]pyrene when administered to mice can exceed all chemical carcinogen S thresholds, and if greatly exceeding the population chemical carcinogen threshold (corresponding to Dt) for lung cancer induction can lead to multiple lung tumors per mouse. Interestingly, in such studies, following the chemical exposure with repeated low-doses of gamma rays or low-dose-rate, low-dose gamma rays can lead to a reduction in the number of lung tumors per animal and also smaller lung tumors.1,15,29,30 This suggests that E-threshold-linked natural protection processes related to low-dose radiation act independently of high-dose chemical carcinogen damage to the lungs. If so, this would support the possible use of low-dose radiation therapy for lung cancer, e.g., for heavy smokers and some chemical industry employees.
The possibility of low-dose radiation, including from residential radon, preventing smoking-related lung cancer has been discussed in published experimental and epidemiological studies.31-33 The lung cancer prevention findings support the view that reducing the residential radon level for homes of heavy smokers, could in some cases actually lead to an increase in their lung cancer and lung cancer mortality risks.
Some Key Questions Related to Study Findings
As with many research studies to address specific research questions, study findings generate new questions that also need to be addressed. The following are such questions arising from this and a complementary study
1
: • Why has gensadaptation not been taken into consideration in developing the current SRP? • How can a single-exposure, small gamma-ray dose provide long-lasting protection against lung cancer and other cancer types? Is similar protection provided by a single-exposure, small X-ray dose? • How long does the single-exposure protection last, and can the protection be extended by additional small doses later in life? • Why does the range over which low radiation doses are protective depend on the type of cancer? • Is repeated small doses (repeated-d) therapy a way to treat different types of cancer in humans? If so, what values to use for d, and how many repeated doses should be used, and with what time intervals between the doses? • Could other diseases in humans also be treated with low radiation doses and if so which diseases? • Could some diseases in pets (e.g., cats and dogs) also be treated with low-dose radiation? If so, would this include idiopathic cystitis in cats? • Are small high-LET doses more effective in preventing and treating cancer than small low-LET doses? If so, is this due to microdose distribution differences between high- and low-LET radiation?
Implications of Findings for the System of Radiological Protection
The SRP and related health risk assessments for low radiation doses are widely used34,35 and as already pointed out there has been radiophobia-related harm to society, because of the link to the invalid LNT hypothesis 1 for the risk of radiation-caused health detriment (related to cancer, hereditary effects, life shortening, etc.). Radiophobia-related harm to many occurred following the 1986 Chernobyl and 2011 Fukushima nuclear power plant accidents. The SRP, as currently implemented based on the LNT hypothesis, is strongly supported by many that intentionally profit from radiophobia (i.e., radiophobia industry), 1 making it quite challenging to end reliance on the invalid hypothesis as applied to health risk assessment.
Note that LNT-linked equivalent dose (singly-weighted absorbed dose) and effective dose (absorbed dose doubly weighted) are components of the SRP along with the principle of ALARA (as low as reasonably achievable) related to the radiation exposure level. 36 With the use of population thresholds Dt for radiation-caused cancer, the ALARA concept would likely no longer be needed, and effective dose would have no credibility for use in health risk assessment.
Tissue/organ-specific equivalent dose HT, and related equivalent dose limits could still be used in radiological protection, but radiation weighting factors may need to be adjusted to be applicable to dose thresholds for harm, as discussed elsewhere. 1 The relative dose RD = D/Dt (or RD = HT/HT,t; for the population threshold equivalent dose HT,t for radiation-caused harm) is an additional resource for improving the SRP, as dose-rate-independent and radiation-type-independent RD limits could be used along with or instead of equivalent dose limits in some cases. 1
The SRP-based dose- and dose-rate-effectiveness factor (DDREF), which assigns > 0 cancer risk for doses below the unacknowledged (by SRP participants) population threshold Dt, is inappropriate for threshold dose-response relationships. A dose-rate-effectiveness factor (DREF) can be employed to a Dt (or corresponding HT,t) value derived for high-dose-rate exposure to assign a corresponding larger threshold absorbed dose (or equivalent dose) for a low-dose-rate exposure.
Study Limitations
Formal statistical analyses related to estimating HRR model parameters have not been performed, so model-parameters-related uncertainties have not been characterized. Results presented should therefore be considered as a first step in implementing the greatly improved HRR model. With formal statistical analyses (e.g., Bayesian inference), means and medians of the posterior distributions for model parameters may differ somewhat from the parameter point estimates derived in this study. But it is expected that the point estimates would be within the 95% CI for the Bayesian posterior distribution for each parameter.
Dose-rate effects on B(D), DPF(D) and RR(D) have not been modeled. This needed modeling research could be pursued by participants in a current or future low-dose-radiation research program. A similar approach as is applied to radiation deterministic effects 27 might be considered. Possibly, only model parameter λe (and λs if independent of λe) needs to be treated as depending on dose rate for external radiation sources or dose-rate pattern for internal radionuclides.
Conclusions
The use of E and S threshold distributions allow for mathematically characterizing HRR model functions B(D), DPF(D), and RR(D) and also provide a theoretical basis for the model. With the parameter links n{m} and λs{λe}, only three parameter value assignments are needed for implementation of the model. The greatly improved model allows for many different hormetic dose-response relationships for cancer relative risk.
The low-dose-radiation enhancement of natural protection against cancer findings reported related to lung cancer and reticulum cell sarcoma (non-Hodgkin lymphoma) prevention/elimination in RFM mice are supportive of the possible use of low dose radiation (e.g., multiple exposures) to treat these and other diseases in humans.
Based on findings in this and also some earlier studies, for radiation doses < Dt one should focus on the potential health benefits of radiation exposure, not on the phantom risk of radiation-caused cancer. However, any estimate of Dt will likely have rather large uncertainty. Decisions about radiation exposure limitation via the SRP will therefore need to allow for the indicated uncertainty. Hopefully, findings reported here and in the complementary paper cited will aid the ICRP in updating the SRP so as to account for health benefits from radiation doses < Dt. Doing so would greatly help in preventing radiophobia-related harm in the event of radiation exposure of a population such as occurred following the Chernobyl and Fukushima nuclear accidents.
Footnotes
Authors’ Note
The views and conclusions contained herein are those of the author and should not be interpreted as necessarily representing policies or endorsement of his affiliated institution.
Acknowledgements
The author is grateful to the two reviewers for their comments and to SAGE for publishing a Special Collection focused on radiophobia harm.
Author Contributions
The author carried out the research presented and prepared the paper.
Funding
The author received no financial support for the research and authorship of this paper.
Declaration of Conflicting Interests
The author declared no potential conflicts of interest with respect to the research, authorship, and/or publication of this article.
Data Availability Statement
The cancer incidence data this study relied on are available in Ullrich et al 20