
Abstract
Objectives
Ginseng and its extracts have shown promising therapeutic effects on gastric cancer (GC). We aimed to investigate the functions and potential mechanisms of Ginsenoside Rk1 (Rk1) on GC.
Methods
GC cell lines were treated with different doses of Rk1. The CCK-8 assay and BrdU assay were used to measure cell viability and proliferation. A Transwell assay was used to evaluate cell invasion and migration. A TUNEL assay was used to assess cell apoptosis. RT-PCR was conducted to detect apoptosis-associated genes. Western blotting was used to determine the activation of the AMPK/mTOR pathway. An in vivo tumor-bearing nude mouse model was generated to investigate the impact of Rk1 on tumor growth.
Results
Rk1 inhibited the proliferation, migration, invasion, and EMT of GC cells and promoted cell apoptosis. It also enhances the sensitivity of GC cells to chemotherapy drugs (including 5-fluorouracil, vincristine, cisplatin, and oxaliplatin). Mechanistically, Rk1 increased AMPK phosphorylation and repressed mTOR phosphorylation. AMPK inhibition strongly decreased the inhibitory effect of Rk1 on GC cells. In-vivo assays suggested that Rk1 considerably hindered GC growth and had synergistic effects when combined with cisplatin or oxaliplatin.
Conclusion
Ginsenoside Rk1 exerts an antitumor effect on GC by activating the AMPK/mTOR pathway.
Introduction
Gastric cancer (GC) is the fifth most commonly diagnosed cancer and the fourth leading contributor to global cancer-associated mortality. 1 Approximately 40% of all GC patients are diagnosed when the disease has reached an advanced stage, leaving them without the opportune moment for surgical intervention. 2 Systemic therapies for GC, including chemotherapy, targeted therapy, and immunotherapy, have evolved significantly in the past few years to improve patient survival time and living standards. 3 However, the therapeutic effect of chemotherapy on tumors is limited by the emergence of primary or secondary multidrug resistance (MDR) and side effects in patients who are taking chemotherapy drugs.4-6 Exploring novel strategies for overcoming chemoresistance is indispensable for increasing the overall survival rate of patients with GC.
Natural products are widely used for treating cancers because of their low toxicity and anticancer activities. They induce the apoptosis of GC cells and restrain tumor cell metastasis and proliferation.7,8 Panax ginseng has been widely used in Asia for thousands of years, not only as a medicine but also as a dietary supplement. 9 The long-term administration of ginseng has cancer-preventive effects. 10 The active constituents isolated from ginseng, such as ginsenosides and polysaccharides, have been demonstrated to have direct antitumor effects.11-13 Several ginsenosides were found to have potent antitumor functions on GC by inhibiting cellular proliferation, metastasis, and chemoresistance.14,15 The ginsenoside Rk1 (Rk1), a component found in processed ginseng, has anti-cancer effects on triple-negative breast cancer by mediating cell cycle arrest and apoptosis. 16 Rk1 can increase autophagy-dependent cell death and promote the apoptosis of primary hepatocellular carcinoma cells. 17 However, whether Rk1 has antitumor effects on GC and its functions in mediating chemoresistance remain to be explored.
Here, we aimed to investigate a novel natural production against GC. On the basis of previous studies, we hypothesized that Rk1 has antitumor functions in GC by mediating cell proliferation, apoptosis, migration and invasion. Both in vitro and in vivo assays were used to evaluate the role of Rk1 in mediating the malignant behaviors of GC cells. Moreover, we tested the effects of Rk1 on the sensitivity of GC cells to several chemical drugs, including cisplatin, 5-fluorouracil, vincristine, and oxaliplatin. Furthermore, we explored the mechanisms by which Rk1 affects GC development, likely by regulating the AMP-activated catalytic subunit alpha 1 (AMPK)/mechanistic target of rapamycin (mTOR) pathway. We hope that this study will provide novel targets for GC treatment.
Materials and Methods
Cell Culture
GC cell lines (BGC-823, MKN-28, MKN-45, MGC-803, SGC-7901, and AGS) and normal human gastric mucosa (GES-1) cells, procured from Wuhan Procell Life Technology Co., Ltd. (Wuhan, China), were cultured in medium containing 10% fetal bovine serum (FBS) from South American origin (BI, Israel) supplemented with 1% penicillin‒streptomycin (PS) consisting of 100 mg/mL streptomycin and 100 units/mL penicillin utilizing Roswell Park Memorial Institute 1640 (RPMI 1640) (BI, Israel). The cells were passaged and cultivated at intervals of either two or three days. Cultivation was performed in a 5% CO2 incubator, specifically a Heracell™ VIOS 160i CO Incubator (Thermo Scientific™, USA), with maintenance at 37°C.
Cell Treatment
Compound C (Article Number: HY-13418A), an AMPK inhibitor, was purchased from MedChemExpress (New Jersey, USA). Compound C was used to inhibit AMPK at a dose of 5 μM. 18 Rk1 (Article Number: HY-N2515), 5-fluorouracil (5-FU) (Article Number: HY-90006), cisplatin (Article Number: HY-17394), vincristine (Article Number: HY-N0488), and oxaliplatin (Article Number: HY-17371) were purchased from MedChemExpress (New Jersey, USA). BGC-823, MKN-45, MKN-28, SGC-7901, MGC-803, and AGS cells were subjected to Rk1 treatment at concentrations ranging from 5 to 160 µM for 24 hours.
Cell Counting Kit-8 (CCK-8) Assay
The BGC-823, MKN-28, MKN-45, MGC-803, SGC-7901, and AGS cell lines, along with GES-1 cells, were dispensed onto 96-well plates at a density of 2 × 10³ cells per well. The cells were cultured in an incubator for 24 hours and then treated with various doses of Rk1 for another 24 hours. Subsequently, 10 μL of CCK-8 solution from Meilunbio (Cat.No. MA0218, Dalian, China) was added to each well, and the plates were then incubated at 37°C for 2 hours. To quantify the absorbance at a wavelength of 450 nm, a Multiskan™ FC microplate reader manufactured by Thermo Scientific™ (USA) was used. We computed the ratio between the absorbance values of the experimental group and the control group, which subsequently represented cell viability.
5-Bromo-2′-dexoyuridine (BrdU) Assay
MKN-45 and MKN-28 GC cells were added to 24-well plates at a density of 5 × 10⁴ cells/well and incubated overnight at 37°C. After exposure to various concentrations of Rk1 for 24 hours, the cells were cultured for an additional 48 hours, after which 10 μM BrdU reagent (HY-15910, MedChemExpress, New Jersey, USA) was added for a two-hour incubation. The cells were washed with PBS twice and then fixed with 4% paraformaldehyde (Cat.No. P0099, Beyotime, Shanghai, China) for 30 min at room temperature. The cells were incubated at 37°C for 2 hours with the Alexa Fluor® 488 rat monoclonal [BU1/75 (ICR1)] to BrdU (Cat.No. ab220074, Abcam, Cambridge, UK). 4′-6-diamidino-2-phenylindole (DAPI) solution (Cat.No. ab228549, Abcam, Cambridge, UK) was used to stain the nuclei for 5 minutes. Finally, a fluorescence microscope (Nikon, Tokyo, Japan) was used to track and quantify the number of GC cells, and the percentage of BrdU-positive cells was subsequently computed.
Transwell Assay
Transwell chambers (8 μM in diameter, Cat. No. 3422) were purchased from Corning in Shanghai, China. MKN-45 and MKN-28 cells were collected and resuspended in serum-free medium. The cells were positioned within the upper chamber. For the invasion test (Corning, Shanghai, China), the upper chamber was coated with Matrigel (Cat. No. 356234, BD, New Jersey, USA), and the lower compartment was filled with 10% FBS (Gibco, Shanghai, China). After 24 hours of incubation, the cells that had migrated away from the upper chamber or invaded the Matrigel membrane were fixed by exposure to a 4% paraformaldehyde solution. Then, the cells were dyed with crystal violet from Beyotime (Shanghai, China). Images of stained cells in different regions in each group were taken with a fluorescence microscope (Nikon, Tokyo, Japan). The quantification of stained cells was performed to assess both cell migration and invasion.
Terminal Deoxynucleotidyl Transferase dUTP Nick-end Labeling (TUNEL) Assay
MKN-45 and MKN-28 GC cells were carefully placed within 6-well plates, each well containing a population of 3 × 10⁵ cells/mL. These cells were subsequently subjected to a 24-hour treatment regimen with various concentrations of Rk1. The cells were collected, fixed with 4% paraformaldehyde for 30 min, and then exposed to PBS containing 0.1% Triton X-100 for 5 min at room temperature. This was succeeded by two rounds of thorough rinsing with PBS. Then, 50 µl of TUNEL solution (Cat.No. C1089, Beyotime, Shanghai, China) was added to each well, and the cells were incubated in a lightless environment at 37°C for one hour. DAPI solution (Cat.No. ab228549, Abcam, Cambridge, UK) was used to stain the nuclei for 5 minutes. PBS was used to flush the cells three times. A fluorescence microscope (Nikon, Tokyo, Japan) was then used to track and quantify the number of apoptotic cells, and the percentage of TUNEL-positive cells was subsequently computed.
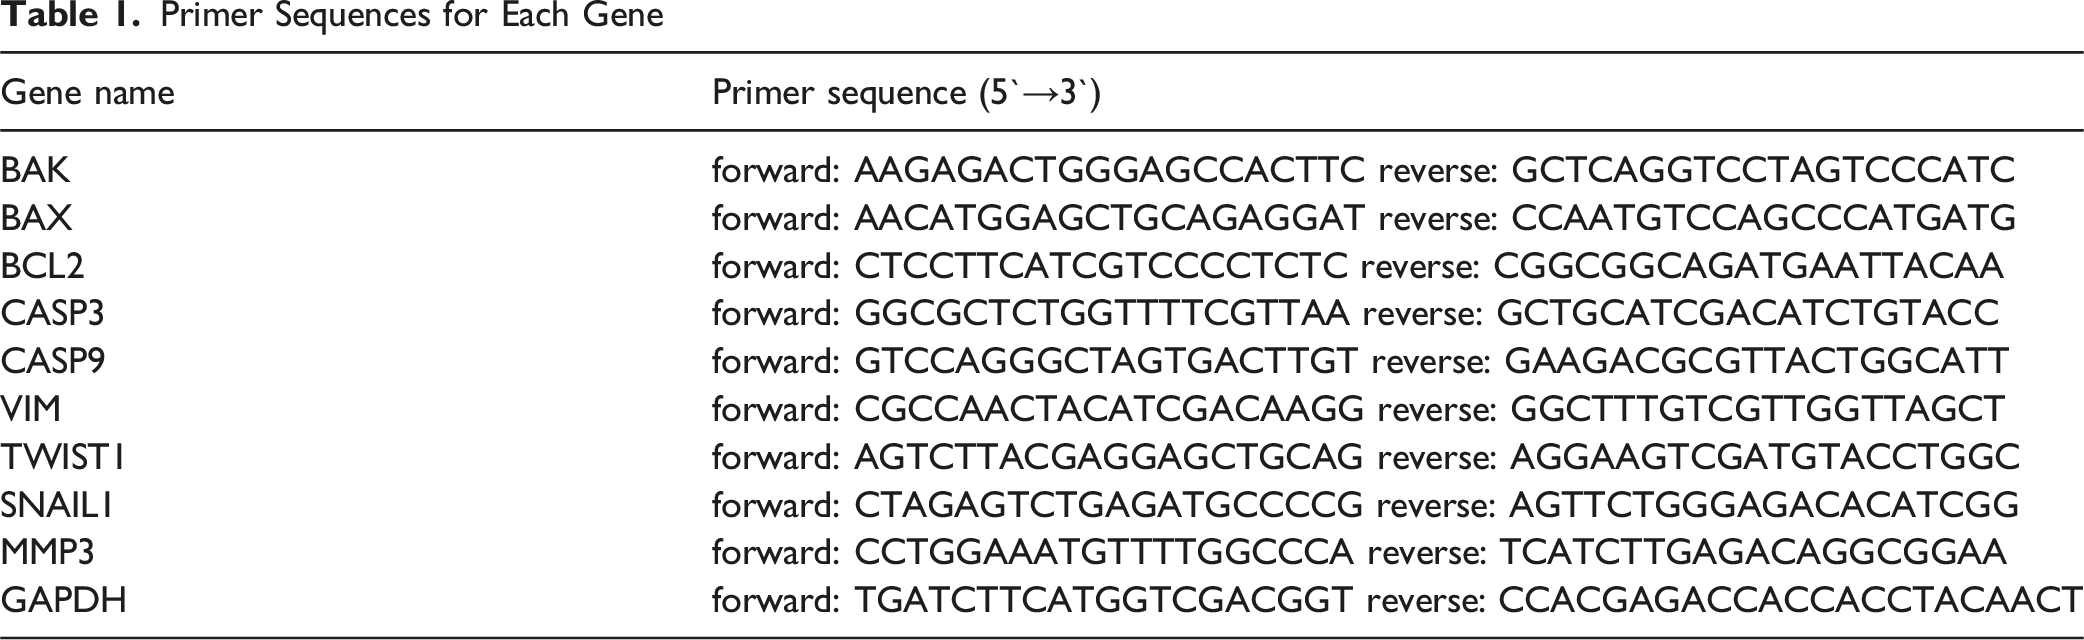
Real-time Reverse transcriptase‒polymerase Chain Reaction (RT‒qPCR)
Primer Sequences for Each Gene
Western Blot
Antibodies Used for Western Blotting

Tumor Formation in Nude Mice
BALB/c-nu nude mice (6-8 weeks of age, body weight: 16-18g) were utilized to construct an in vivo tumor-bearing nude mouse model. MKN-45 cells in the logarithmic growth phase were subjected to digestion with 0.25% trypsin and subsequently collected. After being flushed in serum-free medium, the cells were made into a single-cell suspension (concentration: 3 × 10⁷/mL). Next, 0.1 mL of the cell suspension was introduced via subcutaneous injection into the left forelimb armpit of each nude mouse. When the tumors grew to approximately 100 mm3, the mice were randomly divided into different groups. Rk1 (7.5, 15, 30 mg/kg), cisplatin (5 mg/kg), 19 Rk1 (15 mg/kg)+cisplatin (2.5 mg/kg), oxaliplatin (8 mg/kg), 20 Rk1 (15 mg/kg)+oxaliplatin (4 mg/kg), or an equal volume of control solvent was intraperitoneally injected into the mice three times a week beginning on day 14. The control group was given the same amount of normal saline. The tumor volume was measured once every three days from day 14. At the conclusion of the study, all the animals were euthanized through the inhalation of excess CO2. The subcutaneous tumors were dissected and assessed for size, and their weight was determined. Tumor volume (mm3) = (length × width2)/2. The subcutaneous tumors were collected for immunohistochemistry (IHC). All the experimental procedures were approved by the Animal Experiment Ethics Review Committee of the Institute of Materia Medica within the First Hospital of Nanchang Hospital (No. KY2024029) in November 2024.
IHC
The tissues were conventionally embedded in paraffin, cut into coronal slices with a thickness of 5 μm, and subsequently subjected to immunohistochemical staining. Next, the sections were dewaxed with xylene, hydrated through alcohol gradients and then subjected to a 10-minute exposure to 3% H2O2 to deactivate the endogenous peroxidase. Microwave-based restoration was carried out with 0.01 mol/L sodium citrate buffer at a pH of 6.0 for 15 minutes. Following a 20-minute blocking step with 5% bovine serum albumin (BSA), the sections were subjected to primary antibody incubation (overnight, 4°C). The antibodies used here included an anti-Ki67 antibody (ab15580). The next day, the slices were incubated with a goat anti-rabbit secondary antibody. The abovementioned antibodies were obtained from Abcam (Cambridge, UK). Following an incubation (20 min) at RT, the sections were rinsed in PBS, and diaminobenzidine (DAB) was used for color development. Next, the sections were restrained with hematoxylin, subjected to dehydration, rendered transparent, and sealed. A microscope was used for examination. Image-Pro Plus image analysis software was used to confirm the proportion of positive cells for each protein.
Analysis of Statistics
For analysis, SPSS 20.0 statistical software, produced by SPSS, Inc., Chicago, IL, USA, was used. The measurement statistics are displayed as the mean ± standard deviation (X ± SD). To compare multiple factors, one-way analysis of variance (ANOVA) was carried out, whereas to compare two groups, an independent sample t test was employed. A level of significance was established at P < 0.05, indicating statistical significance.
Results
Rk1 Impedes GC Cell Proliferation
Rk1 (2.5, 5, 10, 20, 40, 80, or 160 µM) was used to treat human gastric epithelial cells (GES-1) to examine the toxic effect of Rk1 (molecular structure shown in Figure 1A) on normal gastric cells. A CCK8 assay was used to measure cell viability, and the results suggested that Rk1 had no significant effect on GES-1 cell viability (P > .05, Figure 1B). Next, we tested the effects of Rk1 on the viability of five GC cell lines, including BGC-823, MKN-28, MKN-45, MGC-803, and SGC-7901. Among those cells, MKN-28 and MKN-45 cells were more sensitive to Rk1, as Rk1 decreased the viability and proliferation of MKN-45 and MKN-28 GC cells when the Rk1 dose reached 20 µM (P < .05, Figure 1C–D). Rk1 Impedes GC Cell proliferation. (A) Molecular Structure of Rk1. Rk1 (2.5, 5, 10, 20, 40, 80, or 160 µM) was Used to Treat the Human Gastric Epithelial Cell Line GES-1. (B) A CCK-8 Assay was Used to Assess GES-1 Cell Viability. (C) Rk1 (5, 10, 20, 40, 80, or 160 µM) was Administered to the GC Cell Lines BGC-823, MKN-28, MKN-45, MGC-803, SGC-7901, and AGS. (D) BrdU Assay was Used to Measure Cell Proliferation. ns P > 0.05, *P < .05, **P < .01, ***P < .001 (vs ctrl Group). N = 3
Rk1 Facilitates GC Cell Apoptosis
To gain a more in-depth understanding of the impact of Rk1 on GCs, we treated MKN-45 and MKN-28 cells with Rk1 at concentrations of 20, 40, 80, and 160 µM. A TUNEL assay was used to evaluate cell apoptosis. Compared with that in the control treatment group, the percentage of TUNEL-positive cells was significantly greater, suggesting that Rk1 increased GC cell apoptosis (P < .05, Figure 2A). RT‒PCR was employed to determine the expression profiles of mRNAs relevant to apoptosis. In contrast to the control group, Rk1 markedly increased the levels of BAK, BAX, CASP3, and CASP9 while decreasing the level of BCL2 (P < .05, as depicted in Figure 2B–C). Rk1 Enhances GC Cell apoptosis. (A) MKN-45 and MKN-28 Cells Were Treated With Rk1 (20, 40, 80, or 160 µM). A TUNEL Assay was Used to Monitor Cell Apoptosis. (B-C) MKN-45 and MKN-28 Cells Were Treated With Rk1 (20, 40, 80, or 160 µM). RT‒PCR Confirmed the Expression of the Apoptosis-Associated Genes BAK, BAX, BCL2, CAPS3, and CASP9. ns P > .05, *P < .05, **P < .01, ***P < .001 (vs ctrl Group). N = 3
Rk1 Restrains GC Cell Migration, Invasion and EMT
MKN-45 and MKN-28 cells were treated with 5 μM Rk1 and 10 μM Rk1, which had no significant effects on the viability of GC cells. The migration and invasion of cells were assessed by a Transwell assay. Compared with the control group, Rk1 significantly inhibited MKN-45 and MKN-28 cell migration and invasion (P < .05, Figure 3A–B). RT-PCR also revealed that, compared with the control group, Rk1 decreased the expression of the interstitial markers TWIST1, SNAIL1, MMP3, and VIM (P < 0.05, Figure 3C–D). These findings revealed that Rk1 inhibited GC cell migration, invasion, and EMT. Rk1 Suppresses the Migration, Invasion, and EMT of GC Cells MKN-45 and MKN-28 Cells Were Treated With Rk1 (5-10 μM). (A-B) Evaluation of Cell Migration and Invasion Through the Transwell Assay. (C-D) RT-PCR was Conducted to Test the mRNA Profiles of SNAIL1, TWIST1, VIM, and MMP3. ns P > 0.05, **P < .01, ***P < .001 (vs Ctrl Group). N = 3
Rk1 Enhances GC Cell Sensitivity to Chemotherapeutic Drugs
GC cells were treated with 5-FU, cisplatin (CDDP), vincristine, or oxaliplatin with or without Rk1 (20 µM, 40 µM). A CCK8 assay was used to assess cell viability. As shown by the data, 5-FU inhibited the viability of MKN-45 and MKN-28 cells in a dose-dependent manner (Figure 4A–B). The addition of Rk1 further attenuated cell viability (Figure 4A–B). Similarly, Rk1 also increased the cell viability decline of MKN-45 and MKN-28 cells under CDDP (Figure 4C–D), vincristine (Figure 4E–F), and oxaliplatin (Figure 4E–F) administration. These findings indicate that Rk1 enhances the chemical sensitivity of GC cells to 5-FU, cisplatin, vincristine, and oxaliplatin. The Effects of Rk1 on the Sensitivity of GC Cells to Chemotherapeutic Drugs. GC Cells (MKN-45 and MKN-28) Were Treated With Varying Doses of 5-FU (0, 10, 20, 40, 80, 120, 160, or 200 µg/mL), Cisplatin (0, 1, 2.5, 5, 10, 15, 20, or 25 µg/mL), Vincristine (0, 0.5, 1, 2, 4, 8, 12, or 16 µg/mL), or Oxaliplatin (0, 10, 20, 40, 80, 120, 160, or 200 µg/mL), or Rk1 (20-40 µM) for 24 Hours. (A-H) Cell Viability was Determined via a CCK8 Assay. ns P > .05, *P < .05, **P < .01, ***P < .001 (vs ctrl Group). N = 3
Rk1 Activates the AMPK/mTOR Pathway
Further investigations were carried out to determine the exact mechanism by which Rk1 suppresses GC. As revealed by western blot analysis, Rk1 promoted AMPK phosphorylation in a concentration-dependent manner and inhibited phosphorylated mTOR expression (P < .05, Figure 5B–C). These findings demonstrated that Rk1 activated the AMPK pathway in GC cells. Rk1 Affects the Activation of the AMPK/mTOR Pathway. MKN-45 and MKN-28 Cells Were Treated With Rk1 (5, 10, 20, 40 µM). (A-B) Detection of AMPK/mTOR Profiles in MKN-45 and MKN-28 Cells Through Western Blotting. ns P > .05, *P < .05, **P < .01, ***P < .001 (vs ctrl Group). N = 3
AMPK Inhibition Markedly Attenuates the Inhibitory Effects of Rk1 on GC Proliferation, Migration, and Invasion
MKN-45 and MKN-28 cells were treated with 5 µM CC to restrain the AMPK pathway, thus revealing the influence of AMPK inhibition on the cancer-suppressing function of Rk1. Compared with the control, Rk1 vigorously inhibited MKN-45 and MKN-28 cell viability and proliferation, whereas the inhibition of AMPK diminished the suppressive effect of Rk1 on proliferation (P < .05, Figure 6A–C). Cell apoptosis was examined via a TUNEL assay. Compared with the control, Rk1 markedly increased cell apoptosis. The inhibition of the AMPK pathway by CC markedly reduced apoptosis (P < .05, as illustrated in Figure 6D–E). The Effects of AMPK Inhibition on the Inhibitory Effects of Rk1 on GC Cells. MKN-45 and MKN-28 Cells Were Treated With Rk1 (80 µM) or 5 µM CC (an AMPK Inhibitor) to Restrain AMPK Expression. (A-C) CCK-8 and BrdU Assays Were Used to Assess GC Cell Viability and Proliferation. D-E: A TUNEL Assay was Used to Assess MKN-45 and MKN-28 Cell Apoptosis. **P < .01, ***P < .001 (vs ctrl Group), &P < .05, &&P < .01, &&&P < 0.001 (vs Rk1 Group). N = 3
Rk1 and Cisplatin/Oxaliplatin had Synergistic Effects on GC Growth
To investigate the inhibitory impact of Rk1 on GC, we performed an in vivo tumor formation experiment in nude mice. The mice were treated with Rk1, CDPP, Rk1 + CDDP, oxaliplatin (Oxa), or Rk1 + Oxa at different concentrations. Rk1 significantly inhibited GC cell growth when its dose reached 15 mg/kg (Figure 7A–C). Moreover, both CDDP and Oxa inhibited tumor growth (Figures 7D and G) and decreased both tumor volume and weight (Figure 7E–F, 7H–I, P < .05). The combination of Rk1 and CDDP/Oxa had enhanced inhibitory effects on tumor volume and weight (Figure 7D–I). IHC staining revealed that Rk1, CDDP, and Oxa decreased the percentage of Ki-67-positive cells (P < .05, Figure 7J–L). The Rk1 + CDDP group and Rk1 + Oxa group presented a further reduction in the percentage of Ki-67-positive cells (P < .05 vs the CDDP group or the Oxa group; Figure 7J–L). Furthermore, western blot analysis confirmed that Rk1, CDDP, and Oxa treatment facilitated AMPK phosphorylation and inhibited mTOR phosphorylation, and their combination significantly affected the AMPK/mTOR pathway (P < .05, Figure 7M–O). Rk1 Suppresses GC Cell Growth in vivo. A Xenograft Tumor Model was Constructed in Nude Mice Using MKN45 Cells. (A-C) The Mice Were Administered Rk1 (7.5-30 mg/kg). The Tumor Volume and Weight Were Calculated. (D-F) The Mice Were Administered Rk1 (30 mg/kg), CDDP (5 mg/kg), or Rk1 (15 mg/kg)+CDDP (2.5 mg/kg). The Tumor Volume and Weight Were Calculated. (G-I) The Mice Were Administered Rk1 (30 mg/kg), Oxa (8 mg/kg), or Rk1 (15 mg/kg)+Oxa (4 mg/kg). The Tumor Volume and Weight Were Calculated. (J-L) IHC Staining was Used to Verify the Expression of Ki67. Scale bar: 50 μm. (M-O) The AMPK/mTOR Axis was Detected Through Western Blotting. *P < .05, **P < 0.01, ***P < 0.001. N = 5
Discussion
Despite unceasing research on the treatment of GC and its drug resistance, an increasing number of drugs have been discovered for GC therapy. Here, we revealed that Rk1 dampened the malignant biological behaviors of GC. Our experiments also revealed that Rk1 modulated the AMPK/mTOR pathway to facilitate cell apoptosis, suppress the development of GC, and promote the sensitivity of GC cells to chemotherapy drugs. These findings are critical for investigating novel targets for GC treatment.
Increasing evidence has demonstrated that natural products significantly affect GC treatment.21-23 Extracts and active compounds from Panax ginseng have shown promising GC antitumor effects.14,15 For example, ginsenoside Rg3, one of the main active ingredients isolated from processed ginseng, can significantly suppress proliferation and mediate apoptosis and cell cycle arrest in GC. 24 Rg3 administration markedly attenuated cisplatin resistance and cell migration by suppressing the PI3K/Akt/mTOR signaling pathway on GC cells with cisplatin resistance. 25 Interestingly, Rg3 can improve gastric precancerous lesions (GPLs) through mitigating gastric intestinal metaplasia and gastric dysplasia. 26 With anti-inflammatory and liver-protective functions,27,28 Rk1 also regulates the endogenous apoptotic pathway in hepatoma carcinoma cells. 29 Additionally, Rk1 inhibited the growth of lung cancer cells but had few toxic side effects on normal organs. Rk1 also suppresses PD-L1 and NF-κB signaling in lung cancer cells. 30 These studies suggest that ginsenosides potentially cooperate with immunotherapy drugs against cancer. 31 Consistently, our research revealed that Rk1 is involved in GC development. Cell experiments revealed that Rk1 strongly inhibited GC activity, migration, and invasion; promoted GC cell apoptosis; and repressed EMT. In vivo experiments revealed that Rk1 conspicuously dampened tumor growth, which offered new insights for drug research.
Acquired drug resistance is a primary barrier to treating tumors with chemotherapy drugs. 32 At present, chemotherapy based on cisplatin is the standard therapy for GC patients. However, studies on chemoresistance have demonstrated that the therapeutic efficacy of platinum-based cytotoxic chemotherapy strategies is limited, and drug resistance, which is usually coupled with disease recurrence, culminates in failure of GC treatment.33-35 Reportedly, the mechanism of GC drug resistance induced by cisplatin is sophisticated. Therefore, we need to identify pivotal genes and investigate the molecular pathways involved in GC development and chemoresistance, which is indispensable for developing therapeutic intervention schemes targeting GC. Our study also revealed that Rk1 enhanced the sensitivity of GC cells to chemical drugs, including 5-FU, cisplatin, vincristine, and oxaliplatin. These findings confirmed that Rk1 mitigated cisplatin resistance in GC cells and is a potential adjuvant therapeutic drug for the treatment of GC.
The cellular energy transducer protein kinase AMP-activated catalytic subunit alpha 1 (AMPK) is conserved across all eukaryotic cell types. Phosphorylation can govern the functions of several critical metabolic enzymes.36,37 Mechanistic target of rapamycin (mTOR), a serine‒threonine kinase, is a crucial constituent of mTOR complexes 1 and 2 (mTORC1/2). It monitors growth and many other stimuli and thus functions significantly in modulating cell growth, proliferation, and survival. 38 According to recent reports, anomalous activation of the AMPK/mTOR pathway is implicated in the progression of numerous malignancies, including but not limited to non-small cell lung cancer, 39 breast cancer, 40 and thyroid cancer. 41 Similarly, TIPRL regulates this pathway to suppress GC migration and invasion. 42 AMPK/mTOR pathway regulation can increase GC cell chemoresistance. 43 Interestingly, Rk1 has also been shown to affect the AMPK pathway.17,44 Here, we investigated the exact molecular mechanism by which Rk1 influences GC progression. We revealed that Rk1 increased AMPK phosphorylation and decreased p-mTOR expression, whereas AMPK inhibition reversed the inhibitory effects of Rk1 on GC cell proliferation, migration, and invasion and attenuated the positive impact of Rk1 on GC cell apoptosis. Thus, our study highlights a novel mechanism by which Rk1 affects GC through the AMPK/mTOR signaling pathway.
Conclusion
Overall, our research demonstrated that Rk1 has a prominent antitumor effect on GC cells. Rk1 also attenuates GC resistance to chemotherapeutic drugs. Moreover, Rk1 plays a role in GC by activating the AMPK/mTOR pathway. Our work provides a scientific foundation for the therapeutic use of Rk1 in GC. Nevertheless, more in vivo experiments are needed to determine the exact mechanism by which Rk1 in combination with chemotherapeutic drugs affects GC treatment in the future.
Supplemental Material
Supplemental Material - Ginsenoside Rk1 Enhances Chemosensitivity of Gastric Cancer Through Activating the AMPK/mTOR Pathway
Supplemental Material for Ginsenoside Rk1 Enhances Chemosensitivity of Gastric Cancer Through Activating the AMPK/mTOR Pathway by Yaqin Huang, Jian Wu, Huang, Li, Gen Huang, Bin Li, Lihong Gan, and Ling Yao in Dose-Response
Footnotes
Ethical Statement
Our study was approved by the Ethics Committee of The First Hospital of Nanchang (Approval No. KY2024029) in November 2024.
Authors’ Contributions
Conceived and designed the experiments: Yaqin Huang, Jian Wu, Ling Yao;
Performed the experiments: Yaqin Huang, Jian Wu, Li Zheng, Gen Huang, Lihong Gan
Statistical analysis: Ling Yao, Li Zheng, Gen Huang, Bin Li;
Wrote the paper: Yaqin Huang, Jian Wu, Ling Yao.
All the authors have read and approved the final manuscript.
Funding
The authors disclosed receipt of the following financial support for the research, authorship, and/or publication of this article: This research was supported by the Science and Technology Plan Project of Jiangxi Provincial Health Commission (Grant. No. 202211563).
Declaration of Conflicting Interests
The authors declared no potential conflicts of interest with respect to the research, authorship, and/or publication of this article.
Data Availability Statement
The data used and analyzed during the current study are available from the corresponding author upon reasonable request.
Supplemental Material
Supplemental material for this article is available online.
References
Supplementary Material
Please find the following supplemental material available below.
For Open Access articles published under a Creative Commons License, all supplemental material carries the same license as the article it is associated with.
For non-Open Access articles published, all supplemental material carries a non-exclusive license, and permission requests for re-use of supplemental material or any part of supplemental material shall be sent directly to the copyright owner as specified in the copyright notice associated with the article.