
Abstract

Introduction
Hypertension is a prevalent global health issue and a significant risk factor for chronic kidney disease (CKD), contributing to renal injury through mechanisms such as oxidative stress, inflammation, and aberrant cell death. 1 Among the various forms of regulated cell death, ferroptosis, an iron-dependent process characterized by lipid peroxidation, has recently emerged as a critical player in the pathogenesis of hypertensive nephropathy. 2 Ferroptosis is driven by the accumulation of reactive oxygen species (ROS) and depletion of glutathione (GSH), leading to cellular damage and organ dysfunction. 3 Current treatments, including ACE inhibitors (ACEIs) and angiotensin II receptor blockers (ARBs), protect the kidneys by lowering the intraglomerular pressure and reducing proteinuria. 4 However, these therapies do not completely halt the progression of kidney injury in all patients, particularly in the more advanced stages of the disease. Therefore, targeting ferroptosis has gained attention as a potential therapeutic strategy for mitigating renal injury in hypertension.
Traditional Chinese Medicine (TCM), which emphasizes holistic treatment and multi-target mechanisms, has shown promise in alleviating hypertensive kidney injury by improving renal hemodynamics, reducing oxidative stress, and modulating inflammatory pathways. 5 Among the bioactive compounds derived from TCM, apigenin (API), a natural flavonoid found in herbs such as Apium graveolens (celery) and Chrysanthemum morifolium, has garnered attention for its potential renoprotective effects. API, a naturally occurring flavonoid found in numerous fruits and vegetables, has demonstrated anti-inflammatory, antioxidant, and anti-apoptotic properties in various disease models. 6 Recent studies suggest that API may also modulate cell survival pathways, including the phosphoinositide 3-kinase/protein kinase B (PI3K/Akt) signaling cascade, which plays a pivotal role in cellular homeostasis and protection against oxidative stress. 7 Activation of the PI3K/Akt pathway suppresses ferroptosis by enhancing antioxidant enzyme expression and reducing lipid peroxidation. 8 However, the ability of API to inhibit ferroptosis and alleviate renal injury under hypertensive conditions remains unexplored. Therefore, this study aimed to explore the potential effects of API on renal injury under hypertensive conditions and the underlying mechanisms.
Materials and Methods
Animals
Male C57BL/6 mice (8-10 weeks old, weighing 22-24 g) were procured from the SLAC Laboratory Animal Co., Ltd (Shanghai, China). These mice were housed in a specific pathogen-free environment characterized by regulated humidity (50%-60%), temperature (22 °C–24°C), and a 12-hour light-dark cycle, with ad libitum access to food and water. The animal study followed the Guide for the Care and Use of Laboratory Animals (NIH Publication No. 85-23, revised 1996), and the Animal Care and Use Committee of our hospital approved the protocol.
Mouse Model of Hypertensive Nephropathy
A total of 24 C57BL/6 mice were randomly assigned to three groups: Control, Ang II, and Ang II + API (8 mice in each group). The mice in the Ang II and API groups were administered Ang II (2.0 mg/kg/day) via osmotic mini-pumps subcutaneously for 28 consecutive days. 9 The mice in the control group received an equivalent volume of saline via subcutaneous infusion. Additionally, two hours before Ang II infusion, the mice in the API group were intraperitoneally injected with API (Apigenin, 20 mg/kg/day, HY-N1201, MedChemExpress) once daily for 28 continuous days, 10 while the mice in the control and Ang II groups received an intraperitoneal injection of the same volume of saline.
Measurement of Blood Pressure
Blood pressure was assessed using the tail-cuff technique (ALC-NIBP; Shanghai Alcott Biotech Co., Shanghai, China). Both systolic (SBP) and diastolic (DBP) were evaluated on the day preceding the trial and 7, 14, 21, and 28 days following Ang II administration, with the average of SBP and DBP derived from three separate readings. 11 The mean arterial pressure (MAP) was determined using the following calculation: MAP = (SBP + DBP×2)/3.
Body Weight Measurement
At 28 days after Ang II infusion, mice were weighed after 12 hours of fasting. Then, the mice were euthanization, and the kidney was isolated and weighed. The renal hypertrophy index was calculated following this formula: renal hypertrophy index (mg/g) = kidney weight (mg)/body weight (g).
Liver and Renal Function
Blood samples were collected via the tail vein 28 days after Ang II infusion and the serum was separated. Serum alanine aminotransferase (ALT; C009-2-1, Nanjing Jiancheng Bioengineering Institute, Nanjing, China) and aspartate aminotransferase (AST; C010-2-1, Nanjing Jiancheng Bioengineering Institute, Nanjing, China) levels were measured using standard enzymatic procedures, according to the manufacturer’s instructions. An automatic biochemical analyzer was used to determine the serum creatinine (Scr) and blood urea nitrogen (BUN) levels. Serum cystatin C (Cys-C) concentration was determined using a trusted ELISA kit (MSCTC0, R&D Systems).
Histology
Hematoxylin/eosin (HE) staining was employed to assess the extent of renal fibrosis. Kidney tissue for paraffin sections was routinely processed for paraffin embedding and subsequently fixed overnight in 4% paraformaldehyde. Subsequently, sections were sliced to a thickness of 4 μm and promptly mounted on organosilane-coated slides. The tissues were post-fixed using 4% paraformaldehyde overnight. This was followed by a 24-hour incubation in pH-adjusted PBS containing 10% sucrose with three different buffers. Post-incubation, the sections underwent HE staining after rehydration and deparaffinization in xylene. The stained slides were examined under a light microscope. The quantification of fibrosis was determined by calculating the ratio of the fibrotic area to the total area as follows:

Cell Culture
Conditionally immortalized mouse podocytes (MPC5) were acquired from the Peking Union Medical College Cell Resource Center (PUMC). MPC5 podocytes were treated with recombinant interferon-gamma (IFN-γ) to promote proliferation and differentiation at 33°C in DMEM supplemented with 10% FBS within a 5% CO2 incubator. After passage, the cells were treated with DMEM medium with 10% FBS but no IFN-γ and were incubated in a 5% CO2 incubator at 37°C to facilitate further maturation and specialization or functionality.
Experimental Grouping
MPC5 podocytes were randomly divided into four groups: (1) Control group with saline treatment (an equal volume of Ang II); (2) API group with single API treatment (20 μM); (3) Ang II group with single treatment of Ang II (1 μM); (4) Ang II + API group with cotreatment of Ang II and API. The cells were then incubated at 37°C for 24 h. Cells were incubated with the PI3K/Akt pathway inhibitor LY294002 (10 μM; HY-10108, MedChemExpress) for the pathway inhibition experiment. 12
MTT Assay
Cells were seeded in 96-well plates at a density of 1 × 10^3 cells per well and then incubated with or without an inhibitor. After 48 h, the cells were exposed to 20 µL MTT (M1020, Solarbio, Beijing, China) and incubated for 4 h at 37°C. The absorbance at 570 nm was measured after adding 200 µL of DMSO to determine the number of cells.
Cell Apoptosis Assay
In accordance with previous study methods, 13 cell apoptosis was identified using the Annexin V-FITC Apoptosis Detection Kit (CA1020, Beijing Solarbio Science & Technology Co., Ltd., China). Cells were detached using trypsin-EDTA and collected by centrifugation. After washing with PBS saline, the cells were suspended in the binding buffer and centrifuged at 300×g for 10 min. After removing the supernatant, the cells were resuspended in a binding buffer at 1 × 10^6 cells/mL concentration. Subsequently, PI (5 μL) was added to the cells and incubated for 5 min under the same conditions. Apoptosis was assessed using a flow cytometer (Beckman Coulter, Inc., Brea, CA, USA).
Immunofluorescence
Immunofluorescence was performed using a previously published protocol. 14 Briefly, after three rinses with PBS, MPC5 podocytes were stained with Mito FerroGreen (HY-D2295; 1:1000; MedChemExpress, Shanghai, China) and incubated for 30 min at 37°C in the dark. The cells were then washed with PBS to remove excess dye. Dihydroethidium (DHE) (S0063; 1:10; Beyotime, Shanghai, China) was administered to MPC5 podocytes and incubated for a further 30 min at 37°C in the dark. After incubation, the cells were washed with PBS to remove excess dye. Subsequently, the cellular samples were stained with DAPI (62248; 1 µg/mL; ThermoFisher Scientific, Shanghai, China) and incubated for 5-10 minutes at room temperature in the dark. The cells were then washed with PBS to remove excess DAPI. Stained cells were examined under an inverted microscope (IX51, Olympus, Japan) at ×200 magnification.
Measurement of ROS Production
Reactive oxygen species (ROS) production was investigated by dihydroethidium (DHE) staining. For in vitro experiments, MPC5 cells were seeded in a glass-bottom cell culture dish and incubated with DHE (S0063, Beyotime) for 1 h at 37°C, followed by DAPI staining. The cells were then washed with PBS and examined under a fluorescence microscope.
Measurement of Oxidative Stress
We obtained cell lysates of podocytes and stored them at −80°C in a refrigerator. We used a commercial kit to measure malondialdehyde (MDA), superoxide dismutase (SOD), catalase (CAT), and glutathione peroxidase (GSH-Px) activities (S0131S, S0109, S0051, and S0056, Beyotime, Shanghai, China). We followed a previously published protocol to estimate the amount of oxidative stress. 15
Quantitative Reverse Transcription Polymerase Chain Reaction (RT-qPCR)
List of Oligonucleotide Primer Sequences Used in This Study.

Western Blotting
Protein samples were acquired after cellular breakdown using RIPA lysis buffer (Beyotime Biotechnology, Shanghai, China). A BCA kit (Beyotime) was used to determine protein concentration, followed by the addition of an equal volume of protein (40 μg), which was then combined with loading buffer (Beyotime) and subjected to denaturation in a boiling water bath for 3 min. Upon the arrival of bromophenol blue in the separation gel, electrophoresis was performed at 80 V for 30 min, followed by a subsequent period of 1-2 h at 120 V. Proteins were transferred onto membranes in an ice bath at 300 mA for 60 min. After rinsing the membranes for 1-2 min with a washing solution, they were either inactivated for 1 h at room temperature or sealed overnight at 4°C. Membranes were incubated with primary antibodies against p-PI3K (Tyr458) (1:500, ab278545, rabbit monoclonal, Abcam), PI3K (1:500, ab302958, rabbit monoclonal, Abcam), p-Akt (Ser473) (1:500, ab81283, rabbit monoclonal, Abcam), Akt (1:500, ab8805, rabbit polyclonal, Abcam), GPX4 (1:500, sc-166570, mouse monoclonal, Santa Cruz), SLC7A11 (1:500, ab175186, rabbit monoclonal, Abcam), ACSL4 (1:500, ab205199, rabbit monoclonal, Abcam), and GAPDH (1:2000, ab9485, rabbit polyclonal, Abcam) on a shaking table for 1 h at room temperature. The membranes underwent a series of washing steps using a washing solution thrice within a 10-minute before and after 1 h of exposure to the secondary antibody at ambient temperature. Subsequently, the membranes were introduced into the developing solution, and observations were performed using chemiluminescence imaging analysis equipment (Gel Doc XR, Bio-Rad).
Statistical Analysis
All data are expressed as the mean ± standard deviation (SD) of at least three distinct experiments. Statistical analyses were performed using GraphPad Prism software version 9.0. Two-tailed unpaired Student’s t-tests were performed to evaluate statistical differences between the two groups. One-way ANOVA was used to analyze the differences between three or more groups, and post hoc comparisons among groups were performed using the least significant difference (LSD) method. Statistical one-tailed significance was defined as #/*P < .05, ##P < .01, ###/***/ $$$ P < .001.
Results
API Shows No Liver and Kidney Toxicity and Lowers Blood Pressure in Ang II-Induced Mice
To investigate the adverse effects of API, mice were intraperitoneally injected with saline and API (20 mg/kg/day) for 28 consecutive days, and hepatic and renal tissues were stained with hematoxylin and eosin (HE). The results showed no adverse effects of API on the hepatic and renal tissues (Figure 1B). Moreover, hepatic and renal functions were evaluated by measuring related indicators in the serum of mice, including alanine aminotransferase (ALT), aspartate aminotransferase (AST), creatinine, and blood urea nitrogen (BUN), using an enzymatic assay. We did not observe any adverse effects of API on the ALT, AST, creatinine, and BUN (Figure 1C and D). API Shows No Liver and Kidney Toxicity and Reduces Blood Pressure in Ang II-Infused Mice. (A) Chemical Structure, Molecular Weight, and Chemical Formula of API. (B) The Hepatic and Renal Tissues Were Stained With Hematoxylin and Eosin (HE) (200×). (C, D) Hepatic and Renal Function Were Evaluated by Measuring Related Indicators in Serum of Mice, including ALT, AST, Scr and BUN. (E) Systolic Blood Pressure. (F) Diastolic Blood Pressure. (G) Mean Artery Blood Pressure. Data Are Presented as Mean ± SD (n = 8 in Each Group), and Analyzed Using ANOVA. ***P < .001 vs Control Group; #P < .05, ##P < .01,, ###P < 0.001 vs Ang II Group. API, Apigenin; ALT, Alanine Transaminase; AST, Aspartate Transaminase; Scr, Serum Creatinine; BUN, Blood Urea Nitrogen; Ang II, Angiotensin II; SBP, Systolic Blood Pressure; DBP, Diastolic Blood Pressure, MAP, Mean Arterial Pressure.
To examine the in vivo systemic toxicity of API, mice were subcutaneously infused with Ang II (2.0 mg/kg/day) and intraperitoneally injected with API (20 mg/kg/day) for 28 days, and the control mice were subcutaneously infused with the same volume of saline. Blood pressure was measured using the tail-cuff technique, and the results indicated that Ang II infusion led to an elevation in systolic blood pressure (SBP), diastolic blood pressure (DBP), and mean arterial blood pressure (MAP) in mice. However, treatment with Ang II + API reduced these values (Figure 1E–G).
API Improves the Renal Hypertrophy Index and Renal Function in Ang II-Induced Mice
This study examined of API impact on both the renal hypertrophy index and renal function. Murine subjects received subcutaneous administration of Ang II at a dose of 2.0 mg/kg/day or equivalent saline through osmotic mini-pumps over 28 days. Additionally, the mice were intraperitoneally administered API at a dose of 20 mg/kg/day or equivalent saline two hours before the commencement of Ang II infusion. The results showed that Ang II infusion decreased body weight (BW) and increased kidney weight (KW) and the renal hypertrophy index (KW/BW). However, treatment with Ang II + API reversed these effects (kidney weight, P < .01; body weight, P < .001) (Figure 2A–C). Histological analysis of renal tissues showed that Ang II + API treatment improved renal function in mice (Figure 2D). Moreover, Ang II + API treatment significantly inhibited serum creatinine (Scr), blood urea nitrogen (BUN), and serum cystatin C (Cys-C) levels (all, P < .001), which were increased by Ang II-induced (Figure 2E–G). These findings suggest that API treatment improves the hypertrophy index and renal function of mice infused with Ang II. API Improves the Morphological Changes, Renal Hypertrophy Index and Renal Function of Ang II-Infused Mice. (A) The Renal Tissues of Mice Were Stained With HE (400×). (B) Body Weight (BW) of Mice. (C) Kidney Weight (KW) of Mice. (D) Renal Hypertrophy Index (KW/BW) of Mice. (E) Serum Creatinine (Scr). (F) Blood Urea Nitrogen (BUN). (G) Serum Cystatin C (Cys-C). Data Are Presented as Mean ± SD (n = 8 in Each Group). ***P < . 001 vs Control group;##P < .01, ###P < .001 vs Ang II Group.
API Suppresses Renal Fibrosis and Inhibits the Expression of Fibrosis-Related Genes in Ang II-Infused Mice
To study the impact of API on Ang II-induced renal fibrosis and molecule expression, mice were subcutaneously infused with Ang II (2.0 mg/kg/day) and intraperitoneally injected with API (20 mg/kg/day) or the same volume of saline two hours before the start of Ang II infusion. We performed paraffin-embedded kidney tissues and stained them with Masson trichrome. The results indicated that Ang II significantly increased the renal fibrotic area, whereas Ang II + API remarkably attenuated this effect (Figure 3AandB). RT-qPCR was performed to measure mRNA expression of several fibrotic markers including Collagen I (COL1A1), Collagen IV (COL4A1), Fibronectin, Transforming growth factor beta 1 (TGF-β1), and α-smooth muscle actin (α-SMA). The results demonstrated that Ang II + API inhibited the expression of Collagen I, Collagen IV, Fibronectin, TGF-β1, and α-SMA (all, P < .001) (Figure 3C–G). API Suppresses Renal Fibrosis and Modulates the Expression of Fibrosis-Related Genes in Ang II-Infused Mice. (A) Paraffin-Embedded Kidney Tissues Were Stained With Masson Trichrome (200×). (B) Quantitative Analysis of the Extent of Renal Fibrosis by Calculating the Percentage of Masson Collagen Area. RT-qPCR was Performed to Determine the mRNA Expression of Fibrosis-Related Genes: (C) Collagen I (COL1A1), (D) Collagen IV (COL4A1), (E) Fibronectin, (F) TGF-β1, and (G) α-SMA. Data Are Presented as Mean ± SD (n = 8 in Each Group). ***P < .001 vs Control Group; ###P < .001 vs Ang II Group. TGF-β1, Transforming Growth Factor-β1; α-SMA, α-smooth Muscle Actin.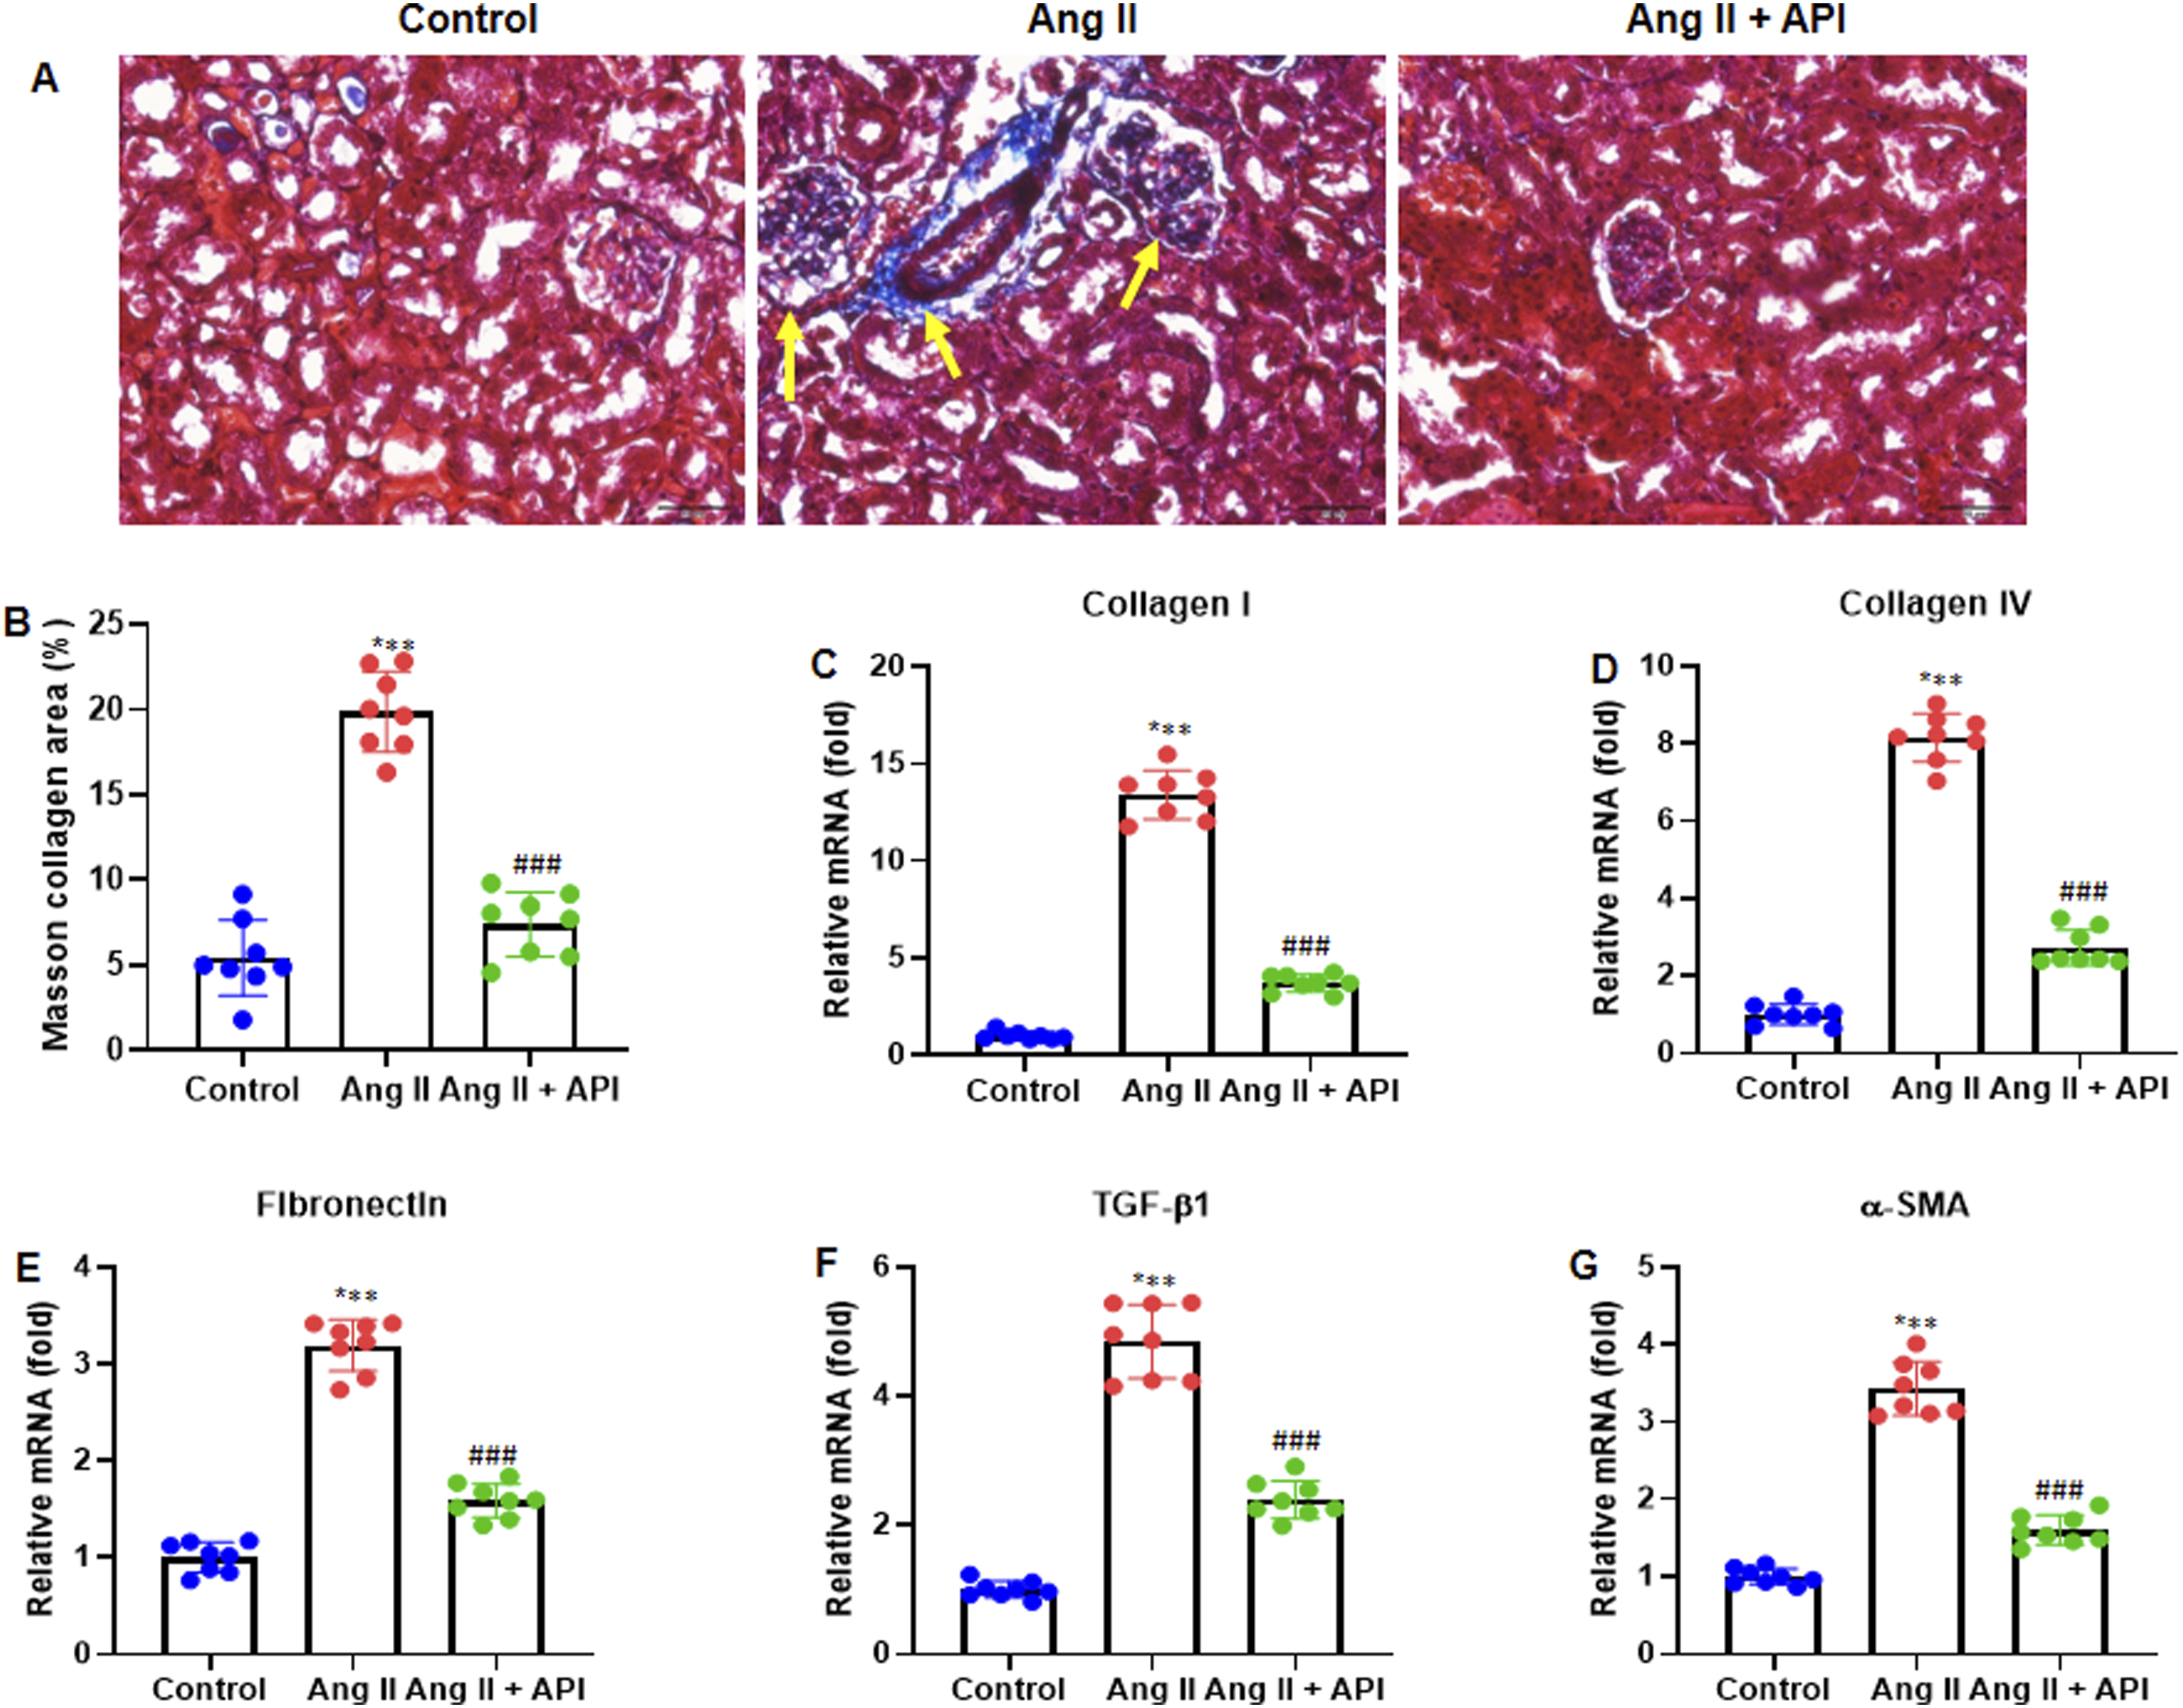
API Reduces Ang II-Induced Podocyte Injury and Modulates the PI3K/Akt Pathway
This study aimed to examine the possible effects of API on Ang II-induced podocyte injury. Mouse podocyte cell 5 (MPC5) was treated with different concentrations of API (0, 1, 5, 10, 20, and 50 μM) for 4 h, and MTT assay was performed to measure cell viability. The results showed that, with increasing API dose, the cell viability rate gradually decreased (Figure 4A). MPC5 cells were pretreated with API (1, 5, 10, and 20 μM) for 2 h, followed by incubation with Ang II (1 μM) for 24 h. The MTT assay was used to measure the cell viability. We observed that an increase in API dose improved the cell viability rate (Figure 4B). In addition, to investigate PI3K/Akt pathway protein expression, MPC5 cells were pretreated with API (20 μM) for 2 h, followed by incubation with Ang II (1 μM) for a further 24 h and analyzed by western blotting. The results indicated that the Ang II + API group showed improved the p-P13 K and p-Akt protein expression, while decreasing them in the Ang II group (Figure 4C). After quantifying the protein bands of p-PI3K (normalized to total PI3K protein) and p-Akt (normalized to total Akt protein), we observed the same consistent expression pattern (Figure 4D). API Attenuates Ang II-Induced Podocyte Injury and Modulates PI3K/Akt Pathway. (A) Cell Viability was Measured Using an MTT Assay. (B) MPC5 Cell Viability was Measured Using an MTT Assay. (C) Representative Gel Blots of PI3K/Akt Pathway Proteins by Western Blotting. (D, E) Quantification of Protein Bands of p-PI3K (Normalized to Total PI3K Protein) and p-Akt (Normalized to Total Akt Protein). Data Are Presented as Mean ± SD (n = 6 in Each Group). ***P < .001 vs Control Group; #P < .05 vs Ang II Group; ###P < .001 vs Ang II Group.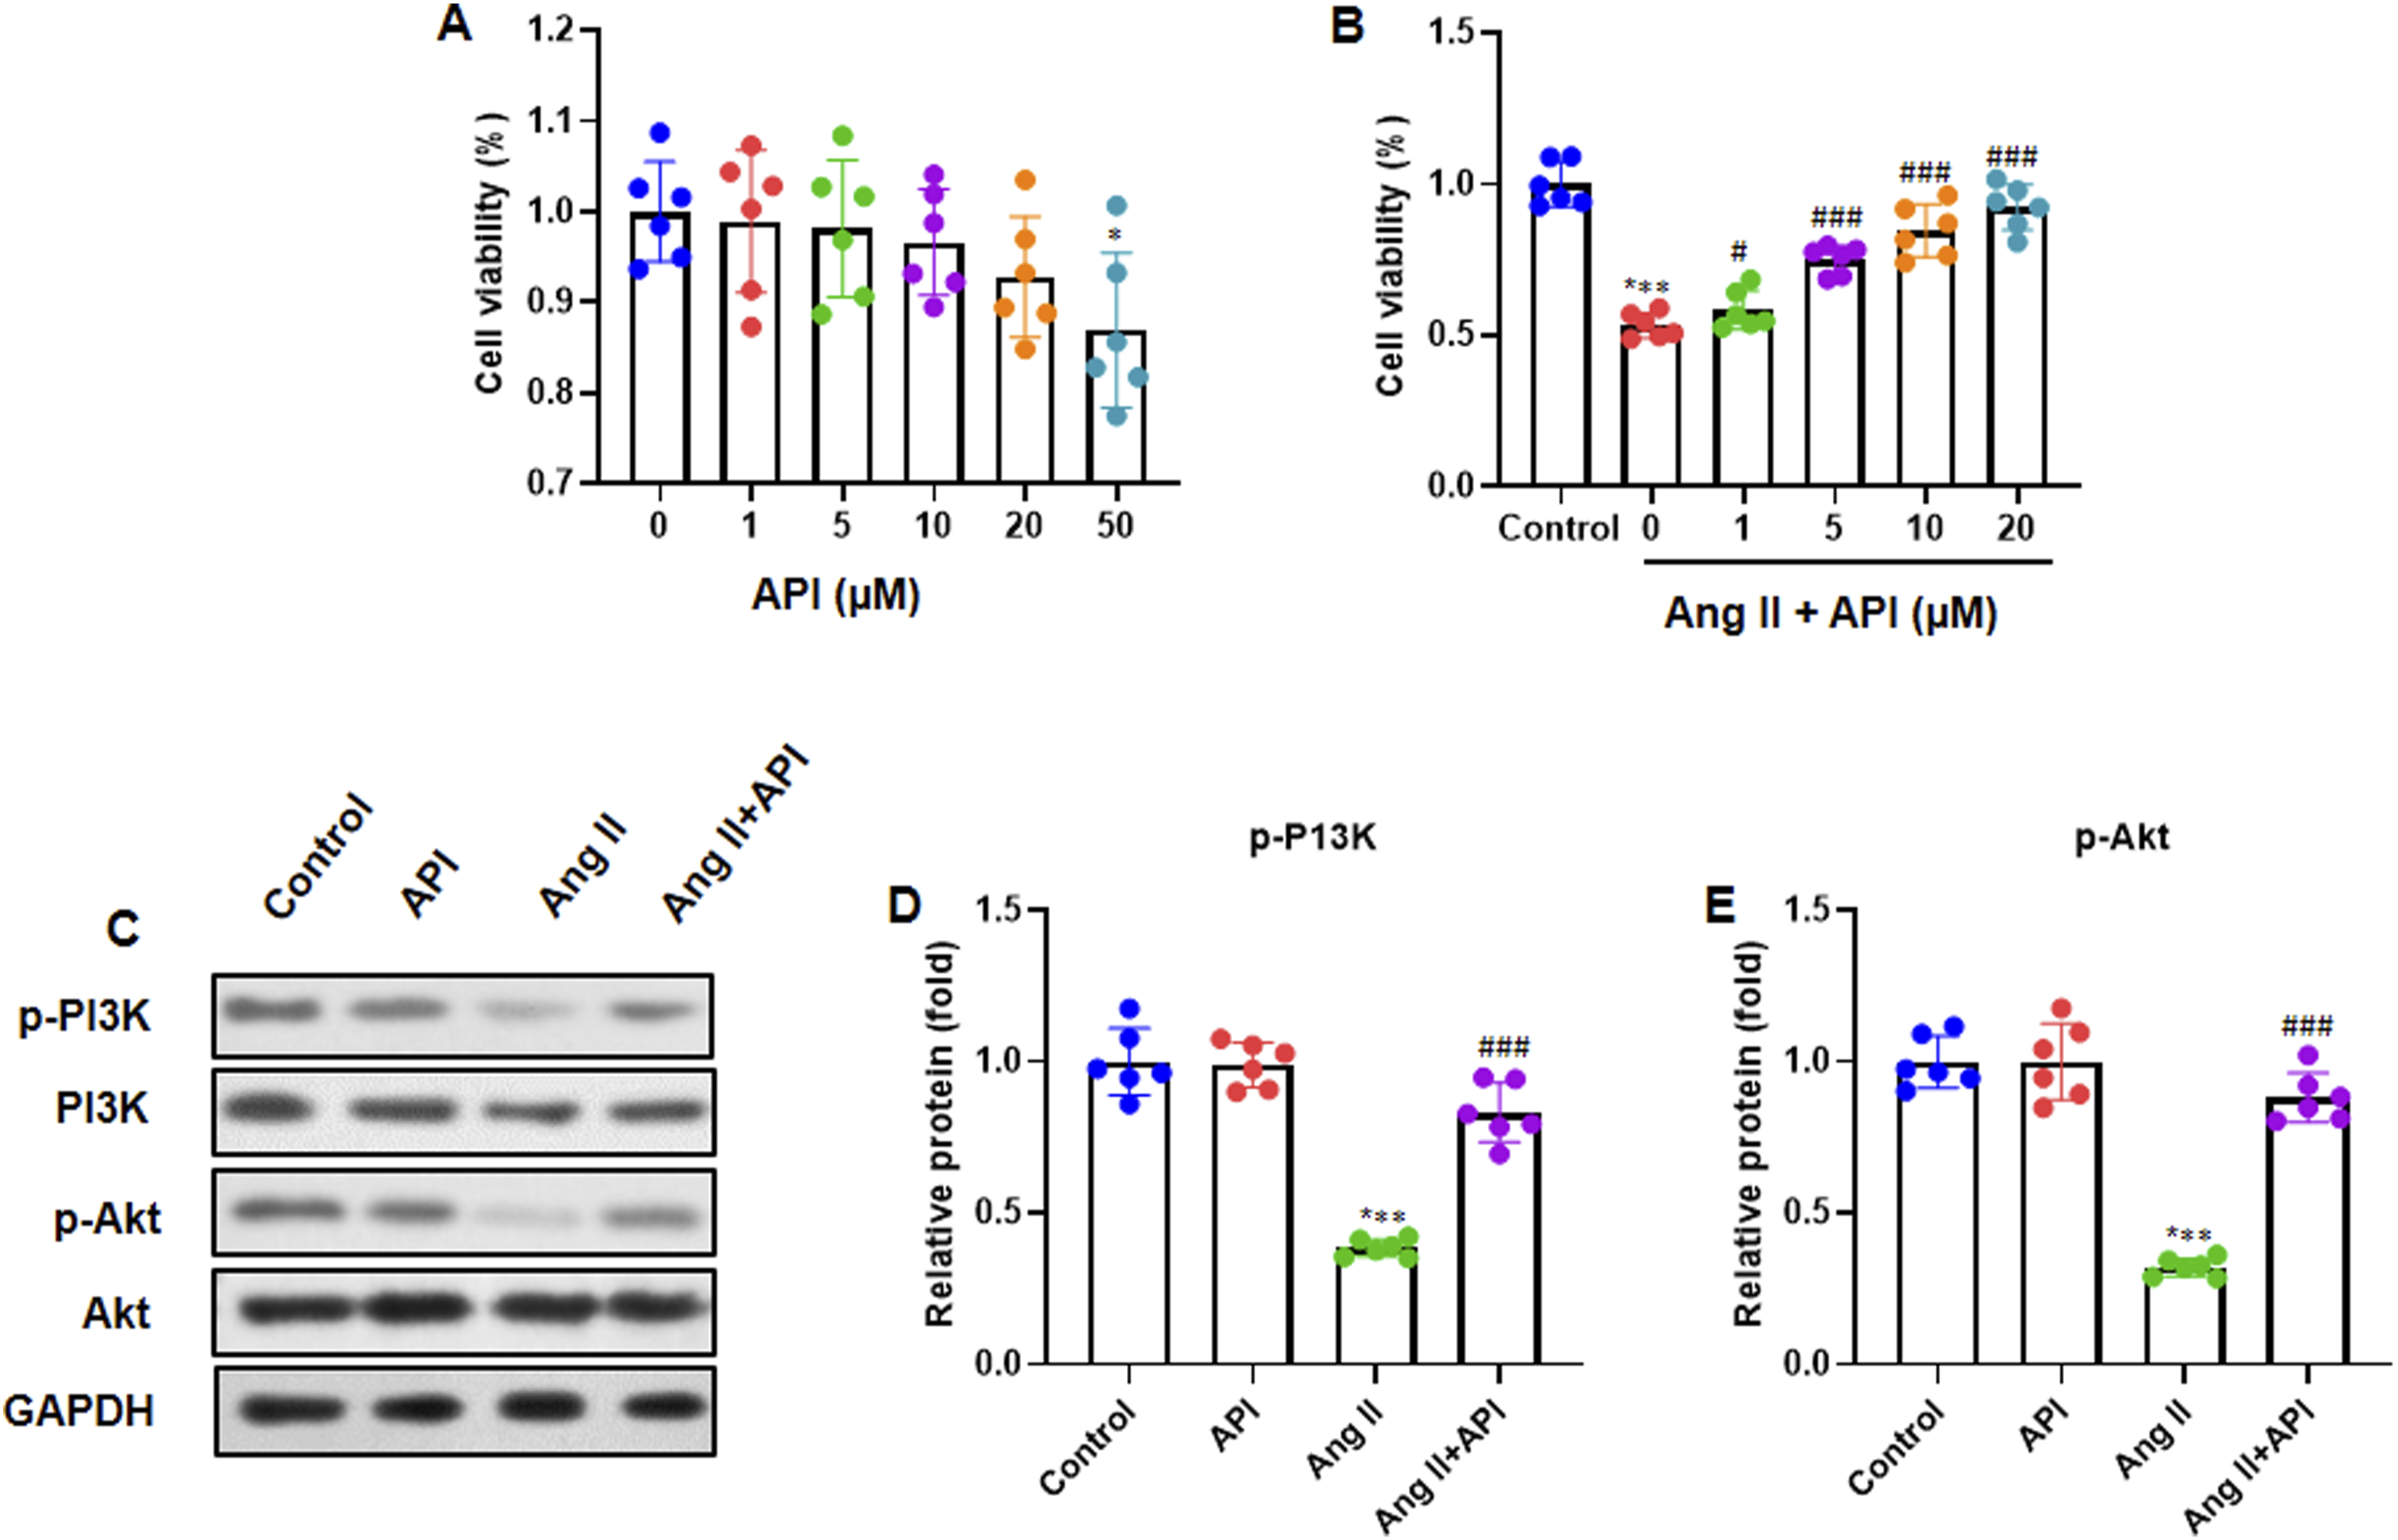
API Attenuates Ang II-Induced Apoptosis
MPC5 podocytes were pretreated with API (20 μM) or the PI3K/Akt pathway inhibitor LY294002 (10 μM) for 2 h, followed by incubation with Ang II (1 μM) for 24 h. Apoptosis was evaluated using Annexin V-FITC double staining and flow cytometry. The results demonstrated that Ang II stimulated the apoptotic rate, which was reduced in the Ang II + API group. However, treatment with the PI3K/Akt pathway inhibitor LY294002 increased the apoptotic rate in the Ang II + API group (Figure 5A). Quantification of the apoptotic rate was calculated as the sum of the lower right quadrant and the upper right quadrant, and consistent results were observed (Figure 5B). API Attenuates Ang II-Induced Apoptosis. (A) Apoptosis was Evaluated by Annexin V-FITC Double Staining, and Measured by Flow Cytometry. (B) Quantification of the Apoptotic Rate, which was Calculated by the Sum of the Lower Right Quadrant and the Upper Right Quadrant. Data Are Presented as Mean ± SD (n = 6 in Each Group). ***P < .001 vs Control Group; ###P < .001 vs Ang II Group; $$$P < .001 vs Ang II + API Group.
API Reduces Ang II-Induced Intracellular ROS Generation and Oxidative Stress
MPC5 podocytes were pretreated with API (20 μM) or the PI3K/Akt pathway inhibitor LY294002 (10 μM) followed by 24 h of incubation with Ang II (1 μM). Intracellular ROS production in podocytes was evaluated using DHE staining. The Ang II group showed elevated ROS production, which was inhibited in the Ang II + API group. LY294002 treatment restored ROS production in the Ang II + API group (Figure 6A). Quantification of the percentage of DHE + cells relative to DAPI + cells showed a similar trend (P < .001) (Figure 6B). Oxidative stress indicators were measured in the cell lysates using an enzymatic assay. MDA levels increased in the Ang II group but decreased in the Ang II + API group. Additionally, LY294002 treatment improved MDA levels in the Ang II + API group (P < .001) (Figure 6C). As for SOD and GSH-Px levels, their expression levels were found to be reversed compared to MDA (all, P < .001) (Figure 6DandE). API Reduces Ang II-Induced Intracellular ROS Generation and Oxidative Stress Through Inhibiting PI3K/Akt Pathway. (A) Intracellular ROS in Podocytes was Evaluated With DHE Staining and Photographed Under the Fluorescence Microscope (200×). (B) Quantification of the Percentage of DHE + Cells Relative to DAPI + Cells. The Oxidative Stress Indicators Were Measured in Cell Lysate: (C) MDA, (D) SOD and (E) GSH-Px. Data Are Shown as Mean ± SD (n = 6 per Group). ***P < .001 vs Control Group; ###P < .001 vs Ang II Group; $$$P < .001 vs Ang II + API Group. ROS, Reactive Oxygen Species; DHE, Dihydroethidium; MDA, Malondialdehyde; SOD, Superoxide Dismutase; GSH-Px, Glutathione Peroxidase.
API Attenuates Ang II-Induced Ferroptosis by Activation of the PI3K/Akt Pathway
The levels of mitochondrial ferrous iron were measured using MitoFerroGreen staining. The results showed that the Ang II group had elevated levels of mitochondrial ferrous iron, which was reduced in the Ang II + API group. Furthermore, treatment with the PI3K/Akt pathway inhibitor LY294002 increased mitochondrial ferrous iron levels in the Ang II + API group (P < .001) (Figure 7A). The percentage of FerroGreen + cells relative to DAPI + cells was quantified. Consistent expression levels of mitochondrial ferrous iron were observed (P < 0.001) (Figure 7B). API Reduces Ang II-Induced Ferroptosis Through Inhibiting PI3K/Akt Pathway. (A) Mitochondrial Ferrous Iron was Evaluated With Mito FerroGreen Staining and Photographed Under the Fluorescence Microscope (200×). (B) Quantification of the Percentage of FerroGreen + Cells Relative to DAPI + Cells. Data Are Presented as Mean ± SD (n = 6 in Each Group). ***P < .001 vs Control Group; ###P < .001 vs Ang II Group; $$$P < 0.001 vs Ang II + API Group.
API Regulates Ferroptosis-Related mRNA and Protein Expression by Activation of the PI3K/Akt Pathway
RT-qPCR was used to measure the mRNA expression of ferroptosis-related genes including GPX4, SLC7A11, and ACSL4. The results showed that the Ang II group had increased GPX4 mRNA levels, which were reduced in the Ang II + API group. However, treatment with the PI3K/Akt pathway inhibitor LY294002 significantly increased GPX4 mRNA levels in the Ang II + API group (P < .001) (Figure 8A). The expression levels of SLC7A11 and ACSL4 were reversed compared to those of GPX4 (all P < .001) (Figure 8BandC). API Modulates Ferroptosis-Rerated mRNA and Protein Expression by Activation of PI3K/Akt Pathway. RT-qPCR was Performed to Determine the mRNA Expression of Ferroptosis-Related Genes: (A) GPX4, (B) SLC7A11, and (C) ACSL4. (D) Representative Bands of Ferroptosis-Rerated Protein by Western Blot. Quantification of Proteins of (E) GPX4, (F) SLC7A11, and (G) ACSL4 (Normalized to GADPH Protein). Data Are Presented as Mean ± SD (n = 6 in Each Group). ***P < .001 vs Control Group; ###P < .001 vs Ang II Group; $$$P < .001 vs Ang II + API Group.
Additionally, we examined the expression of ferroptosis-related proteins by western blot analysis. We found that the Ang II group had increased GPX4 protein levels, which were decreased in the Ang II + API group. However, treatment with the PI3K/Akt pathway inhibitor LY294002 increased GPX4 protein levels in the Ang II + API group. Similarly, the expression levels of SLC7A11 and ACSL4 were reversed compared to those of GPX4 (Figure 8D). Quantitative analysis of these proteins revealed consistent expression trends in MPC5 podocytes (all, P < .001) (Figure 8E,F and G).
Discussion
The current study demonstrated how API affect ferroptosis and hypertensive renal injury. Our data showed that API significantly attenuated blood pressure and MAP, and improved the renal hypertrophy index and renal function in Ang II-treated mice. API significantly inhibited renal fibrosis and expression of Collagen I, Collagen IV, Fibronectin, TGF-β1, and α-SMA. In addition, API reduced Ang II-induced podocyte injury, apoptosis, intracellular ROS generation, oxidative stress, and ferroptosis by activating the PI3K/Akt pathway. Further, API regulates ferroptosis-related mRNA and protein expression by activating the PI3K/Akt pathway. Thus, these results indicate that API could have a significant therapeutic impact on hypertensive renal injury and fibrosis.
Ferroptosis is a type of regulated cell death characterized by iron-dependent lipid peroxidation and is associated with various kidney diseases, including hypertensive nephropathy. Oxidative stress and inflammation caused by hypertension can intensify ferroptosis, resulting in the death of renal tubular cells and worsening of kidney damage.2,8 The primary mechanisms include reduction of glutathione, suppression of GPX4, and buildup of lipid peroxides.17,18 Research has shown that triggering ferroptosis can hinder the growth, proliferation, and survival of tumor cells, suggesting its potential as a cancer treatment strategy.19,20 Nonetheless, the current study found that API, a natural flavonoid, prevented ferroptosis in renal cells under hypertensive conditions. API notably influenced the expression of genes related to ferroptosis, such as GPX4, SLC7A11, and ACSL4 in MPC5 podocytes. This supports existing evidence that ferroptosis is crucial in hypertensive kidney injury and indicates that targeting ferroptosis could be an effective therapeutic approach.
The PI3K/Akt pathway is a well-recognized signaling cascade that plays a crucial role in various cellular functions such as enhancing cell survival, reducing oxidative stress, and preventing apoptosis. 21 This pathway operates by phosphorylating downstream targets and is named after two key genes, PI3K and AKT. 22 Its main functions are to support metabolism, cell survival, proliferation, and angiogenesis in response to external signals.23,24 Previous studies have indicated that activation of the PI3K/Akt pathway aids in maintaining cellular redox balance and prevents ferroptosis by modulating antioxidant defenses and lowering ROS levels.25,26 Furthermore, in kidney injury cases, activation of this pathway shields against cellular damage by boosting antioxidant defenses and reducing inflammatory responses.27,28 However, our study revealed that API triggered the PI3K/Akt pathway, which subsequently inhibited ferroptosis. This observation aligns with earlier studies demonstrating that PI3K/Akt activation can alleviate renal injury by decreasing oxidative stress, ROS production, and apoptosis.
API is known for its anti-inflammatory, antioxidant, and anti-apoptotic properties. It has been studied in various models of kidney injury, including diabetic nephropathy and ischemia-reperfusion injury, and exerts protective effects by modulating oxidative stress and inflammatory pathways.6,29 Emerging evidence suggests that the PI3K/Akt pathway can regulate ferroptosis by modulating cellular redox balance and lipid metabolism. For example, Akt activation can upregulate antioxidant enzymes such as GPX4, which plays a key role in preventing lipid peroxidation and ferroptosis.30,31 This study adds to the body of knowledge by demonstrating that API specifically inhibit ferroptosis through PI3K/Akt activation. This novel mechanism suggests that API could be a promising therapeutic agent for hypertensive kidney injury, particularly in cases in which ferroptosis is a major driver of renal damage. Moreover, our study provides mechanistic evidence that the API-mediated activation of PI3K/Akt suppresses ferroptosis in renal cells. This aligns with the current understanding of the protective role of PI3K/Akt in ferroptosis and highlights its potential as a therapeutic target for hypertensive kidney injury.
Hypertensive kidney injury is a major contributor to chronic kidney disease (CKD) and end-stage renal disease (ESRD). Current treatments focus on blood pressure control and renin-angiotensin system inhibition, but there is a need for therapies that directly target the cellular mechanisms of injury, such as ferroptosis. 32 The present study suggests that API, by inhibiting ferroptosis through PI3K/Akt activation, could be a novel therapeutic approach for hypertensive kidney injury. This is particularly relevant, given the limited treatment options currently available to prevent the progression of hypertensive nephropathy.
Limitations
Our research has various constraints that require acknowledgement. First, we did not assess the API efficacy in a dose-dependent manner. In future studies, we could determine the effects of API in a dose-dependent manner. Second, female mice were omitted from the in vivo experiments to explore how API protects against Ang II-induced hypertensive renal damage and fibrosis. Further investigation is needed to include female mice and compare how API protects against Ang II-induced hypertensive renal damage and fibrosis with that of male mice. Third, the 28-day observation period was relatively short for evaluating the chronic effects and potential rebound phenomena. Future studies should extend the observation period to provide more comprehensive insight. Fourth, the underlying discoveries of our research are yet to be validated independently in either preclinical or clinical environments. Further investigation is required to elucidate the mechanism by which API prevents Ang II-induced hypertensive renal injury and fibrosis. Notwithstanding these limitations, our study presents substantial evidence of the protective properties of API against hypertensive renal injury and fibrosis, both in vivo and in vitro.
Conclusions
The current study investigated the potential protective effect of API against renal injury and fibrosis induced by Ang II both in vivo and in vitro. Our findings showed that API intervention effectively suppressed Ang II-induced hypertensive renal injury and fibrosis by activating the PI3K/Akt pathway. Further research is required to validate these findings in preclinical and clinical settings.
Footnotes
Acknowledgements
We appreciate the funding of this research by the Researchers Supporting Project (Tszb2023-15) at Shanghai University of Medicine and Health Science Affiliated Zhoupu Hospital in Shanghai, China.
Statements and Declarations
Authors’ contribution
Funding
The author(s) disclosed receipt of the following financial support for the research, authorship, and/or publication of this article: This study was supported by the 2023 Annual Key Discipline/Specialty (Disease)/Multidisciplinary Joint Diagnosis and Treatment Center Construction Project (Tszb2023-15).
Conflicting Interests
The authors declared no potential conflicts of interest with respect to the research, authorship, and/or publication of this article.
Data Availability Statement
Due to confidentiality issues, the datasets generated and/or analyzed during the current work are not publicly available but are available from the corresponding author upon reasonable request.