
Abstract

Keywords
Introduction
Cancer incidence is a probabilistic event. Let

The linear no-threshold (LNT) model may be expressed in terms of the ERR as follows:

This model was developed based on the traditional assumption that every increment of radiation dose, no matter how small, constitutes an increased cancer risk for human.2,3 The value of β is specified depending on situations at risk; in particular,
Against the LNT model, the European Commission points the possibility that no cancer is induced until the exposure to certain amount of radiation that is called the threshold.
4
Let x0 be the threshold, then the dose-response function with threshold x0 may be expressed by

The ERR of this model may be expressed by

It is well known in cancer induction that there is variation in radiation sensitivity among individuals, depending on sex, age, genetic background, lifestyle such as smoking, and exposures to other agents.5,6 Thus, we consider in this study a subgroup of susceptible individuals by radiation exposure in a population and propose a method to determine a safe dose limit for their radiological protection.
In this paper, we first show, in next section, how we represented the susceptibility to developing cancer following radiation exposure by setting a threshold for a dose-response function. Then, the threshold must be distributed over the targeted subgroup, since it is a gathering of individuals. Thus, it would be reasonable to treat x0 in equation (2) as the realization of random variable X distributed across the subgroup. We call this the “random threshold (RT) model” and advocate for its application to protect a susceptible subgroup of individuals from the risk of radiation exposure and subsequent development of cancer. The novel model for determining a safe dose limit for a susceptible subgroup of individuals who may develop cancer is introduced in Section 3. It uses the lower percentile of the distribution of the threshold, instead of the ERR. The application of the RT method to mutation carriers of the ATM gene, which is linked to cancer susceptibility, is detailed in Section 4, to illustrate the proposed method. Finally, we discuss the RT model and its application in Section 5.
Susceptibility and Threshold
Let

We call individual A is more susceptible to develop cancer than individual B if and only if

Suppose that individual B also follows the dose-response function (4) with C
A
and d
A
replaced by C
B
and d
B
. Then, individual A is more susceptible than individual B to develop cancer if and only if
Protection for a Radiosensitive Subgroup
Dose Response Function in the Subgroup
Let S be a radiosensitive subgroup of individuals who generate cancer based on the dose-response function (2). When the radiosensitivity among individuals in S is taken into account, it would be natural to consider x0 in (2) an observed value of random variable X. Let X follows a probability density function (pdf)

We approximate
Then,

Upon setting
The Safe Dose Limit for Sensitive Individuals in the Subgroup
Suppose that the distribution function of the threshold has been completely established. First, we recall that the threshold was defined as the minimal amount of radiation exposure that causes cancer in an individual base. Thus, its distribution over subgroup S may be recognized as the distribution of safe dose limits over the subgroup; in other words, a new dose-response function is introduced in S whose “dose” corresponds to the safe dose limit and whose “response” is related to the percentage of individuals in S who develop cancer. Recall also that the threshold was identified with the susceptibility to cancer; which makes it possible to order linearly these individuals’ susceptibility, from the most susceptible to least susceptible. Thus, the “dose” in the dose-response function may be also recognized as the sensitivity to cancer.
Our goal is to determine a safe dose limit for individuals in S who might develop cancer, taking into account their susceptibilities. To achieve this, we establish a strategy that ignores p% of individuals who are more susceptible than others, to protect the remaining (1-p)% individuals in S from developing cancer. The strategy is mathematically realized by using The distribution function of the threshold (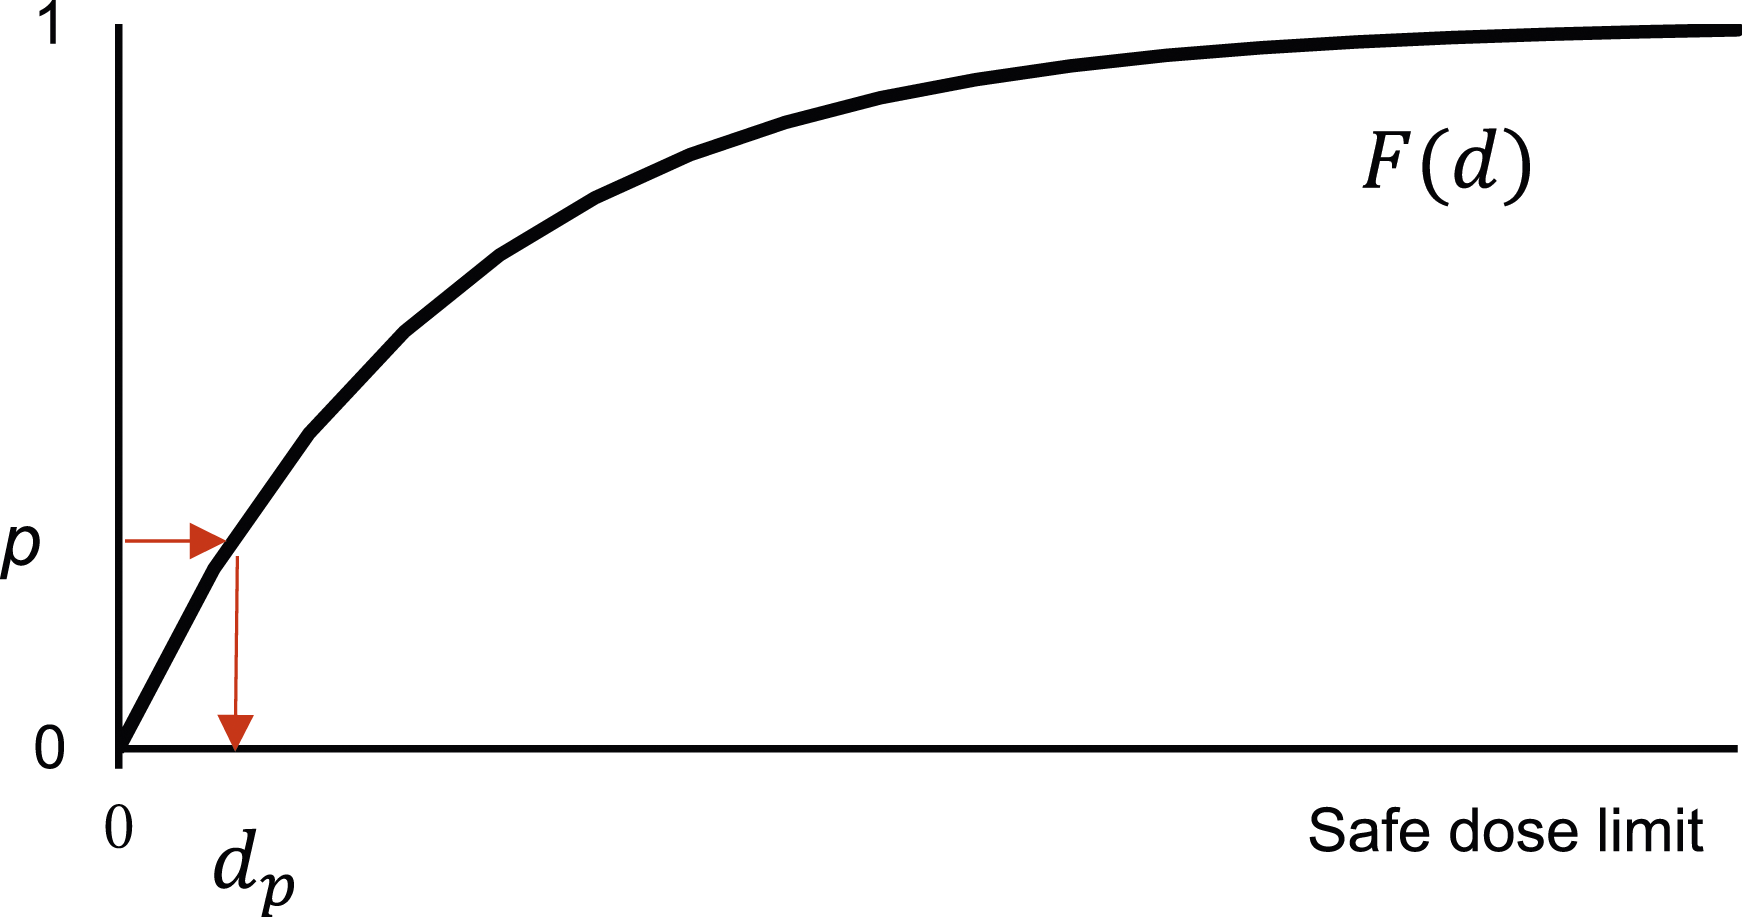

The most critical point in the above discussion is in the specification of the distribution of the threshold, which is illustrated below.
Specifying the Distribution of the Threshold
We suppose pdf

It is known that the family of gamma distributions takes various shapes depending on the values of k and λ, and that waiting time until “death” in life testing is a random variable that is frequently modeled with a gamma distribution. 7
Specifying Unknown Parameters of the Gamma Distribution
The existence of radiosensitive subgroups is of particular interest in radiotherapy and has been the subject of several studies, such as the Women’s Environmental, Cancer, and Radiation Epidemiology (WECARE) study.
8
Most of those studies are population-based case-control studies, in which the relative risks (RR) in intervals
The left edge
The given value of RR in the interval From Assumption A(1), it follows that Next, let d
0
be the midpoint of the interval The derivation of the formula is given in Appendix 2. An algorithm to determine k, λ and β∗ that satisfies equations (6) and (7) is given in Appendix 3.
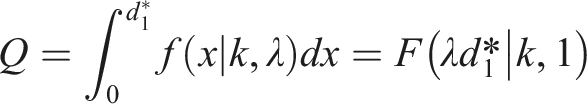


Choice of Q
Recall that
Error bounds of the assessed safe dose limit
Often the dose interval that made RR the first significant in case-control studies are identified with small sample sizes, and the RR over the interval is provided with 95% CI to represent its uncertainties. The proposed safe dose limit depends on the RR, thus it has also uncertainties. These uncertainties may be evaluated by using the CI of the RR as follows: Replace the value of r 0 in (5) by the value of its upper and lower bounds, respectively, and apply the same algorithm as given above. The resulting interval assesses uncertainties of the proposed safe dose limit. We call them U-limit and L-limit.
Application to the ATM Gene Carriers
There are several known radiation susceptible subgroups to generate cancer in a population.5,6 Among them we focus on the subgroup S = {Any rare ATM missense variant carriers predicted to be deleterious to induce cancer} in the WECARE study 8 and illustrate the proposed methodology.
There are cancer-susceptible gene carriers in the healthy population, such as carriers of the ataxia-telangiectasia mutated (ATM) gene. The ATM gene was first reported to be the causative gene of ataxia-telangiectasia in 1995. 9 Ataxia-telangiectasia is a rare autosomal recessive genetic disorder characterized by cerebellar ataxia, telangiectasia, susceptibility to infection, and radiosensitivity. Carriers of the ATM gene have been estimated to comprise approximately 1% of the general population. 10 In 1987, Swift and co-workers reported that for heterozygotes responsible for ataxia-telangiectasia, the RR of cancer was estimated to be 2.3 for men and 3.1 for women in the US white population. 11 Female ATM carriers are considered to have an approximately 2.3-fold higher risk of developing breast cancer than non-carriers. 12
Women’s Environmental, Cancer, and Radiation Epidemiology (WECARE) Study
The WECARE study was an international population-based case-control study; the 708 case subjects were women with contralateral breast cancer, and the 1397 control subjects were women with unilateral breast cancer matched to the case subjects on age, follow- up time, registry reporting region, and race and/or ethnicity. 8 The exposed radiation dose of each subject was estimated by examining past medical records; it was reported that the mean dose received to the contralateral breast was 1.2 Gy (SD = 0.7). 8 Statistical analysis was conducted by logistic regressions. It was reported that women in the WECARE study who carried any rare ATM missense variant predicted to be deleterious and who received radiation therapy for their first cancer, had a significantly elevated risk of contralateral breast cancer compared with unexposed women who carried the same deleterious missense variant; RR = 5.3, 95% CI: (1.6 ,17.3) in dose range 0.01-0.99 Gy; RR = 5.8, 95% CI: (1.8, 19.0) in dose range ≥1.0 Gy (see Bernstein, et al 8 ). Thus, the existence of such radiosensitive ATM carriers should not be ignored in dose limit setting for radiation protection purposes. 13
Threshold Distribution and the Safe Dose Limit of ATM Gene Carriers
Targeting subgroup S = {carriers of any rare ATM missense variant predicted to be deleterious}, we apply the proposed method to assess the safe dose limit for individuals in S by using the results given by the WECARE study.
The WECARE study gave RR = 5.3 and 95% CI= (1.6, 17.3) that was significant in dose interval (0.01, 0.99) (Gy). Thus, by considering 1 Gy is almost equivalent to 1 Sv, we may put d 0 = 500 (mSv), d 1 ∗ = 10 (mSv), and r 0 = 5.3. Setting k = 0.1 as the initial value for k in Step 1 and δ = 0.001 in Step 3 and applying the algorithm given in Appendix 2, we may determine values of parameters k, λ and β∗; and then compute the safe dose limit.
Values of k, λ and Safe Dose Limits.

Table 1 shows that i. The safe dose limit assessed by the RT model gets stringent as ii. The safe dose limit assessed by the RT model gets smaller as the risk level becomes stricter, but the speed of decrement is slow, compared to that of the LNT model. iii. Note that the current safe dose limit for general public recommended by the ICRP is 1 mSv/year.
1
It corresponds to 5 individuals generating cancer per year among 100,000 general public if one applies the LNT model with the consideration of the dose and dose-rate effectiveness factor (DDREF).
1
Similar modification might be needed, but safe dose limits assessed by the RT model in Table 1 are all smaller than 1 mSv.
Discussion
Showing that the individual difference of susceptibility leads to the variation of threshold of dose-response function, we introduced in this paper the RT model and proposed a method to determine a safe dose limit based on the model to protect subgroup of radiosensitive individuals from developing cancer.
The keystone of the method is the specification of the distribution of the threshold. We developed a method for the specification under assumptions (A1) and (A2). Of these two assumptions, (A2) would be easily acceptable, but it might not easy to accept (A1). Instead of (A1) we may use the following information;

Since 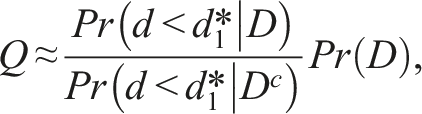
We find
This method, which takes individual difference of susceptibility into account, would be useful in considering dose limits for public and occupational exposures for subgroups that exhibit high susceptibility. In addition, there remains the possibility that dose limits will be established for medical exposure in the future, in which case the present model may prove useful. On the other hand, it may be necessary to note the possibility of inadequate treatment due to overestimation of risk, notwithstanding the L and U-limits developed in the present paper.
Note that the proposed method could be widely applicable, not only for low-dose radiation risk assessment, but also for the risk assessment of environmental pollutants where it is reported, for example, that genetic variants impact the sensitivity to ambient air pollution in pediatric patients with asthma. 14 Also note that the current low-dose risk assessment is limited to assessing the risk that is measured by the increase in annual excess incidences when the fixed amount of the dose is exposed throughout the year.
One of the limitations of this study is the assumption of Gamma distribution for the threshold. It is uncertain even now whether it is true for the case of human, while the distribution is often used for assessing the risks of environmental pollutants to generate cancer in animal experiments. We hope that further investigations, such as epidemiological and biological studies, could validate our model and may shed light on the need for radiation-induced risk assessment approaches considering individual susceptibility to cancer.
Conclusion
Conventional models were accompanied by significant limitations in risk assessment for radiation sensitive subgroups. In this study, we developed the RT model as one way to assess risk for cancer susceptible subgroups and illustrated it using the example of ATM gene carriers. This model would have versatility for risk assessment of various susceptible groups.
Supplemental Material
Supplemental Material - Random Threshold Model: A Low-Dose Radiation-Induced Risk Assessment Approach Considering Individual Susceptibility to Cancer
Supplemental Material for Random Threshold Model: A Low-Dose Radiation-Induced Risk Assessment Approach Considering Individual Susceptibility to Cancer by Takashi Yanagawa and Hisanori Fukunaga in Dose-Response.
Footnotes
Acknowledgments
The authors are grateful to Drs. Yasuhito Sasaki and Nobuyuki Hamada for useful discussions on the LNT model.
Author Contributions
Conceptualization, T.Y. and H.F.; Methodology, T.Y.; Investigation, T.Y.; Writing—original draft preparation, T.Y.; Writing—review and editing, H.F.; Project administration, H.F.; Funding acquisition, H.F. All authors have read and agreed to the published version of the manuscript.
Declaration of Conflicting Interests
The author(s) declared no potential conflicts of interest with respect to the research, authorship, and/or publication of this article.
Funding
The author(s) disclosed receipt of the following financial support for the research, authorship, and/or publication of this article: this study was partially supported by JST FOREST Program, Grant No JPMJFR211E.
Data Availability Statement
All data generated or analyzed during this study are included in this published article.
Supplemental Material
Supplemental material for this article is available online.
Appendix 1 (Proof of Proposition 1)
The RR of individual A to develop cancer may be represented as follows:
Thus, if
By contrast, suppose that individual A is more susceptible than individual B, so that
Appendix 2 (Derivation of equation ( 7 ))
Denoting the pdf of Gamma distribution with parameters k and λ by
Appendix 3 (Algorithm to determine k,λ and β ∗ )
Parameters k, λ and β∗ that satisfy (6) and (7) may be determined under the assumptions (A1) and (A2) by the following algorithm:

References
Supplementary Material
Please find the following supplemental material available below.
For Open Access articles published under a Creative Commons License, all supplemental material carries the same license as the article it is associated with.
For non-Open Access articles published, all supplemental material carries a non-exclusive license, and permission requests for re-use of supplemental material or any part of supplemental material shall be sent directly to the copyright owner as specified in the copyright notice associated with the article.