
Abstract
Hormesis refers to dose-response phenomena where low dose treatments elicit a response that is opposite the response observed at higher doses. Hormetic dose-response relationships have been observed throughout all of biology, but the underlying determinants of many reported hormetic dose-responses have not been identified. In this report, we describe a conserved mechanism for hormesis on the molecular level where low dose treatments enhance a response that becomes reduced at higher doses. The hormetic mechanism relies on the ability of protein homo-multimers to simultaneously interact with a substrate and a competitor on different subunits at low doses of competitor. In this case, hormesis can be observed if simultaneous binding of substrate and competitor enhances a response of the homo-multimer. We characterized this mechanism of hormesis in binding experiments that analyzed the interaction of homotrimeric proliferating cell nuclear antigen (PCNA) with uracil DNA glycosylase (UNG2) and a fluorescein-labeled peptide. Additionally, the basic features of this molecular mechanism appear to be conserved with at least two enzymes that are stimulated by low doses of inhibitor: dimeric BRAF and octameric glutamine synthetase 2 (GS2). Identifying such molecular mechanisms of hormesis may help explain specific hormetic responses of cells and organisms treated with exogenous compounds.
Introduction
Hormetic dose-response relationships exist throughout all of biology and are frequently reported in toxicologic and pharmacologic studies. 1 Hormesis refers to dose-response phenomena where low dose treatments elicit a response that is opposite the response observed at higher doses. Hormetic dose-response curves are sometimes referred to as “inverted U-shaped curves” when low doses stimulate a response that is inhibited at high doses, or alternatively, “J-shaped curves” when low doses reduce a response that is enhanced at higher doses. Other terms used to describe hormetic dose-response curves include “biphasic,” “bell-shaped,” or “paradoxical activation/inhibition” depending on the system studied and the field of research. Among others, one area of research where the specific term “hormesis” is commonly used is in the field of plant and herbicide research. It is well-established that subtoxic doses of some herbicides including glyphosate can stimulate plant growth, but these same compounds produce plant death at higher concentrations. 2 Examples also exist in animal research where low doses of cytotoxic agents or radiation stimulate the growth of cells.3,4 Many other examples of hormesis have been reported examining the effects of exogenous compounds on cell proliferation, cell death, and the behavior of organisms.1,5-7 Even endogenous cellular toxins such as reactive oxygen species and nitric oxide, which are harmful at high levels, can stimulate beneficial antioxidant and anti-inflammatory responses at low levels.8-12
Hormesis is considered a highly generalizable phenomenon and one of the most fundamental dose-response models across all scientific fields, 13 but the mechanisms underlying hormetic dose-response relationships are often unknown. In cases where low doses of toxins stimulate cell growth or protective responses, nonspecific over-compensatory mechanisms are often invoked. For example, low levels of stressor could direct cellular energy towards antioxidant and pro-growth strategies including protein synthesis, yet the cell succumbs to higher doses of the stressor. 14 A more specific mechanism of biological hormesis states that low doses of a compound may be sufficient to act on a receptor in an organism to produce a specific response, whereas higher doses produce an alternative response through interactions with a separate receptor. 7 Finally, the most direct mechanisms of hormesis would implicate a hormetic dose-response that occurs on the molecular level as being the cause of a hormetic response observed on the organism level. Such direct mechanisms of hormesis are sparse in the literature, or at the least, these mechanisms are difficult to identify because the term “hormesis” is not universally applied in biological research.
This study was initially inspired by an encounter with hormesis in a biochemical assay and by our desire to analyze hormetic dose-responses in a quantitatively descriptive manner. To this end, we adapted methods that are widely used for hormetic modeling in plant research towards evaluating the assembly of multi-protein complexes containing the DNA binding proteins proliferating cell nuclear antigen (PCNA) and uracil DNA glycosylase (UNG2).15-17 A key advantage of our approach was that we observed hormesis in binding assays that were performed with purified protein and peptide components. We could therefore alter specific conditions of the assay such as the concentrations of PCNA and UNG2 to understand their influence on the observed hormetic dose-response relationships. This model system allowed us to elucidate the molecular mechanism for hormesis in PCNA binding assays and to determine the interrelation of hormetic dose-response curve parameters for comparison to other hormesis studies that used similar statistical methods. We then examined molecular mechanisms of hormesis that have been reported for the enzymes BRAF kinase and glutamine synthetase 2 (GS2), and we found features that were conserved between the three hormetic systems containing PCNA, BRAF, or GS2. A unifying feature of these proteins is that they form homo-multimers and therefore contain multiple equivalent binding sites for substrates, small molecules, and other proteins. We find that the ability of a multimeric protein to simultaneously bind a substrate and its competitor on different subunits makes the protein potentially susceptible to hormetic dose-responses. This presents a framework for identifying other proteins and molecules that may elicit hormetic dose-responses using similar mechanisms. Characterizing such conserved mechanisms of hormesis on the molecular level should help predict the cause of hormetic dose-response relationships that occur on the organism level.
Materials and Methods
Fluorescence Anisotropy Binding Assays
The synthesis of N-terminally fluorescein–labeled Pogo-Ligase (PL) peptide was reported previously. 18 The peptide sequence was 5/6-fluorescein-Ahx-SAVLQKKITDYFHPKK where Ahx was an aminohexanoic acid linker, and the 8 residue PCNA binding motif began at the Q. The synthesis of unlabeled UNG2(a.a.1-19) peptide was also described previously, 18 and this peptide sequence was identical to the N-terminal residues of the human UNG2 protein (MIGQKTLYSFFSPSPARKRK). Additionally, the expression and purification of recombinant human PCNA and human UNG2 were published along with the general methodology for the fluorescence anisotropy binding assays.18,19 Briefly, equilibrium fluorescence anisotropy measurements were made at 22°C in a quartz cuvette using a Horiba Fluoromax 4 instrument and excitation/emission wavelengths of 495 nm/520 nm. The buffer contained 10 mM Tris-Cl, pH 8.0, 100 mM NaCl, 1 mM DTT, and 5% glycerol. The PL peptide concentration was constant at 50 nM for all experiments, and the concentration of other protein and peptide components were varied as described in the Results and Discussion. As controls, we confirmed that the PL peptide fluorescence intensity remained unchanged when PCNA, UNG2, and/or UNG2(a.a.1-19) were included in the cuvette at all tested concentrations, and additionally, we confirmed that the fluorescence anisotropy of PL peptide was unchanged when UNG2 and UNG2(a.a.1-19) were included in the cuvette in the absence of PCNA.
Protein and Peptide Crosslinking Experiments
Crosslinking reactions were performed in a 15 μL volume in a buffer containing 10 mM sodium phosphate, 100 mM NaCl, 1 mM DTT, and 5% glycerol, pH 7.4. The crosslinker utilized was Bis-(NHS)-PEG5 from Thermo Scientific (catalog #21581). The protein and peptide components were mixed and equilibrated at room temperature, and then the crosslinker was added to a final concentration of 1 mM. The protein and peptide concentrations in each reaction were indicated in the appropriate figure panel, and because the crosslinker was originally dissolved in DMSO, each reaction also contained a final concentration of .4% DMSO. The crosslinking reaction proceeded for 1 hour at room temperature then was quenched with 2 μL of a solution containing 250 mM Tris and 1.92 M glycine followed by heating at 95°C for 1 minute. Subsequently, 3 μL of 80% glycerol was added to the mixture before it was separated on a 4–15% SDS-PAGE gel. The gel was imaged on an Azure c400 imager using its red, green, and blue fluorescent filters.
Monotonic and Hormetic Dose-Response Equations for Modeling
The standard symmetric log-logistic model used for monotonic dose response curves relating response y to dose x follows the equation


A mathematically equivalent equation can be written


In equations (1)–(4), the slope of the curve has the opposite sign compared to parameter b such that b is positive if the y values become reduced at greater x values. A variation of equation (4) that is commonly used when y response values are plotted against log-transformed x values is written


Equation (6) is recognized as an equation for a standard sigmoidal dose-response curve where the Hill slope n is positive if the y values increase at greater x values.
To model hormesis as inverted U-shaped biphasic dose-response curves, an additional parameter f can be incorporated into equation (1) such that16,17

Equation (7) is also known as the Brain and Cousens model for hormesis,
16
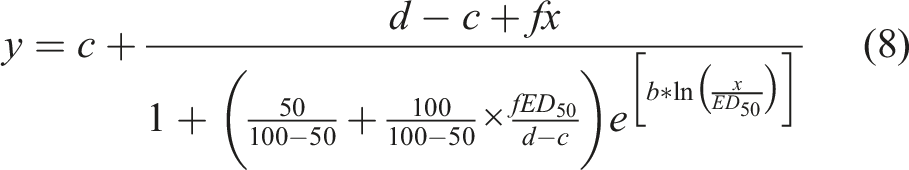
and low dose stimulation occurs when f is greater than 0. Equation (7) was reparameterized by Schabenberger et al.
17
to include the following parameters: dose ED
50
(equation (8)); dose M, which is defined as the dose x yielding the maximum stimulatory y response (ymax) (equation (9)); LDS (limiting dose for stimulation), which is defined as the highest dose x at which the stimulatory hormetic response vanishes and the response returns to the level of d (equation (10)). These parameterizations are also published elsewhere.15,17


Interpretation of Hormetic Dose-Response Curves
Hypothetical inverted U-shaped hormetic and standard sigmoidal dose-response curves are shown in Figure 1. Parameters defining the hormetic dose-response curve include c, d, ED
50
, f (hormesis parameter), and b (slope parameter) (equation (8)). The hormesis curve is used for data satisfying f > 0, while when f = 0, the hormesis equation reverts back to the standard monotonic dose-response curve (compare equations (1) and (7)). Thus, parameters c, d, ED
50
, and b also define the standard dose-response curve (Figure 1). Also indicated in Figure 1 are parameters determined from equations (9) and (10): LDS as the limiting dose for stimulation and M as the dose inducing the maximum stimulatory response ymax. Finally, the magnitude of hormetic stimulation that reflects the percent change between control level d and ymax is reported as ymax% and is calculated as (ymax/d)*100%. Hypothetical standard monotonic dose-response curve and a biphasic dose-response curve showing hormesis. Parameters d, c, and ED
50
apply to both curves, whereas ymax, M, and LDS apply only to the hormetic curve. Additional curve parameters b (both curves) and f (hormetic curve) do not interpolate to the x or y axes, but control the steepness of the descending slope and the degree of hormetic increase. This figure was adapted from Schabenberger et al.
17

Curve Fitting
For hormesis dose-response curves, the NLMIXED procedure of SAS was used to fit response values y as a nonlinear function of dose x using equations (8)–(10). 15 The significance of hormesis was assessed by the 95% confidence interval for parameter f and was given for f > 0. 17 Calculations were performed using SAS software/SAS Studio OnDemand for Academics webserver. The estimated parameters (b, d, f, c, and ED 50 ) were used to visualize the hormesis curve in GraphPad Prism using equation (8) to solve for y using hypothetical x values.
Standard monotonic dose-response curves were fit using GraphPad Prism and equation (6). The standard hyperbolic binding curve for the PCNA-PL peptide interaction was fit using GraphPad Prism and the quadratic binding equation reported previously.18,21,22 For the data showing the relationship between PCNA concentration (on the x axis) and ymax, d, or ymax% (on the y axis), curves were fit using GraphPad Prism and the semi-log line equation

Additional Data Analysis
The ED
50
value for UNG2 displacing 50 nM PL peptide from .25 μM PCNA was used to calculate the affinity (Ki) of UNG2 for PCNA using the equation

For BRAF paradoxical activation and GS2 hormesis data, we used the online software WebPlotDigitzer 24 to extract x/y data points from published articles.25,26 Dose-response curves were fit to the data using the methods described above.
Results and Discussion
Hormesis Observed During the Formation of Multi-Protein Complexes
We conducted equilibrium protein/peptide binding experiments with the following components: human PCNA, which is an obligate homotrimer that forms a ring-like structure; Pogo-Ligase (PL) peptide, which is 16mer containing an N-terminal fluorescein label conjugated through an aminohexanoic acid linker; and human UNG2, which contains an unstructured N-terminal domain and a globular catalytic domain. PL peptide and the N-terminal domain of UNG2 each contain a conserved PCNA-interacting-protein motif called a PIP-box, and PL peptide and UNG2 bind to the same place on PCNA called the interdomain connecting loop. 18 Because PCNA is a homotrimer, there are three equivalent binding sites on each protein that can theoretically bind to PL peptide or UNG2.
We used a constant concentration of PL peptide in our binding assays (50 nM), and we measured its fluorescence anisotropy in the presence of increasing PCNA concentrations (Figure 2A).
18
The fluorescence anisotropy of PL peptide alone in solution was .043, and this increased to .119 when the peptide was saturated with PCNA (Figure 2A). A standard hyperbolic binding curve fit to the data determined a Kd of .1 μM for the interaction of PL peptide with PCNA.
18
The fluorescence intensity of PL peptide was unaltered when bound to PCNA; therefore, the fluorescence anisotropy measurements should be directly related to the rotational diffusion of PL peptide’s fluorescein label. The increased anisotropy in the presence of PCNA indicated that the rotational motion of fluorescein slowed when PL peptide was bound to PCNA and became part of a larger molecular complex.
27
Detection of multi-protein complexes containing PCNA and UNG2. (A) Interaction of fluorescein-labeled PL peptide (50 nM) with increasing amounts of PCNA as detected using fluorescence anisotropy. The dissociation constant (Kd) for their interaction was determined to be .1 μM from the curve fit to the data. In all figures and legends, the concentration of PCNA monomer was used because this reflected the number of PCNA binding sites. Limited variations of assays from panels A, B, and D were reported previously,
18
but all data here is original. Data points in these panels represent mean values from at least three independent measurements with standard error, and in many cases the error bar is not visible because it is smaller than the displayed point. (B) Competition assays where 50 nM PL peptide was displaced from PCNA with increasing amounts of UNG2. The PCNA concentration used in each assay is indicated, and parameters for the curves are shown in Table 1. (C) Fluorescence image of an SDS-PAGE gel where the indicated components were equilibrated prior to crosslinking. The larger complexes indicated with the arrows contain PCNA (P), PL peptide (PL), and one or two UNG2 (U) molecules. The lane immediately adjacent to the ladder was empty. This gel is representative of three independent crosslinking experiments. (D) Competition assays where 50 nM PL peptide was displaced from PCNA with increasing amounts of UNG2(a.a.1-19) peptide. The PCNA concentration used in each assay is indicated, and parameters for the curves are shown in Table 2. (E) Mechanism for hormesis in competition assays. (1) In the absence of UNG2, each PCNA homotrimer bound by PL peptide has at least two free sites that UNG2 can bind. (2) The fluorescence anisotropy of PL peptide increases when UNG2 is bound to the same PCNA homotrimer. (3) At high UNG2 concentrations, all PL peptide is displaced and the fluorescence anisotropy decreases. Note that not all states of binding are shown in this simplified model.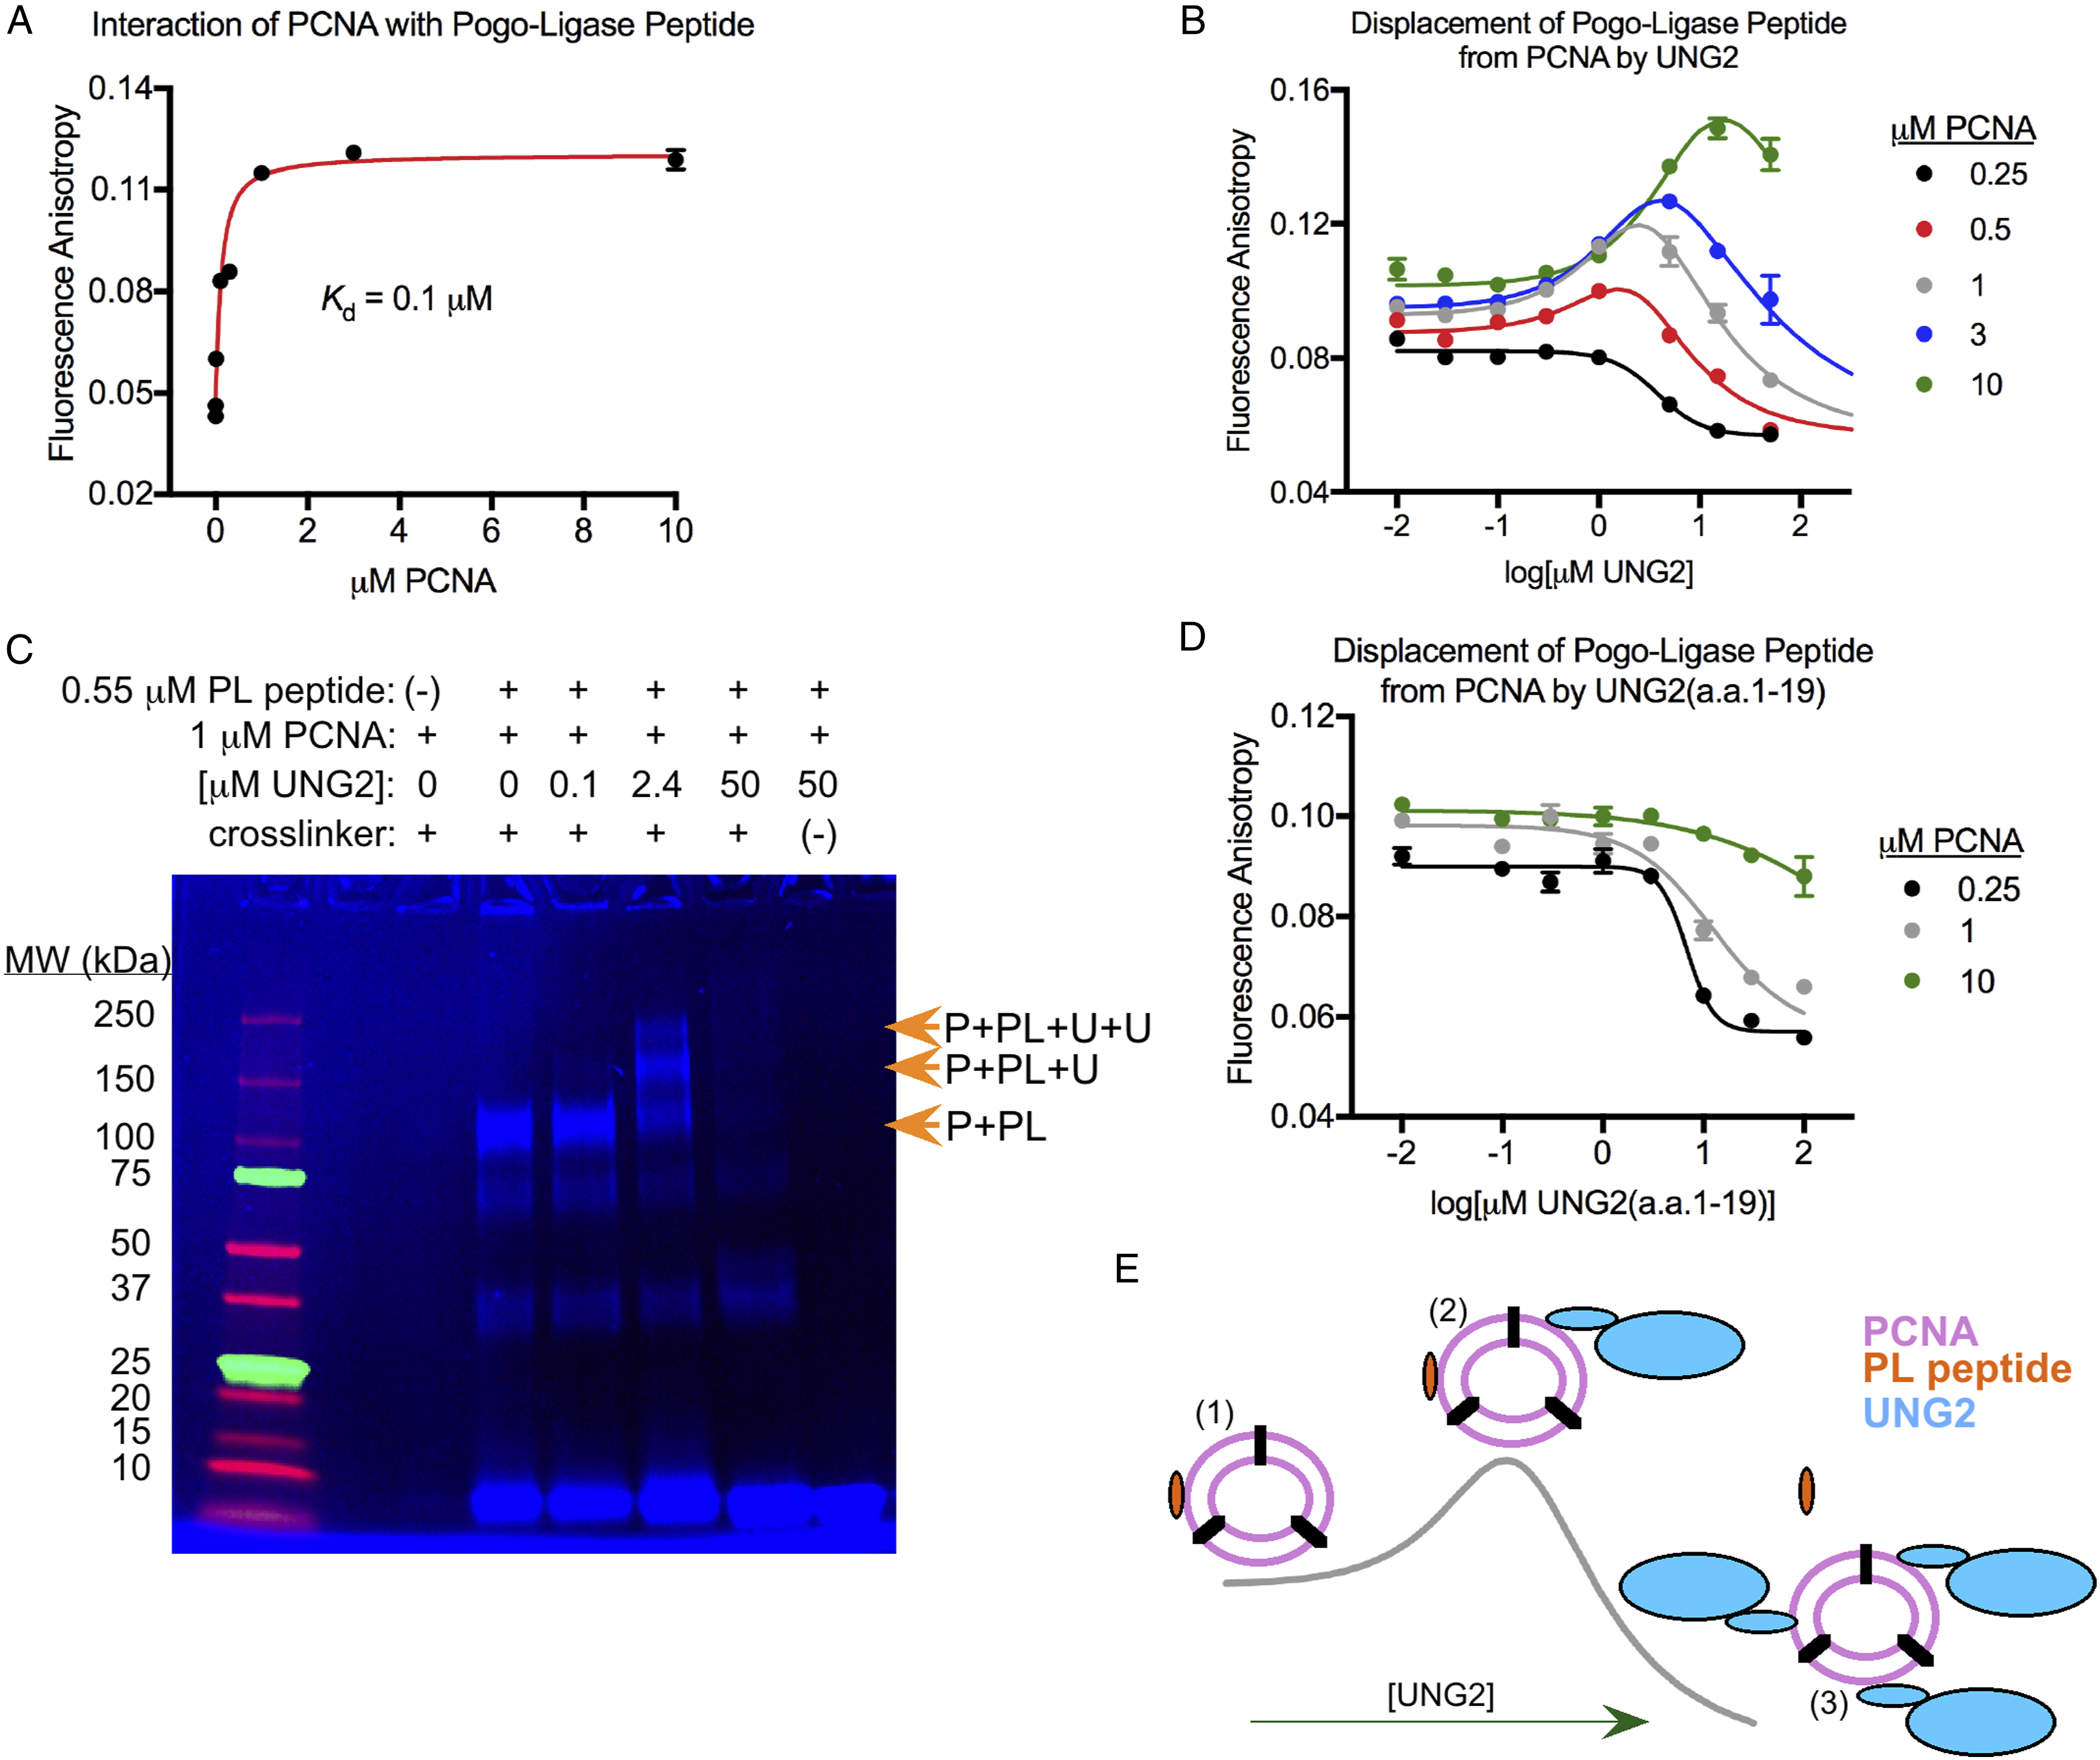
Standard and Hormetic Dose-Response Curve Parameters for Binding Assays containing PCNA, PL Peptide, and UNG2.

aDetermined from standard dose-response curve; all other values determined from hormetic dose-response curves.
bFixed values as estimated from the .25 μM dataset using hormetic modeling.
cNot determined due to lack of data points on descending part of curve.
df > 0 based on 95% confidence interval indicating significant hormesis.
In addition, we conducted competition assays where we displaced 50 nM PL peptide from PCNA with UNG2, but we used different PCNA concentrations in the range of .5 μM to 10 μM. The observed dose-response relationships in these competition assays all showed significant “low dose stimulation” where the fluorescence anisotropy of PL peptide increased at low UNG2 concentrations prior to the reduction that would be expected when UNG2 displaces the peptide from PCNA (Figure 2B). These datasets were fit using the hormetic dose-response curve as opposed to a standard dose-response curve (Figure 2B), and values for the curve parameters are shown in Table 1.
We performed crosslinking experiments to better understand how PL peptide, PCNA, and UNG2 interact with each other. 1 μM PCNA was equilibrated with .55 μM PL peptide and varying UNG2 concentrations (.1 μM to 50 μM), then the mixtures were treated with a symmetric crosslinker that contained amine-reactive NHS ester groups separated by a flexible PEG5 linker. Subsequently, SDS-PAGE and fluorescence imaging of the crosslinked components demonstrated that binary PL peptide-PCNA complexes were the primary species in the absence of UNG2 (Figure 2C). When 2.4 μM UNG2 was included in the system, ternary and even quaternary protein/peptide complexes formed (PL peptide-PCNA-UNG2 and PL peptide-PCNA-UNG2-UNG2) (Figure 2C). Lastly, the addition of 50 μM UNG2 to the system was sufficient to displace all of the PL peptide from PCNA (Figure 2C).
Standard and Hormetic Dose-Response Curve Parameters for Binding Assays Containing PCNA, PL Peptide, and UNG2(a.a.1-19) Peptide.
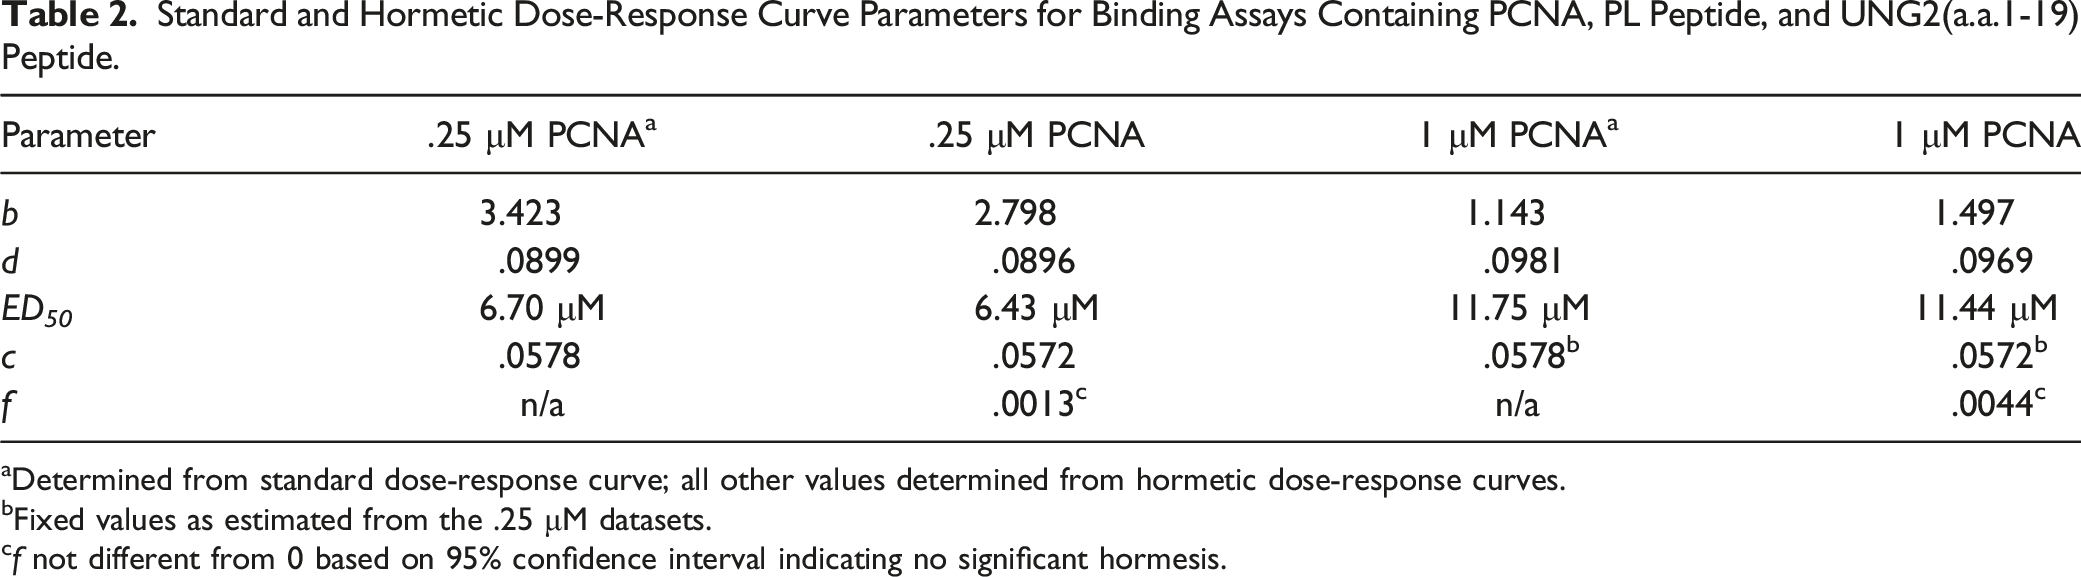
aDetermined from standard dose-response curve; all other values determined from hormetic dose-response curves.
bFixed values as estimated from the .25 μM datasets.
cf not different from 0 based on 95% confidence interval indicating no significant hormesis.
Mechanism for Hormesis in Fluorescence Anisotropy Assays Containing PCNA, PL Peptide, and UNG2
At the start of each competition assay, the concentration of PCNA homotrimer exceeded the PL peptide concentration. Therefore, each PCNA homotrimer that was bound to PL peptide still averaged at least two free binding sites that could theoretically be occupied by UNG2 (Figure 2E). As validated with crosslinking (Figure 2C), the increase in fluorescence anisotropy that occurred at lower UNG2 concentrations resulted from the formation of ternary PL peptide-PCNA-UNG2 complexes (and probably quaternary complexes) that were much larger than binary PL peptide-PCNA complexes (Figure 2E). The hormetic increase in fluorescence anisotropy indicated that the rotational diffusion of the fluorescein label was slower when PL peptide was bound to PCNA-UNG2 complexes compared to PCNA alone. Such a dependence of fluorescein’s rotational diffusion and anisotropy on the molecular weight of the interacting complex is commonly observed.27,28 This was further supported because the maximum anisotropy of PL peptide saturated with PCNA was significantly exceeded when PL peptide was co-equilibrated with both PCNA and UNG2 (Figures 2A and B and ymax values in Table 1). Finally, at sufficiently high UNG2 concentrations, all of the PL peptide was displaced from PCNA and the fluorescence anisotropy reduced towards the value of free PL peptide in solution. We note that the hormetic dose-response was probably not observed during competition assays using the peptide UNG2(a.a.1-19) because complexes containing PL peptide, PCNA, and UNG2(a.a.1-19) were not significantly larger than PL peptide-PCNA complexes alone. Thus, the addition of one or two molecules of UNG2(a.a.1-19) to PL peptide-PCNA complexes did not alter the movement of the complex enough in solution to affect the rotational diffusion of the fluorescein label on PL peptide or its fluorescence anisotropy. For comparison, the molecular weights of the complexes are as follows: PL peptide-PCNA, 92.4 kDa; PL peptide-PCNA-UNG2(a.a.1-19), 94.6 kDa; PL peptide-PCNA-UNG2(a.a.1-19)-UNG2(a.a.1-19), 96.8 kDa; PL peptide-PCNA-UNG2, 127.4 kDa; PL peptide-PCNA-UNG2-UNG2, 162.4 kDa). Additionally, ∼70% of UNG2’s mass is contributed by its globular catalytic domain which significantly increases the radius of the PCNA complexes upon binding.
An important consideration is why hormesis was not observed when PL peptide was displaced from .25 μM PCNA with UNG2, but was observed with increasing magnitude as PCNA levels increased. Assays with lower concentrations of PCNA were less sensitive at detecting PL peptide-PCNA-UNG2 complexes as indicated by the ymax% values calculated from the curve parameters (Table 1). The fluorescence anisotropy measurement was an average value from all of the PL peptide in the cuvette, and based on the Kd for their interaction (Figure 2A), only 68% of PL peptide was bound to .25 μM PCNA in the absence of UNG2. Thus, at least 32% of PL peptide in that assay would always contribute an anisotropy of free PL peptide (.043); in contrast, 99% of PL peptide was initially protein-bound in experiments using 10 μM PCNA, which eliminated the background from free PL peptide and increased the concentration of PL peptide-PCNA complexes available for UNG2 binding. We emphasize that free PL peptide and multiple states of PL peptide bound to different protein complexes were present in different ratios in each equilibrium measurement, and that the fraction of PL peptide in a ternary or quaternary complex that was required to observe hormesis cannot easily be determined. We cannot decompose the fluorescence anisotropy value to determine the contribution of each state of PL peptide to the overall measurement (PL peptide states include free PL peptide, PCNA-bound, or ternary/quaternary complex-bound).
Interrelations Between Hormetic Dose-Response Curve Parameters
Correlations between specific hormetic dose-response curve parameters that were obtained using identical modeling methods have been reported in studies analyzing the stimulation of plant growth by low doses of herbicides or other phytotoxins that precedes plant death at higher doses.1,2,29,30 In agreement with these specific reports on hormesis parameters,2,29-31 estimates for d and ymax had a strong correlation in our datasets (Figure 3A). However, the increase in d and ymax are theoretically limited in our binding assay, and the parameters plateau at different values (Figure 3B). This is not a characteristic that is always found in hormetic dose-response relationships.
31
In our binding assay, d plateaus when all of the PL peptide is bound to PCNA in the absence of UNG2, which is typical for one-site binding assays and is also illustrated in Figure 2A. In contrast, ymax plateaus when PL peptide is maximally bound to complexes containing both PCNA and UNG2. Consequently, ymax% plateaus because it is calculated from d and ymax (Figure 3C). Interestingly, ∼80% of hormetic dose-response curves reported from toxicologic studies have ymax% values of less than 200%,
1
which was consistent with the range found in our study (Figure 3C). Relationships between dose-response curve parameters and protein concentrations in binding assays containing PL peptide, PCNA, and UNG2. (A) Parameters d and ymax are linearly correlated. (B) and (C) Relationships between dose-response curve parameters and protein concentrations are shown. The placement of individual parameters in either panel was arbitrary and chosen based on the scale of the values.
Other features of biochemical hormesis curves have not been reported in toxicologic systems. In our binding assays, the estimated dose parameters M, LDS, and ED 50 increased linearly with PCNA concentration and were seemingly unlimited (Figure 3C). A linear increase in ED 50 would also be expected in a simple one-site competition assay where receptor levels can continually be increased. Such may not be the case with plants and animals on the whole organism level where a toxicologic ED 50 may be shifted by some growth factors such as temperature or light, but a progressive and unlimited shift in ED 50 is unlikely to occur because at some point the growth factor itself will cause an adverse effect on the organism. 14 The complexity of our PCNA binding assay renders the ED 50 values derived in the presence of hormesis difficult to interpret because they do not report on a one-site interaction between UNG2 and PCNA and are not compatible with equation (12).
Finally, parameters f and b that control curve ascension from d and descension to c also changed in a characteristic way. Parameter f from our curves followed a bell-shaped relationship with increasing amounts of PCNA but would be expected to remain greater than zero at even higher PCNA concentrations than those tested in this study (Figure 3B). This is expected because d and ymax plateau with d less than ymax, and these parameters theoretically remain stable with increasing PCNA concentrations. On the other hand, the slope parameter b progressively decreased at higher PCNA concentrations as the slope between ymax and c shallowed. Parameter b was equivalent to the Hill slope in the assays using .25 μM PCNA when hormesis was absent, and the value of ∼2 in those assays suggested negative cooperativity where the association of PL peptide or UNG2 with PCNA was weakened by the presence of the other (Table 1). Apparently, the negative cooperativity became reduced as the assay reported less on displacement of PL peptide from PCNA by UNG2, and instead, reported more on the displacement of PL peptide from PCNA-UNG2 complexes that occurred more readily at higher PCNA concentrations.
A Conserved Mechanism for Hormesis in Molecular Systems
Besides the hormesis results from our PCNA binding assays, we identified two additional proteins that can produce hormetic dose-responses through a defined mechanism. First, BRAF protein kinase is an enzyme that is active as a dimer and inactive as a monomer.25,32 As a dimer, BRAF has two active subunits that can bind substrate or be targeted by small molecules. At low concentrations, the BRAF inhibitor dabrafenib will bind only a single subunit of the BRAF dimer, and this allosterically enhances the activity of the other subunit.
25
This “paradoxical activation” of BRAF persists until the inhibitor concentration is sufficient to bind both active subunits of the dimer (Figure 4A).
33
A second example of molecular hormesis is the stimulation of GS2 from chloroplasts of the plant Lotus corniculatus by the herbicide methionine sulfoximine. GS2 is a homo-octamer with eight active sites.
26
Analogous to BRAF, low concentrations of methionine sulfoximine bind and inhibit individual subunits of the octamer, but this has an allosteric stimulatory effect on other subunits of the octamer (Figure 4B).
26
High doses of methionine sulfoximine ultimately bind and inhibit all eight subunits of GS2 to completely inhibit the enzyme (Figure 4B). Reported mechanisms for BRAF paradoxical activation by the inhibitor dabrafenib and the hormetic dose-response of the herbicide methionine sulfoximine on GS2. (A) BRAF itself is enzymatically active as a dimer. At low dabrafenib concentrations, only one subunit of BRAF is bound by the inhibitor and this allosterically stimulates the other subunit. In contrast, high concentrations of dabrafenib inhibit both subunits rendering the enzyme inactive. Our depiction is simplified because BRAF actually has two substrates (ATP and protein), with dabrafenib being competitive with ATP. The data points on this graph were extracted from Cope et al.
25
and were fit with a hormetic dose-response curve. From the curve parameters, f > 0 based on the 95% confidence interval indicating significant hormesis. (B) GS2 is enzymatically active as an octamer. Low doses of methionine sulfoximine bind only some subunits of the octamer to allosterically stimulate other subunits. High concentrations of methionine sulfoximine bind and inhibit all subunits of GS2. Our depiction is simplified because GS2 actually has two substrates (ATP and glutamate), and methionine sulfoximine is competitive with glutamate and a somewhat irreversible inhibitor. In our depiction, the green subunits of GS2 would have activity that is significantly higher than octameric subunits in the absence of methionine sulfoximine. The data points on this graph were extracted from Dragićević et al.
26
and were fit with a hormetic dose-response curve. From the curve parameters, f > 0 based on the 95% confidence interval. Note that, for both BRAF and GS2, not all states of free, substrate-bound, and inhibitor-bound enzyme complexes are shown.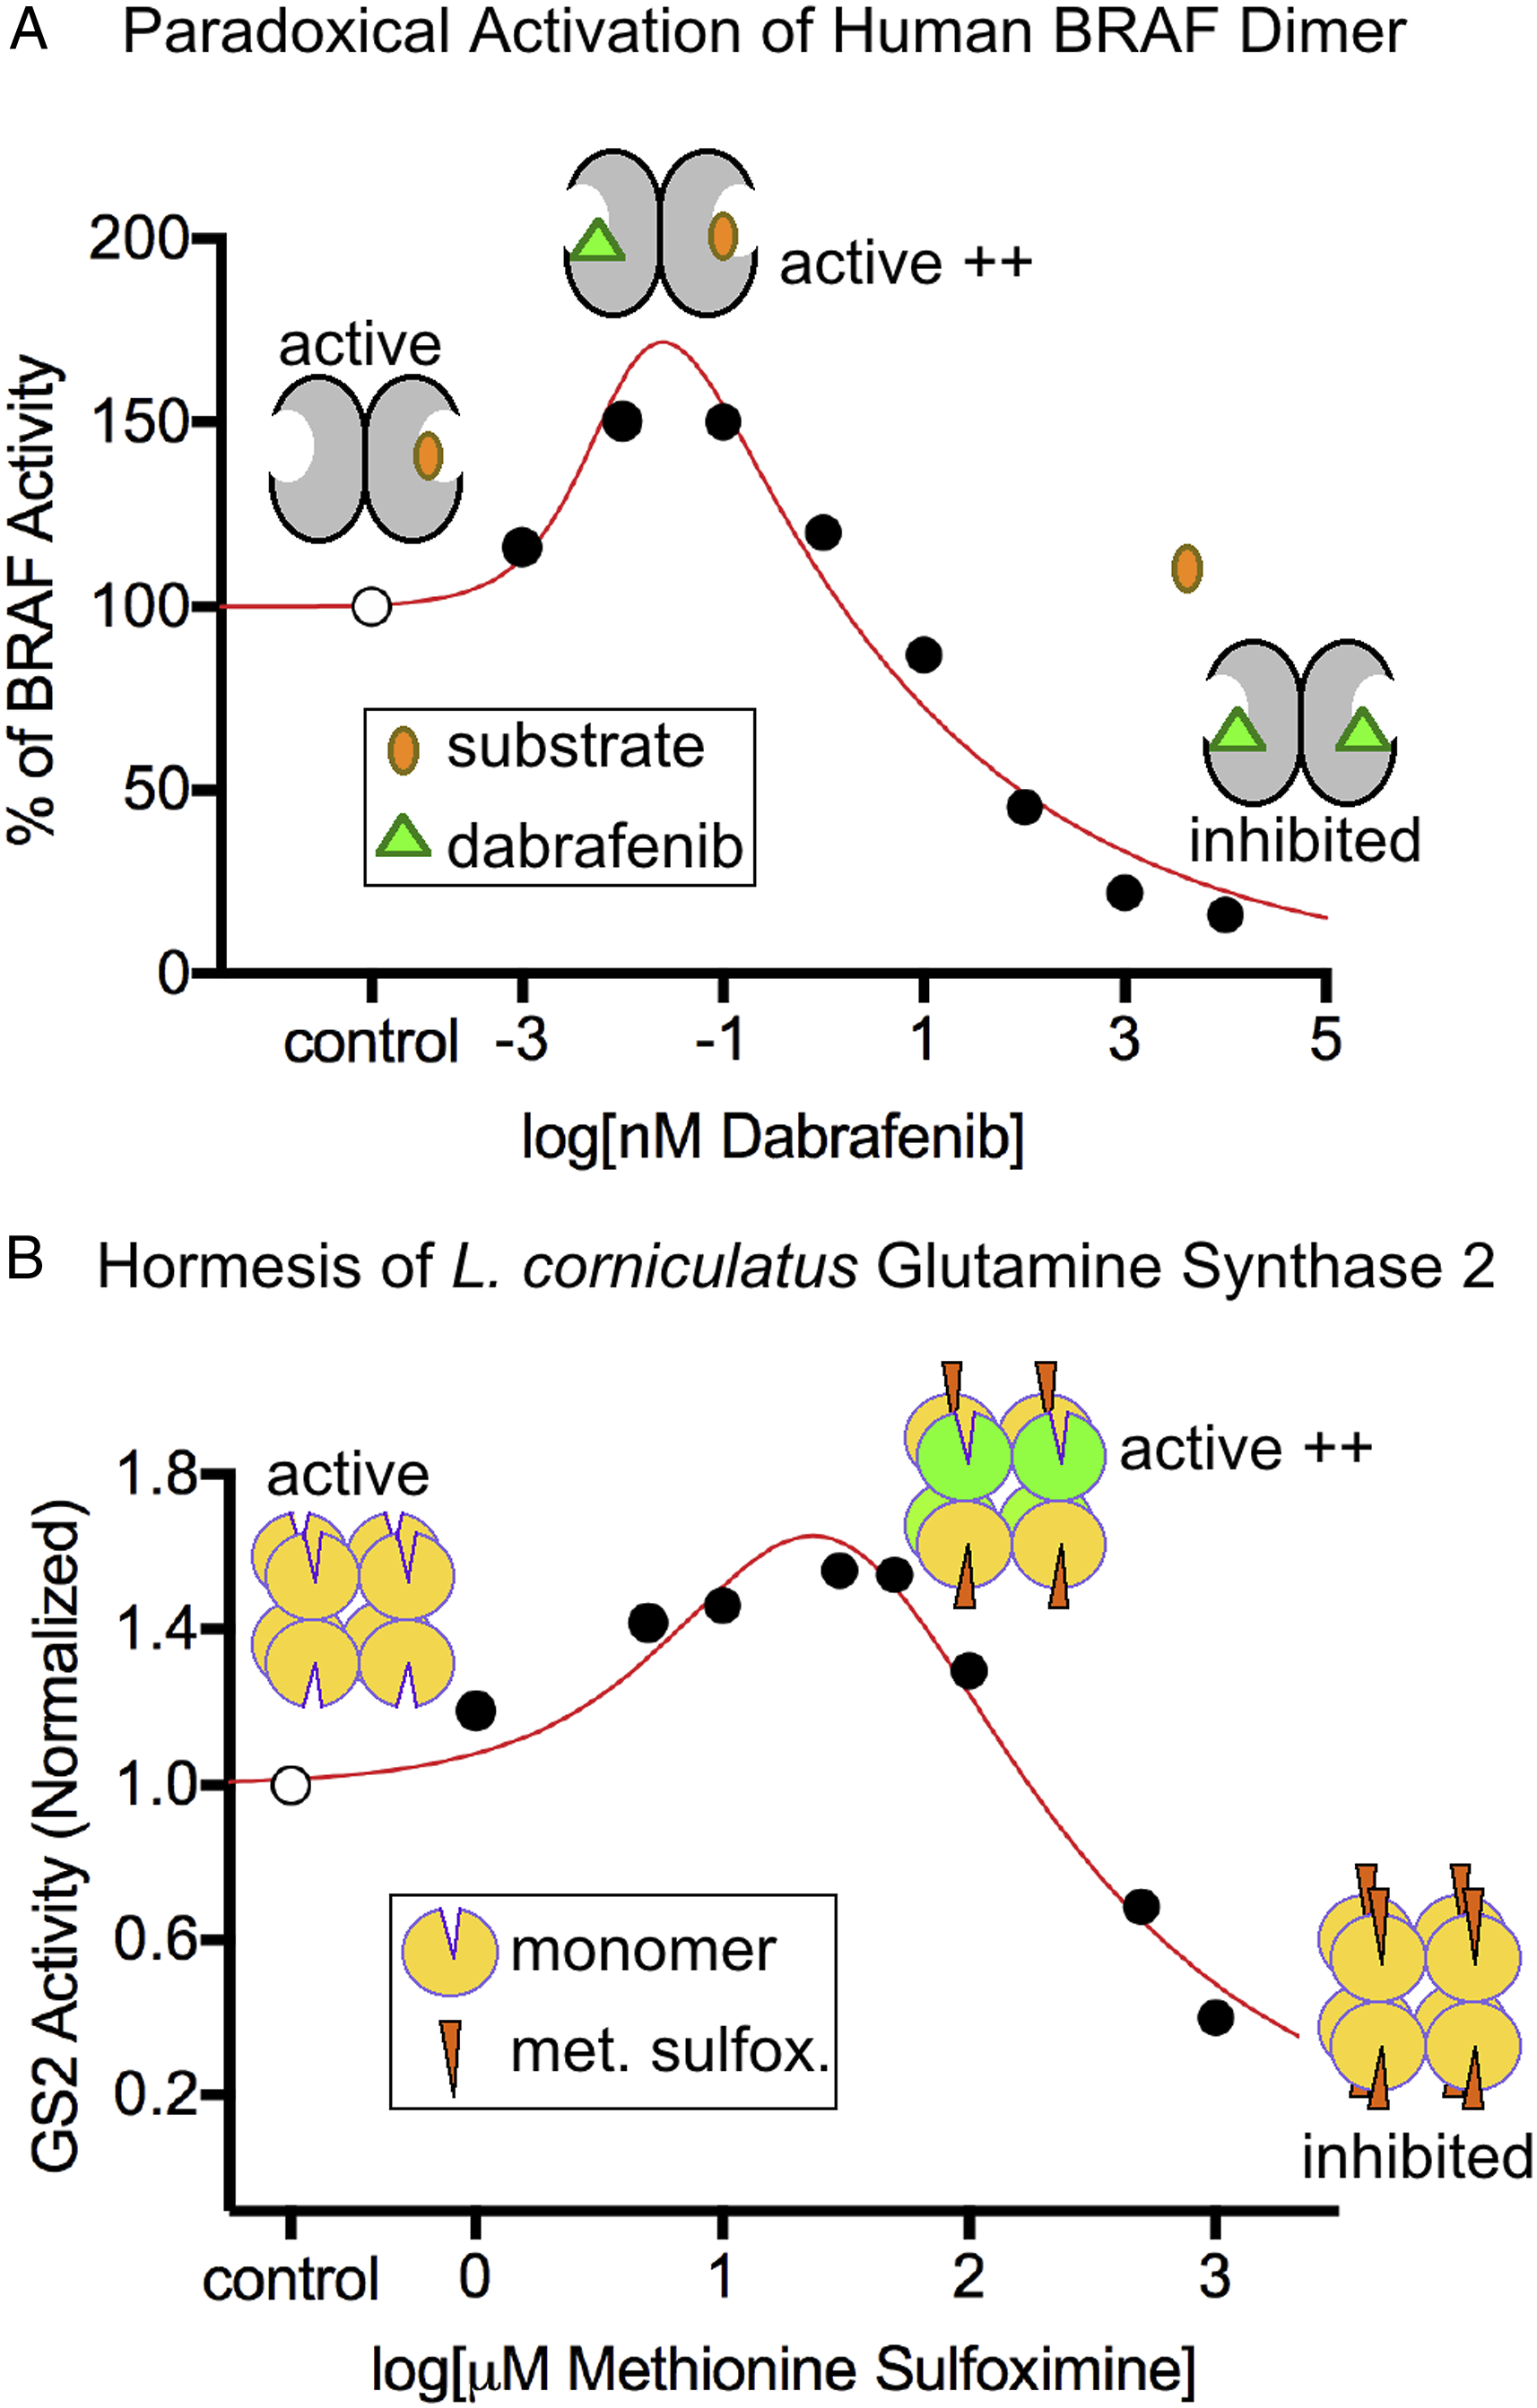
A conserved mechanism can be used to describe the hormetic dose-response that occurs in the three molecular systems we discussed involving PCNA, BRAF, or GS2 (Figures 2E and 4A and B). Initially, a protein homo-multimer (dimer, trimer, or octamer) interacts with substrate to produce some response. A competitor is added to the system, but at low doses the competitor and substrate bind to different sites on the same multimer, and the measured response is enhanced. In contrast, high doses of competitor prevent the substrate from binding the multimer and the measured response is eliminated. The similarity between the hormesis observed in BRAF and GS2 assays is obvious because substrate conversion is the measured response. For the PCNA binding assays, the measured response is the fluorescence anisotropy of the substrate, PL peptide, and UNG2 is the inhibitor. The fact that a similar mechanism of hormesis can be invoked for binding assays and activity assays would appear to strengthen the conservation of this molecular mechanism. This is despite important differences between the PCNA system and the BRAF and GS2 systems, such as the non-equilibrium conditions of the enzyme activity assays and the dependence of BRAF and GS2 on allostery.
Outlook and Conclusions
Dose-response curves are widely used in biologic, toxicologic, and pharmacologic research. In most studies, dose-response relationships can adequately be described using a standard symmetric sigmoidal model. However, hormesis is often found when low dose effects are examined in dose-response studies, and the discovery of hormetic dose-response relationships is on the rise in all areas of research. 1 The universality of the hormetic dose-response curve is not surprising considering the universality of the standard dose-response. The importance of the hormetic dose-response relationship and the value of its consideration is clear from this report where we discuss hormetic phenomena that are both clinically (BRAF) and commercially (GS2) relevant. Molecular mechanisms of hormesis can be rationalized for these enzyme multimers, and the oligomeric features of these proteins that promote hormesis through multi-site ligand/substrate binding are conserved with PCNA. The molecular hormesis observed in BRAF and GS2 assays directly contribute to hormetic outcomes on the cell and organism level. For BRAF, paradoxical activation by low doses of inhibitors leads to elevated phosphorylation of protein targets and promotion of cell growth.34,35 For GS2, activation by low doses of herbicides stimulates plant growth by promoting reassimilation of photorespiratory ammonia.26,36,37 However, for most accounts of hormesis on the organism level, a single distinct molecular basis has not been discovered. In some cases, there may not be a direct molecular mechanism and a non-specific or receptor-based mechanism prevails. There is also no requirement that hormesis on the molecular level will manifest as a hormetic response on the cell or organism level. Our observations of hormesis using synthetic PL peptide, for example, were purely experimental and do not directly translate to living systems. Moreover, the interrelations observed in this study for hormesis parameters may also manifest in a different way on the cell or organism level. 31 More research is needed to span the gap between the molecular level and hormesis in higher biological levels.
There are likely specific features of proteins and other macromolecules that make them susceptible to hormetic responses. We describe one type of molecular mechanism where multimeric proteins can simultaneously interact with more than one substrate or ligand. Variations are known to exist even in this category; for example, BRAF-CRAF heterodimers undergo paradoxical activation, 38 eliminating the requirement for a homo-multimer. There are also multiple ligands that produce paradoxical activation in BRAF and CRAF, and these compounds have different efficacies and potencies.25,32,38 With at least ten thousand reports of hormesis in different fields of research, 1 more than one general molecular mechanism likely exists, including the possibility that protein multimers are not involved. We anticipate that identifying and categorizing additional features of hormesis in molecular systems will facilitate our understanding of hormetic dose-response relationships throughout all of biology. This may allow us to better predict or rationalize hormetic dose-responses that can occur in cells and organisms across a variety of clinical, toxicologic, and pharmacologic settings.
Footnotes
Acknowledgments
The authors thank Drs. Daniel Manvich and Randy Strich (Rowan University) for helpful discussion and critical reading of the manuscript.
Author Contributions
SNG and BPW designed research, SNG performed experiments, and RGB contributed analytic tools. All authors analyzed data and contributed to writing the manuscript.
Declaration of Conflicting Interests
The author(s) declared no potential conflicts of interest with respect to the research, authorship, and/or publication of this article.
Funding
The author(s) disclosed receipt of the following financial support for the research, authorship, and/or publication of this article: This work was supported by National Institutes of Health grant R01GM135152 (BPW).