
Abstract
Objective:
We aimed to formulate and validate prognostic nomograms that can be used to predict the prognosis of patients with upper tract urothelial carcinoma (UTUC).
Methods:
By consulting the Surveillance, Epidemiology, and End Results (SEER) database, we identified patients who were surgically treated for UTUC between 2004 and 2013. Variables were analyzed in both univariate and multivariate analyses. Nomograms were constructed based on independent prognostic factors. The prognostic nomogram models were established and validated internally and externally to determine their ability to predict the survival of patients with UTUC.
Results:
A total of 4990 patients were collected and enrolled in our analyses. Of these, 3327 patients were assigned to the training set and 1663 to the validation set. Nomograms were effectively applied to predict the 3- and 5-year survivals of patients with UTUC after surgery. The nomograms exhibited better accuracy for predicting overall survival (OS) and cancer-specific survival (CSS) than the tumor-node-metastasis (TNM) staging system and the SEER stage in both the training and validation sets. Calibration curves indicated that the nomograms exhibited high correlation to actual observed results for both OS and CSS.
Conclusions:
The nomogram models showed stronger predictive ability than the TNM staging system and the SEER stage. Precise estimates of the prognosis of UTUC might help doctors to make better treatment decisions.
Introduction
Upper tract urothelial carcinoma (UTUC) is a rare malignancy that accounts for 5% to 10% of all urothelial tumors. 1 The primary form of therapy for UTUC is radical nephroureterectomy with bladder cuff removal. 2 However, many patients may not be the candidates for surgery due to poor functional status or other complications. 3 At the time of diagnosis, 20% to 40% of patients present with locally advanced disease and lymph node metastases. 4 Moreover, radical nephroureterectomy has a 26% to 38% risk of postoperative complications and has significant risks, including chronic renal failure-induced cardiovascular morbidity. 5,6 Improved risk stratification and accurately predicting postoperative prognosis could help guide decisions about follow-up arrangements and multimodal treatment for patients with poor prognosis. 7,8
At present, most clinicians make survival predictions for patients with UTUC based on the American Joint Committee on Cancer (AJCC) tumor-node-metastasis (TNM) staging system. 9 However, this system predicts the prognosis of the patient population, but cannot predict individual patient outcomes. 10 In addition, there are several factors, such as age, marital status, tumor location, grade, and administration of perioperative radiotherapy, that can also influence the survival of patients with UTUC. 2,11,12 Therefore, there is an urgent need to develop a clinical prediction model of prognosis for UTUC considering both patient status and tumor characteristics.
Nomogram models are becoming popular predictive tools to assess the risk of death or recurrence in many diseases. 13 Nomograms have been widely used in a variety of cancers because of their ability to handle complexity in a systematic and unbiased manner. 14 –16 Nevertheless, to the best of our knowledge, clinical nomograms predicting cancer-specific survival (CS) specifically among patients with primary UTUC have been seldom studied. In this study, we built predictive nomograms for patients with UTUC for visual estimation and then validated them based on data from the Surveillance, Epidemiology, and End Results (SEER) database.
Materials and Methods
Patients
The data of patients with UTUC were derived from the SEER database. This database is publicly accessible. It contains general messages from patients, primary tumor characteristics, treatments, survival, and follow-up. 17 We included adult patients (≥18 years) diagnosed between 2004 and 2013 with renal pelvis or ureter tumor as their first cancer diagnosis. The site codes C65.9 and C66.9 and histological codes (International Classification of Diseases for Oncology-3: 8120, 8122, 8130, and 8131) were used to identify the patients. Patients were excluded if clinical information (such as race, marital status, tumor grade, laterality, cause of death, tumor location, stage, survival months, and follow-up months) were unknown. Patients who did not undergo surgery were also excluded. Finally, the included patients were randomly divided into the training cohort set (2/3) and the validation cohort set (1/3). Data downloaded from SEER do not require patients’ informed consent and may be reproduced or copied without permission.
Variables
Data regarding patient and tumor characteristics were used for further analysis, including age, sex, race, marital status, laterality, tumor location, grade, T stage, N stage, M stage, and follow-up duration. Patients were divided into a younger age group (<65) and an older age group (≥65), and age was classified as a categorical variable in an attempt to identify connections between age at the time of diagnosis and survival. The AJCC TNM staging system 6th edition was used, and the study was limited to the time period between 2004 and 2013, since this edition was published in 2004. For overall survival (OS), death from any cause was defined as an event. For CSS, death from UTUC was considered an event.
Statistical Analyses
Categorical data are shown as frequencies and proportions and were compared using the χ2 test or Fisher exact test. All included patients were randomly divided into 2 sets using SPSS software. Cox proportional hazard regression was applied to identify significant prognostic factors with hazard ratios and 95% confidence intervals (95% CIs). Variables in the univariate analysis with P values <.05 were selected for multivariate analysis using backward stepwise regression (likelihood ratio). The nomogram models of OS and CSS in patients with UTUC were constructed based on the multivariate analysis results in the training set. The accuracies of the clinical OS and CSS nomograms were estimated by internal validation using the training set and external validation using the validation set. The concordance index (C-index) was used to assess the discriminatory ability of the nomograms. 18 Comparisons between the nomogram and the TNM staging system (6th edition) and the SEER stage were evaluated using the area under receiver operating characteristic curve (AUC). Calibration curves were also adopted to visually evaluate the nomogram performance, which plotted the predictive estimate of models against the actual observed outcomes. SPSS software was used for all statistical analysis (version 23; SPSS Inc, Chicago, Illinois), along with version 3.5.1 of the R software (Institute for Statistics and Mathematics, Vienna, Austria; r-project.org). A statistical variation of P < .05 was considered to be significant.
Results
Patient Characteristics
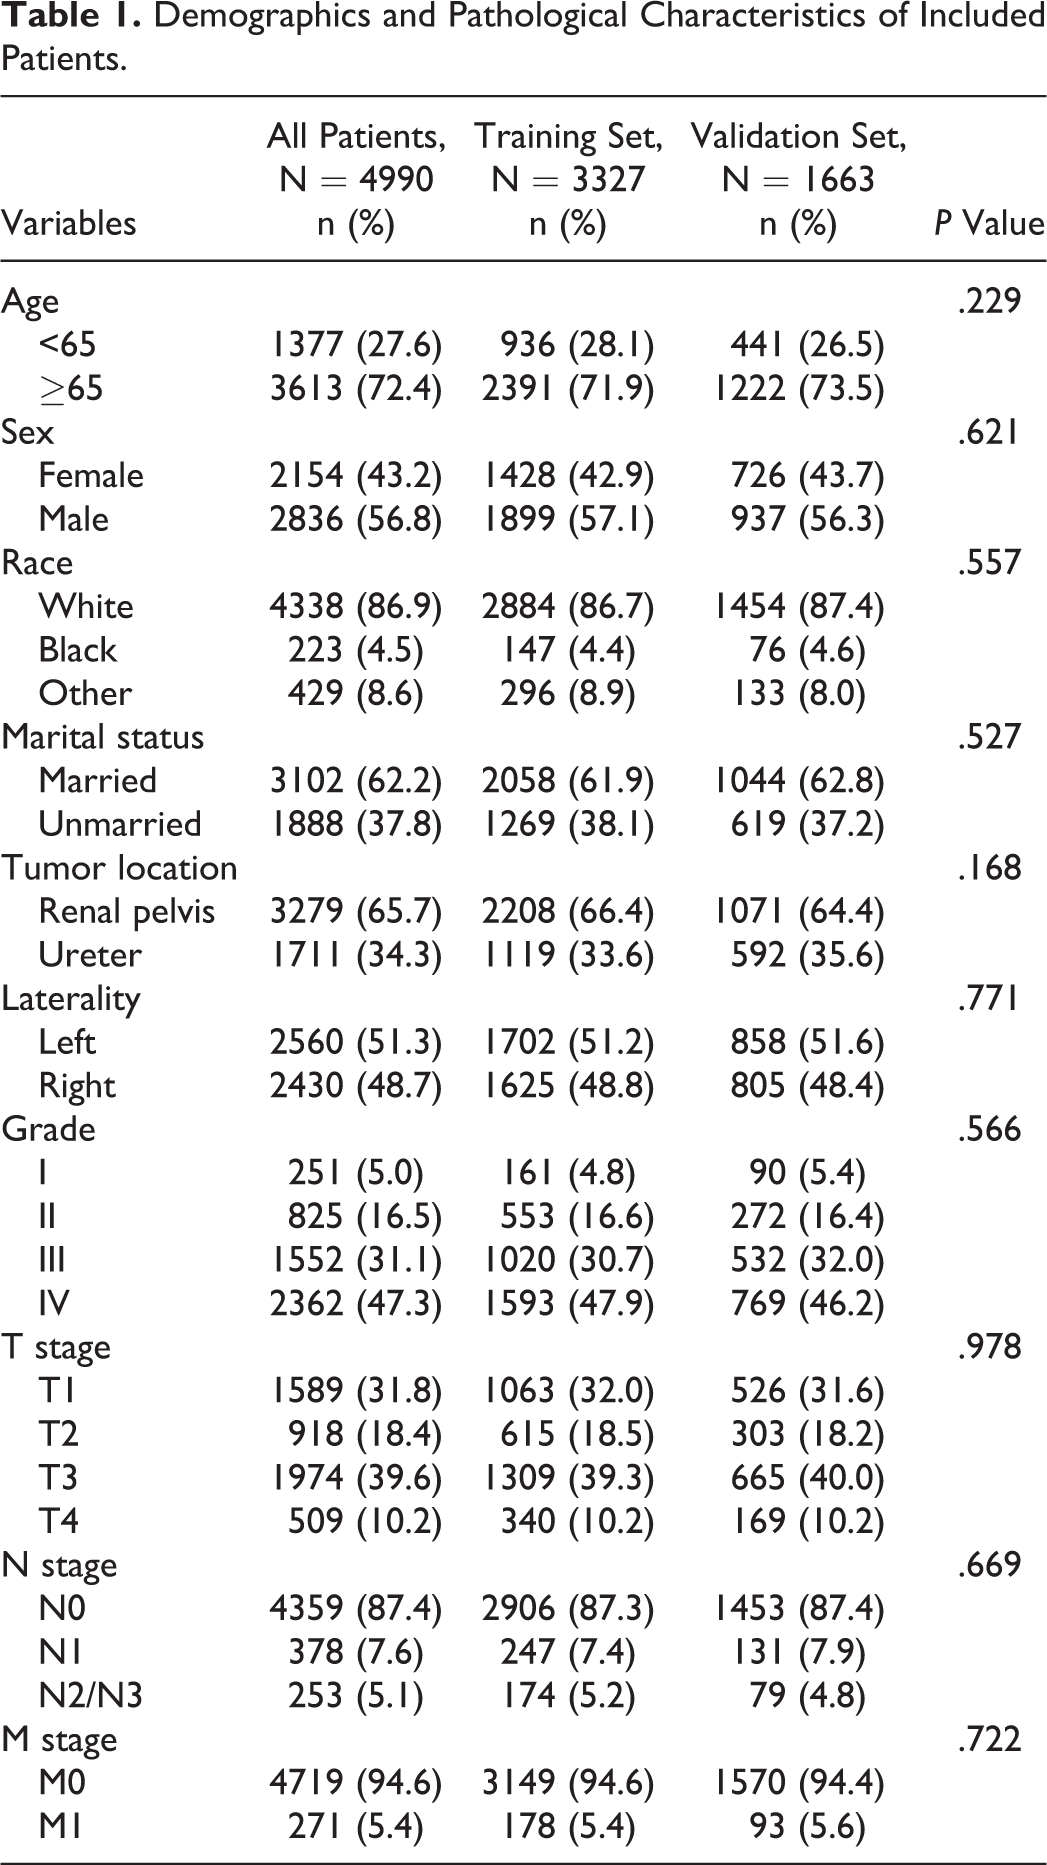
After screening all patients from the SEER database according to the inclusion and exclusion criteria, 4990 patients with UTUC were included in the study. They were randomly assigned into the training set (n = 3327) and the validation set (n = 1663). Figure 1 shows the specific screening process. Most of the patients in both sets were elderly (≥65 years), white, and married. There were 2836 (56.8%) men and 2154 (43.2%) women. The most common tumor site for UTUC was the renal pelvis (65.7%). Left-sided tumors were observed in 2560 (51.3%) patients and right-sided tumors in 2430 (48.7%) patients. Most patients were categorized as having grade IV (47.3%) and stage T3 (39.6%) cancer. Table 1 displays the baseline characteristics of included patients overall and by the 2 sets.

Flowchart for screening eligible patients.
Demographics and Pathological Characteristics of Included Patients.
Nomogram Construction
Age, sex, marital status, grade, T stage, N stage, and M stage were significantly correlated with OS in the univariate analysis in the training set (Table 2). All the significantly different variables were included in the multivariate analysis. Finally, 6 variables (age, marital status, grade, T stage, N stage, and M stage) were confirmed as independent risk factors of OS. As shown in Table 3, 7 variables were associated with CSS in the univariate analysis in the training set. Cox analysis adjusted for significant prognostic factors and found that age, laterality, grade, T stage, N stage, and M stage were independent predictive factors of CSS. Using the independent variables established within the training group, nomograms predicting the 3- and 5-year OS and CSS were constructed (Figure 2A and B).
Univariate and Multivariate Analyses of Overall Survival in the Training Set.

Abbreviations: CI, confidence interval; HR, hazard ratio.
Univariate and Multivariate Analyses of Cancer-Specific Survival in the Training Set.

Abbreviations: CI, confidence interval; HR, hazard ratio.

Nomograms to predict the 3- and 5-year OS (A) and CSS (B) for patients with UTUC. CSS indicates cancer-specific survival; OS, overall survival; UTUC, upper tract urothelial carcinoma.
Nomogram Validation
The internal validation process was conducted using the training set, and the C-index of the nomograms for OS and CSS were 0.712 (95% CI, 0.700-0.724) and 0.769 (95% CI, 0.752-0.786), respectively. The validation set was used for external validation, and the C-indexes of the nomograms for OS and CSS were 0.702 (95% CI, 0.684-0.720) and 0.771 (95% CI, 0.746-0.796), respectively. Calibration curves for 3- and 5-year prediction of OS and CSS are shown in Figures 3 and 4. The calibration curves were close to the actual curves, which demonstrated good predictive ability of the nomograms in both the training and validation sets. Analysis of the AUC values indicated that the predictive abilities of the nomograms were significantly better than those of the TNM 6th edition staging system and the SEER stage in both the training and validation sets (Table 4).
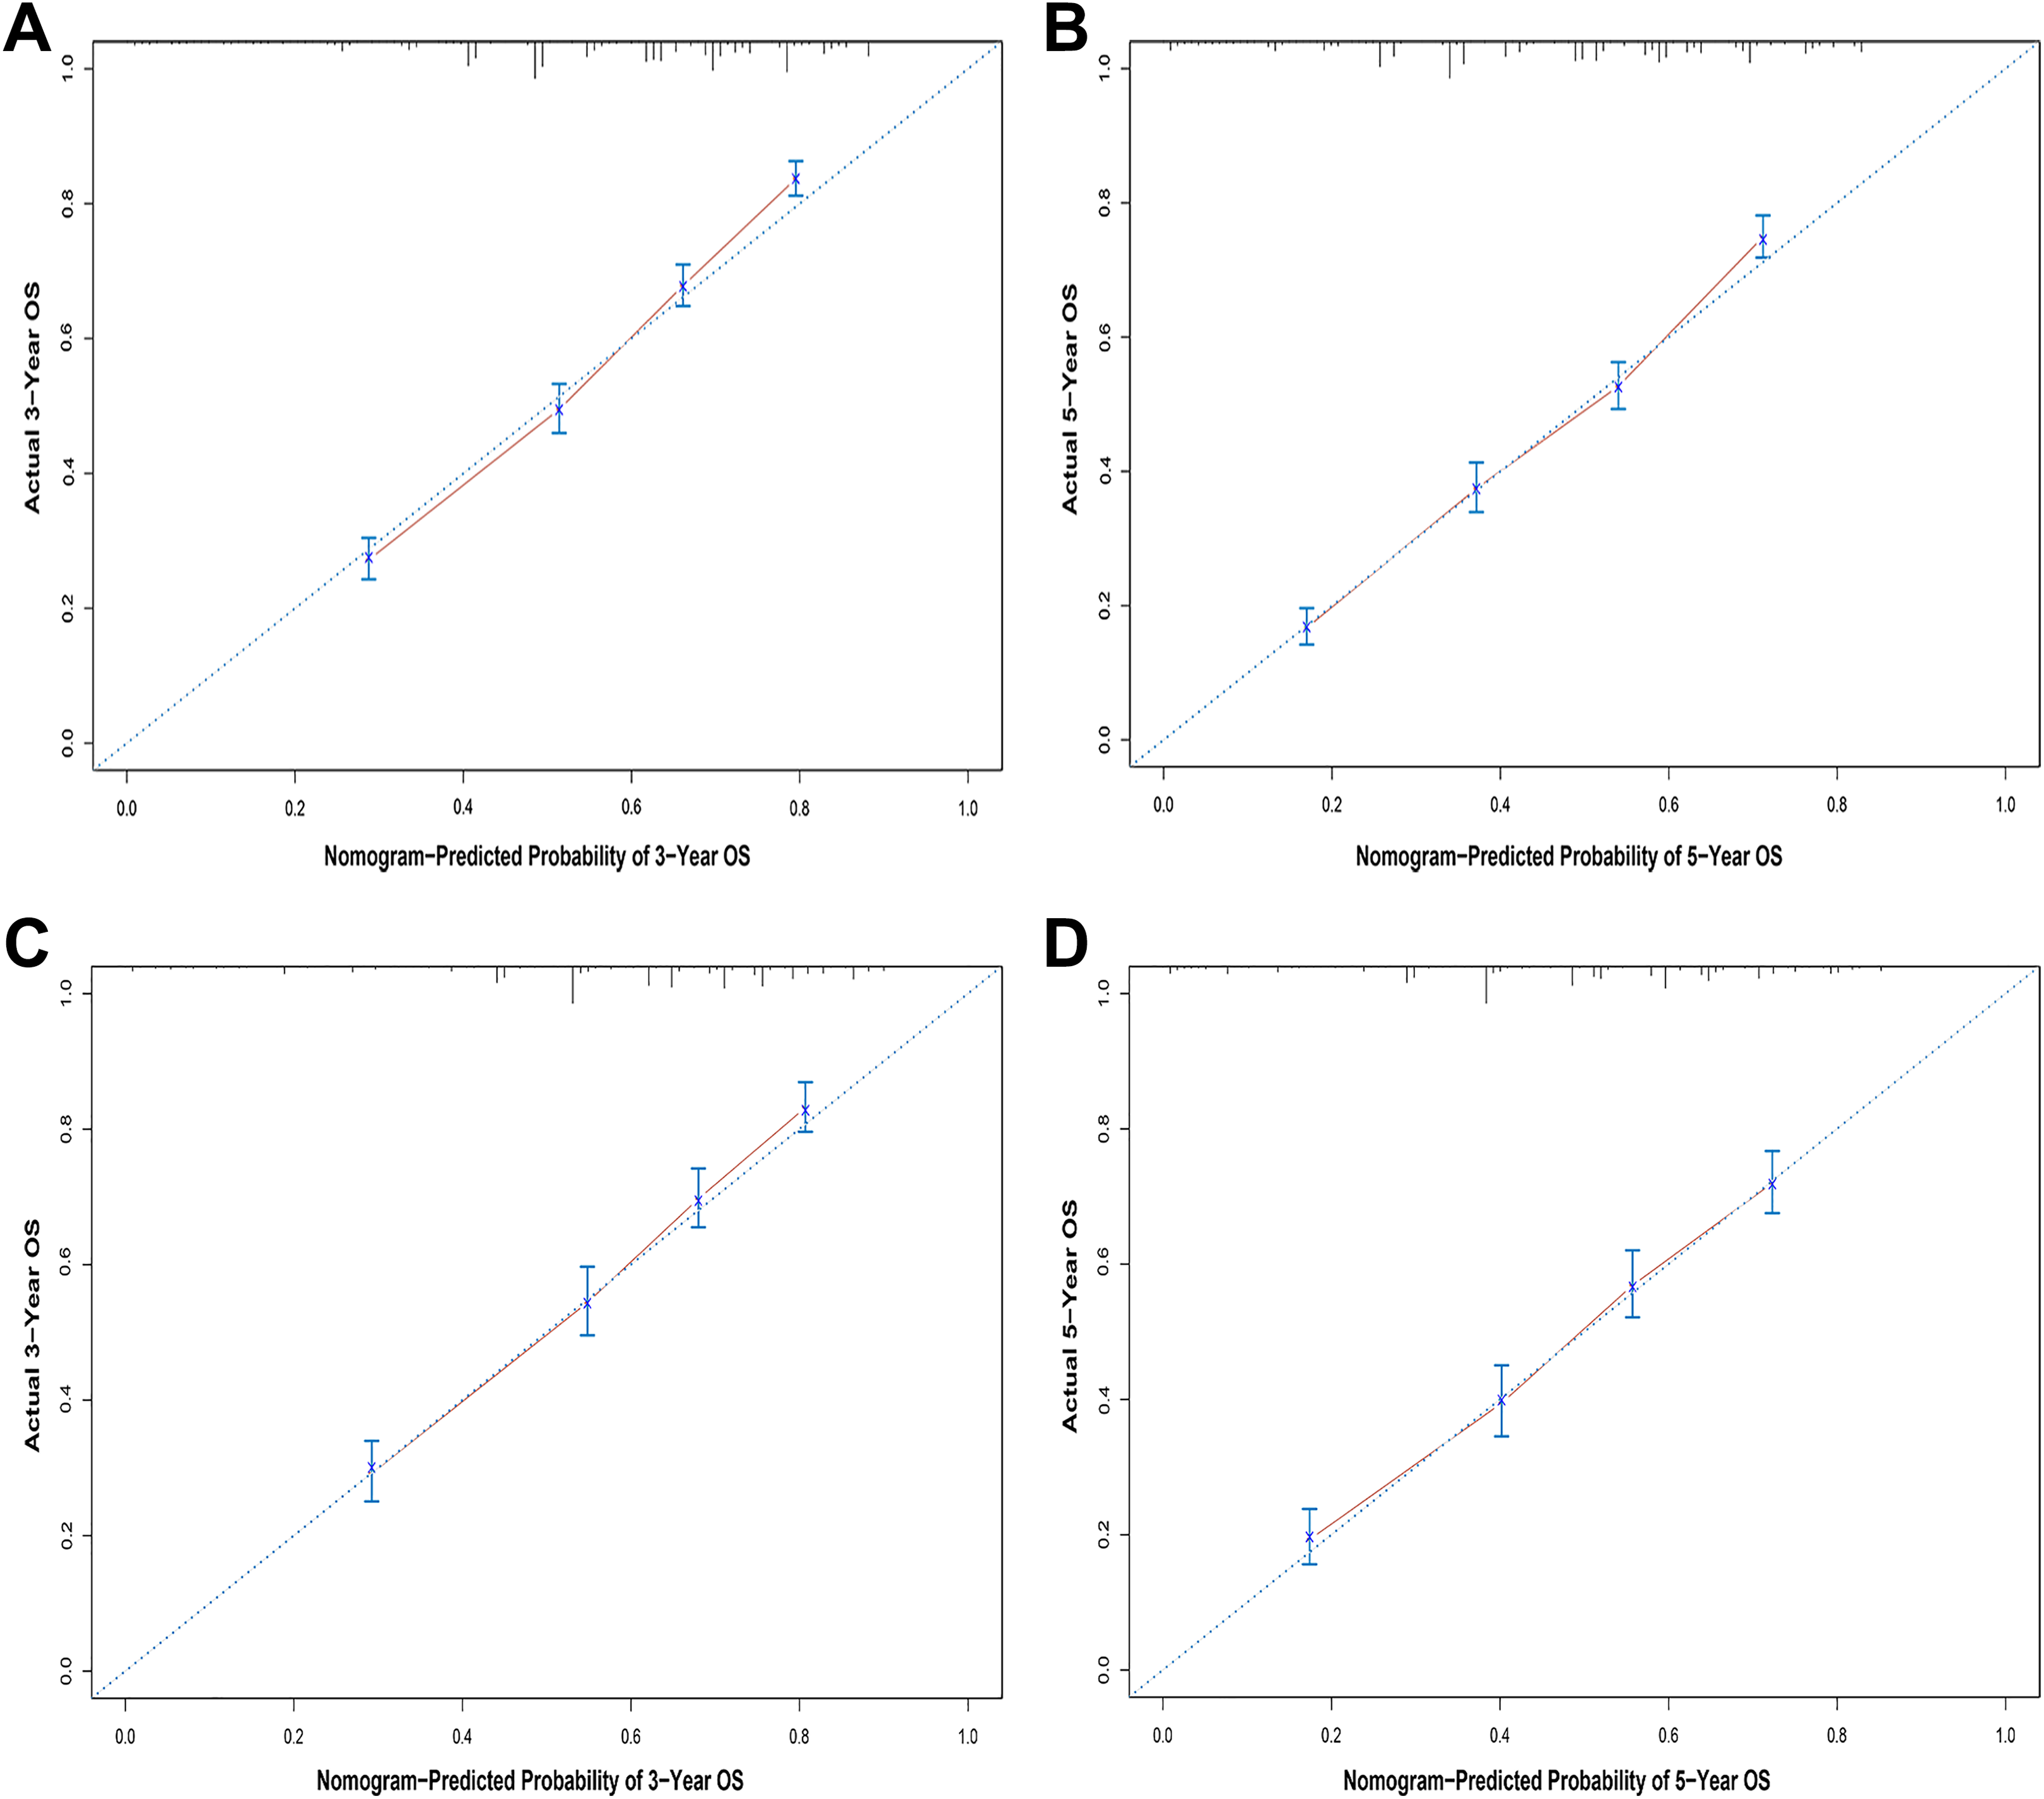
Calibration plots of the nomogram for 3- and 5-year overall survival prediction in the training set (A, B) and the validation set (C, D).
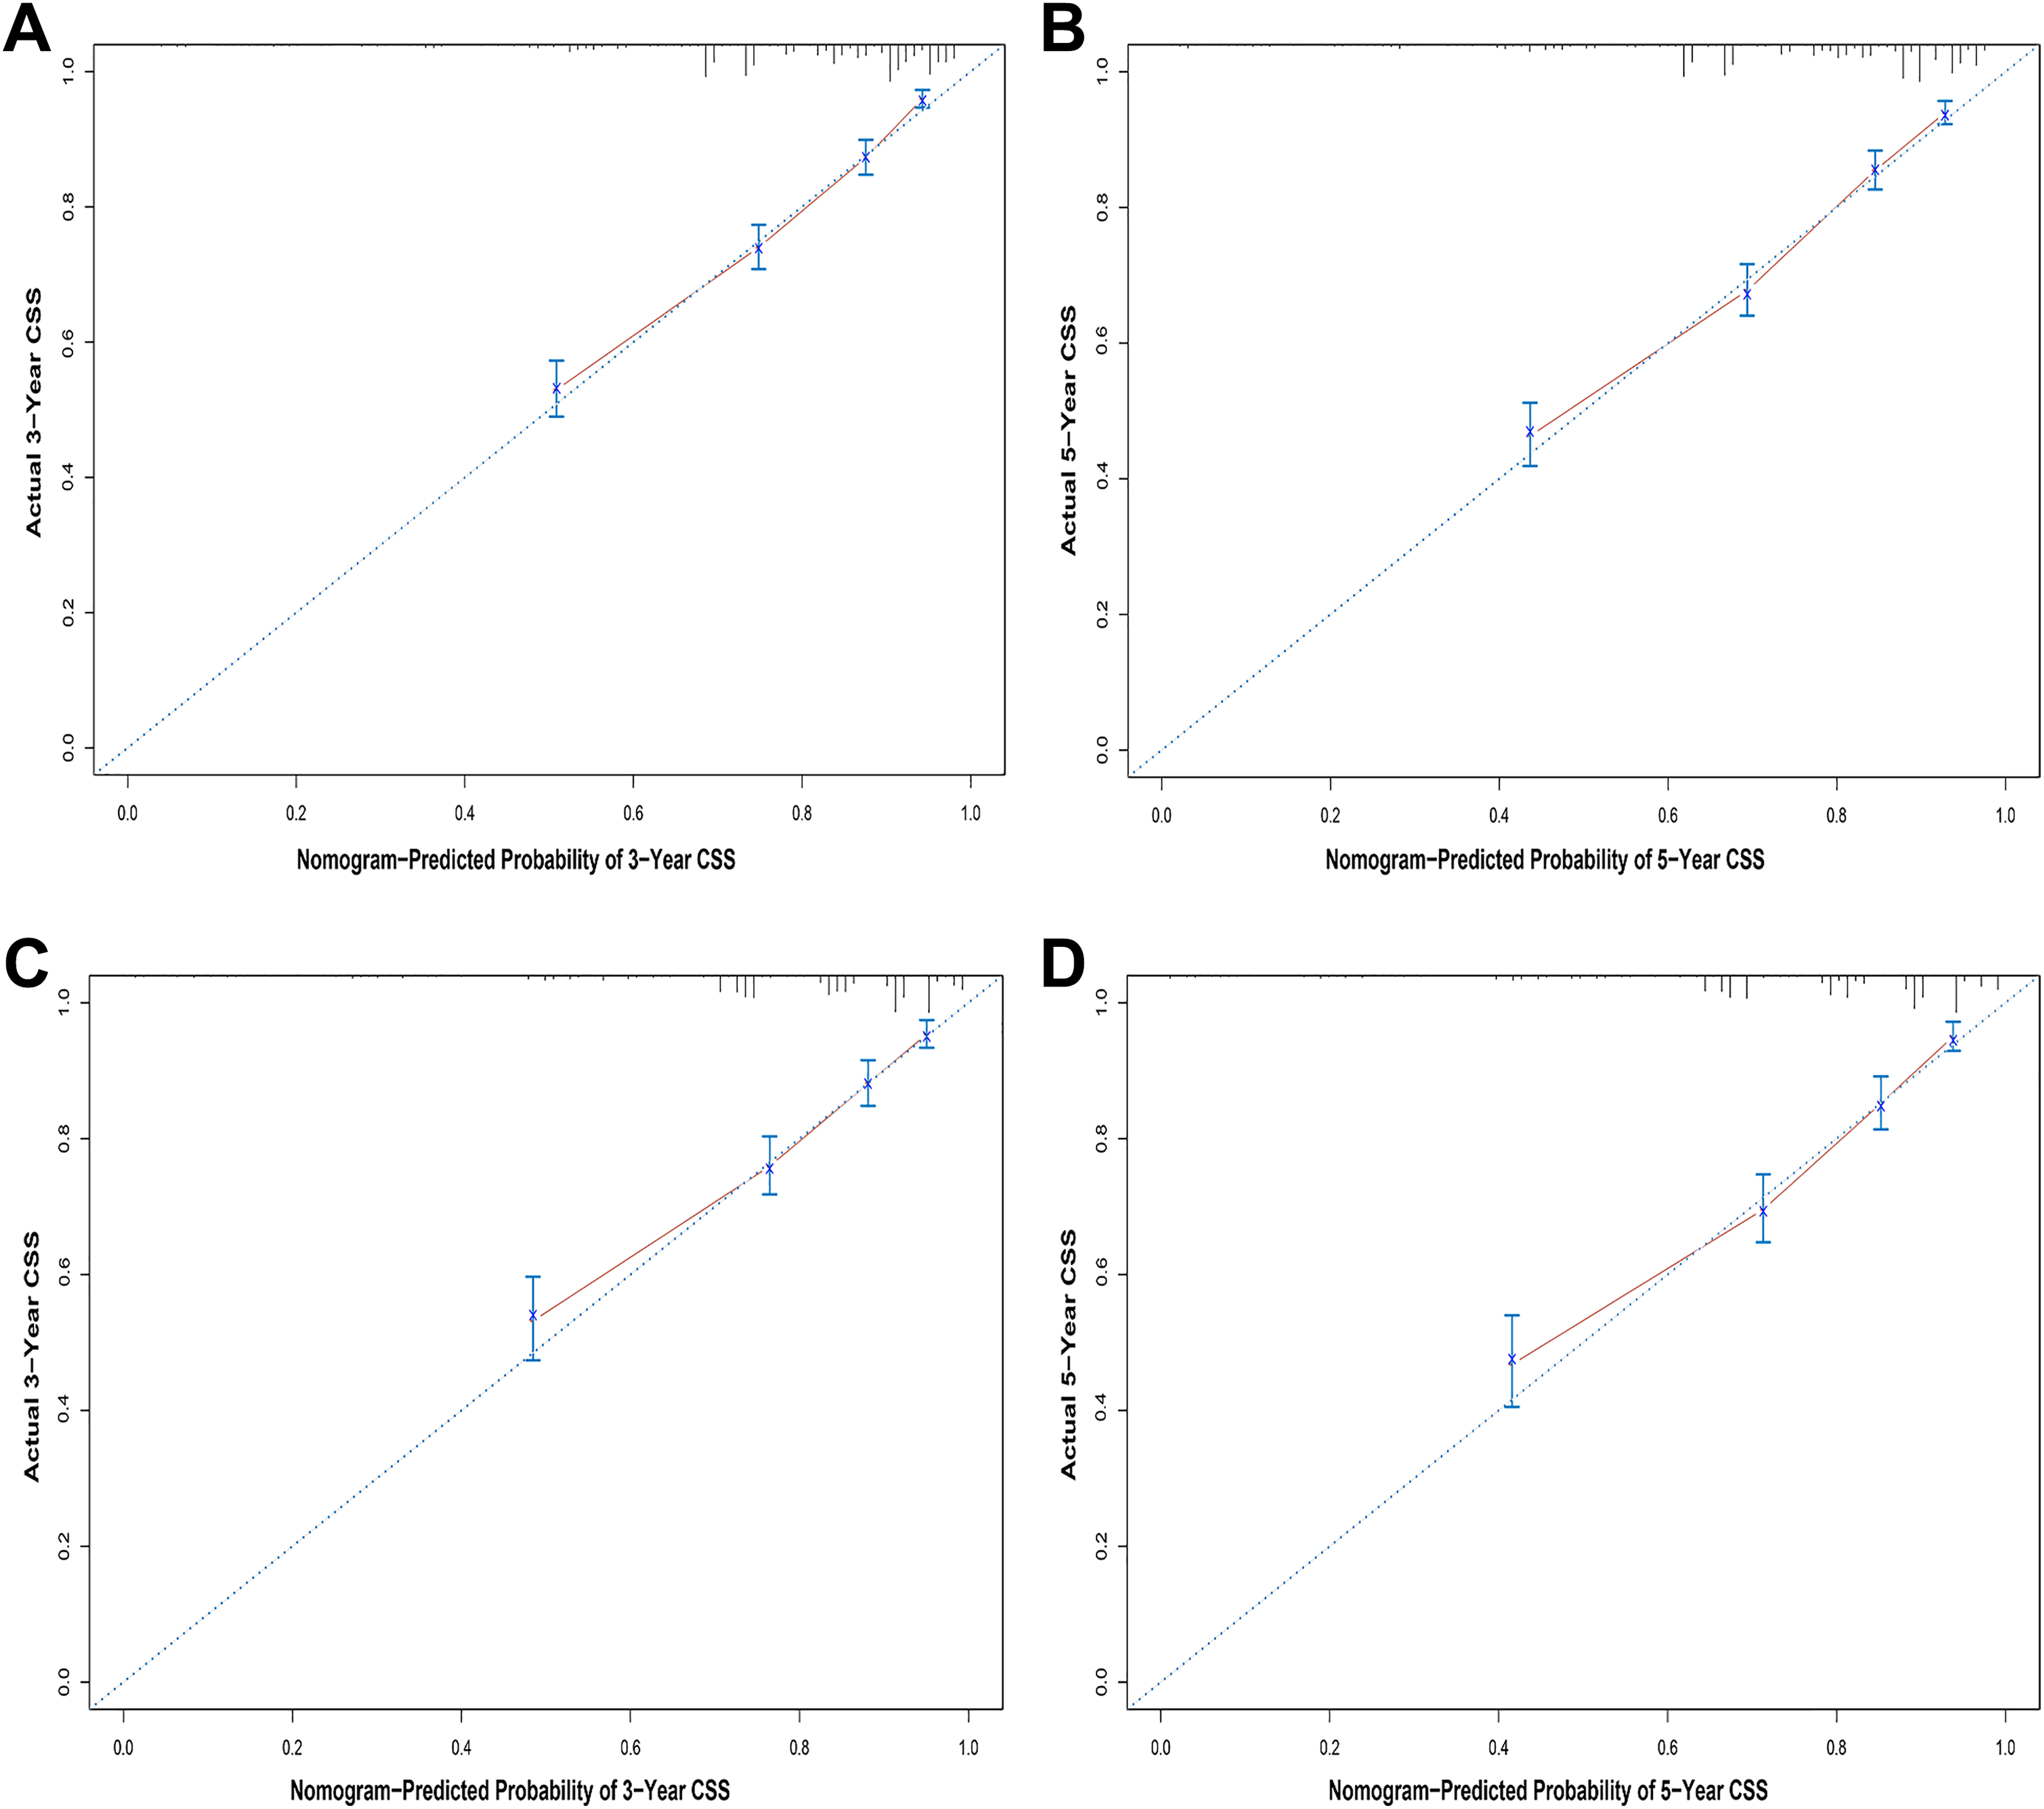
Calibration plots of the nomogram for 3- and 5-year cancer-specific survival prediction in the training set (A, B) and the validation set (C, D).
Comparison of AUC Between the Nomogram, TNM, and SEER Stages in Patients With UTUC.

Abbreviations: AUC, area under the curve; CSS, cancer-specific survival; OS, overall survival; SEER, Surveillance, Epidemiology, and End Results; TNM; UTUC, with upper tract urothelial carcinoma.
Discussion
The present study aimed to establish and validate relatively accurate nomogram models to predict survival in patients with UTUC. Data from 4990 patients were obtained from the SEER database for analysis. We successfully established 3- and 5-year OS and CSS prognostic nomograms for patients with UTUC, and both external and internal nomogram validation indicated favorable predictive effectiveness. Additionally, the nomograms had a stronger predictive ability than the 6th AJCC TNM staging system and the SEER stage. For example, consider 2 T2N0M0 patients with UTUC: (case A) a 60-year-old married patient with grade III UTUC and (case B) a 66-year-old unmarried patient with grade II UTUC. According to our results, they receive 58.5 and 105 points in the OS nomogram, respectively, and the estimated 5-year OS probabilities are 70% and 54%, respectively (Figure 2). In contrast, both patients would be considered stage II according to the traditional TNM staging system, which indicates identical outcomes. Therefore, the proposed nomograms provide a comprehensive evaluation profile to help physicians make better treatment decisions and estimate prognosis in patients with UTUC.
As a data visualization tool of linear statistical models, nomograms are extensively used in biomedical studies, and they have better predictive abilities than a single clinicopathologic factor. 19 Nomograms have been implemented as prognostic indicators in multiple malignancies and have shown a higher predictive ability than the SEER stage and the AJCC TNM staging system, highlighting their utility as a new standard or alternative. 20 –22 Nomograms are of great significance to clinicians and patients. 23 When a patient who was diagnosed with a tumor several years previously comes to the clinician, he or she is more concerned about his or her individual survival risk at this particular moment rather than the traditional risk since diagnosis. Our nomograms have the ability to build a practical bridge between clinicians and patients with UTUC. We can apply the clinical nomograms to clinical practice quickly and concisely according to the patient’s specific characteristics.
This study identified 6 independent prognostic predictors for patients with UTUC. Elderly patients (>65 years) had the worst OS and CSS, which was consistent with previous studies. Several studies have shown that age is an independent predictor that plays a contradictory role in the prognosis of UTUC. 24,25 Marital status has been shown to predict the prognosis of multiple cancers. 26,27 This is because there is less metastatic disease in married patients and they tend to have lower cancer-specific mortality. 28 In addition, married patients often have more social support and comfort and are more likely to be diagnosed early and receive definitive treatment. In our study, marital status was independently associated with survival in patients with UTUC, which was consistent with the results of previous studies. In addition to these factors, tumor grade, T stage, N stage, and M stage were also determined to predict the prognosis of patients with UTUC. The impact of tumor location of UTUC on prognosis is controversial. 29 –31 Ouzzane et al 29 found that tumor location was an independent prognostic factor in patients with UTUC. Patients with ureteral tumors had worse CSS than those with renal pelvic tumors. In addition, patients with both renal pelvis and ureter tumors had the worst outcome. However, Raman et al 31 demonstrated that tumor location was not a risk factor in UTUC; there was no difference in outcomes in patients with ureteral and renal pelvic tumors. Our study indicated that tumor location was not associated with OS or CSS.
Our study has several limitations. First, retrospective data were obtained from the SEER database for constructing the nomogram, potentially resulting in the risk of selection bias. Second, the specific plan of radiotherapy and chemotherapy is unavailable from the database. Additionally, comorbidities and complications can occur during the follow-up period, which need to be considered. All these factors should be taken into account to correct the effect of covariates on outcomes. Third, due to the rare specific mortality of UTUC, the assessment of the risk of recurrence may be more meaningful than the assessment of the risk of death. However, data on recurrence cannot be obtained from the SEER database. Finally, the proposed nomograms lack validation using external data.
In summary, based on a large study cohort, prognostic nomograms to assess the prognosis of UTUC were established, and their accuracy was higher than that of the SEER stage and the 6th TNM staging system. Precise estimates of the prognosis of UTUC might help doctors to assess patients’ actual conditions, select appropriate treatment options, and develop better follow-up plans.
Footnotes
Authors’ Note
GLZ and WZ designed, analyzed, and interpreted the data. All authors drafted and critically revised the article and have agreed to be accountable for all aspects of the work.
Declaration of Conflicting Interests
The author(s) declared no potential conflicts of interest with respect to the research, authorship, and/or publication of this article.
Funding
The author(s) received no financial support for the research, authorship, and/or publication of this article.